Pipeline metrics
Pipeline metrics, or measurements, monitor the throughput of logs and events in the microservices' pipelines. You can use these pipeline metrics to understand the status and health of each microservice.
The data that moves through microservices is broken down to and measured in events. (Each event is one message in Kafka and will result in one entry in Elasticsearch.) Since events are countable, the metrics quantify the throughput, allowing you to assess pipeline status and health.
BSPump
Several TeskaLabs microservices are built on the technology BSPump, so the names of the metrics include bspump.
Microservices built on BSPump:
Microservice architecture
The internal architecture of each microservice differs and might affect your analysis of the metrics. Visit our Architecture page.
The microservices most likely to produce uneven event.in and event.out counter metrics without actually having an error are:
- Parser/Parsec - This is due to its internal architecture; the parser sends events into a different pipeline (Enricher), where the events are then not counted in
event.out. - Correlator - Since the correlator assesses events as they are involved in patterns, it often has a lower
event.outcount thanevent.in.
Metrics
Naming and tags in Grafana and InfluxDB
- Pipeline metrics groups are under the
measurementtag. - Pipeline metrics are produced for microservices (tag
appclass) and can be further filtered with the additional tagshostandpipeline. - Each individual metric (for example,
event.in) is a value in thefieldtag.
All metrics update automatically once per minute by default.
bspump.pipeline
event.in
Description: Counts the number of events entering the pipeline
Unit: Number (of events)
Interpretation: Observing event.in over time can show you patterns, spikes, and trends in how many events have been received by the microservice. If no events are coming in, event.in is a line at 0. If you are expecting throughput, and event.in is 0, there is a problem in the data pipeline.
event.out
Description: Counts the number of events leaving the pipeline successfully
Unit: Number (of events)
Interpretation: event.out should typically be the same as event.in, but there are exceptions. Some microservices are constructed to have either multiple outputs per input, or to divert data in such a way that the output is not detected by this metric.
event.drop
Description: Counts the number of events that have been dropped, or messages that have been lost, by a microservice.
Unit: Number (of events)
Interpretation: Since the microservices built on BSPump are generally not designed to drop messages, any drop is most likely an error.
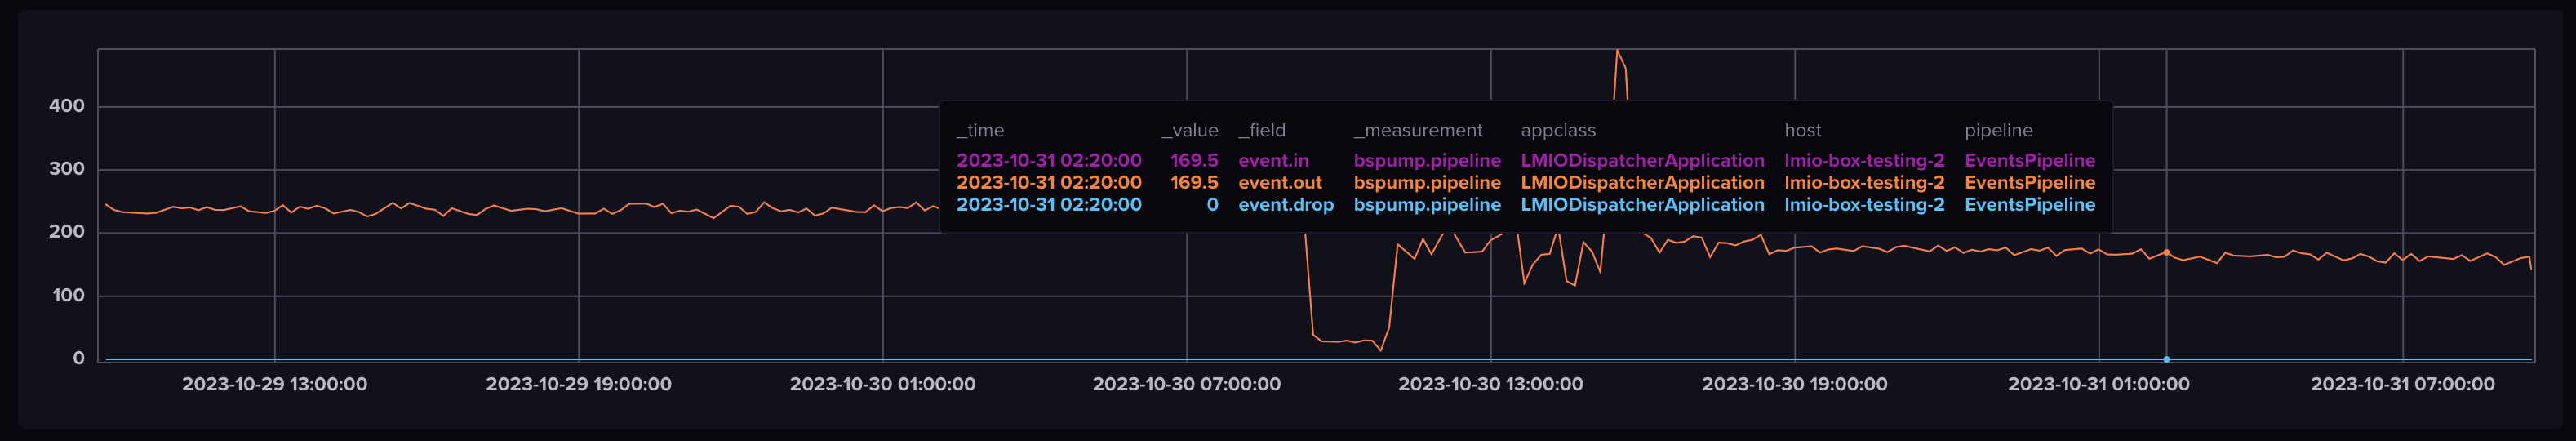 When you hover over a graph in InfluxDB, you can see the values of each line at any point in time. In this graph, you can see that
 event.out is equal to event.in, and event.drop equals 0, which is the expected behavior of the microservice. The same number of events are leaving as are entering the pipeline, and no events are being dropped.
warning
Description: Counts the number of warnings produced in a pipeline.
Unit: Number (of warnings)
Interpretation: Warnings tell you that there is an issue with the data, but the pipeline was still able to process it. A warning is less severe than an error.
error
Description: Counts the number of errors in a pipeline.
Unit: Number (of errors)
Interpretation: Microservices might trigger errors for different reasons. The main reason for an error is that the data does not match the microservice's expectation, and the pipeline has failed to process that data.
bspump.pipeline.eps
EPS means events per second.
eps.in
Description: "Events per second in" - Rate of events successfully entering the pipeline
Unit: Events per second (rate)
Interpretation: eps.in should stay consistent over time if If a microservice's eps.in slows over time unexpectedly, there might be a problem in the data pipeline before the microservice.
eps.out
Description: "Events per second out" - Rate of events successfully leaving the pipeline
Unit: Events per second (rate)
Interpretation: Similar to event.in and event.out, eps.in and eps.out should typically be the same, but they could differ depending on the microservice. If events are entering the microservice much faster than they are leaving, and this is not the expected behavior of that pipeline, you might need to address an error causing a bottleneck in the microservice.
eps.drop
Description: "Events per second dropped" - rate of events being dropped in the pipeline
Unit: Events per second (rate)
Interpretation: See event.drop. If eps.drop rapidly increases, and it is not the expected behavior of the microservice, that indicates that events are being dropped, and there is a problem in the pipeline.
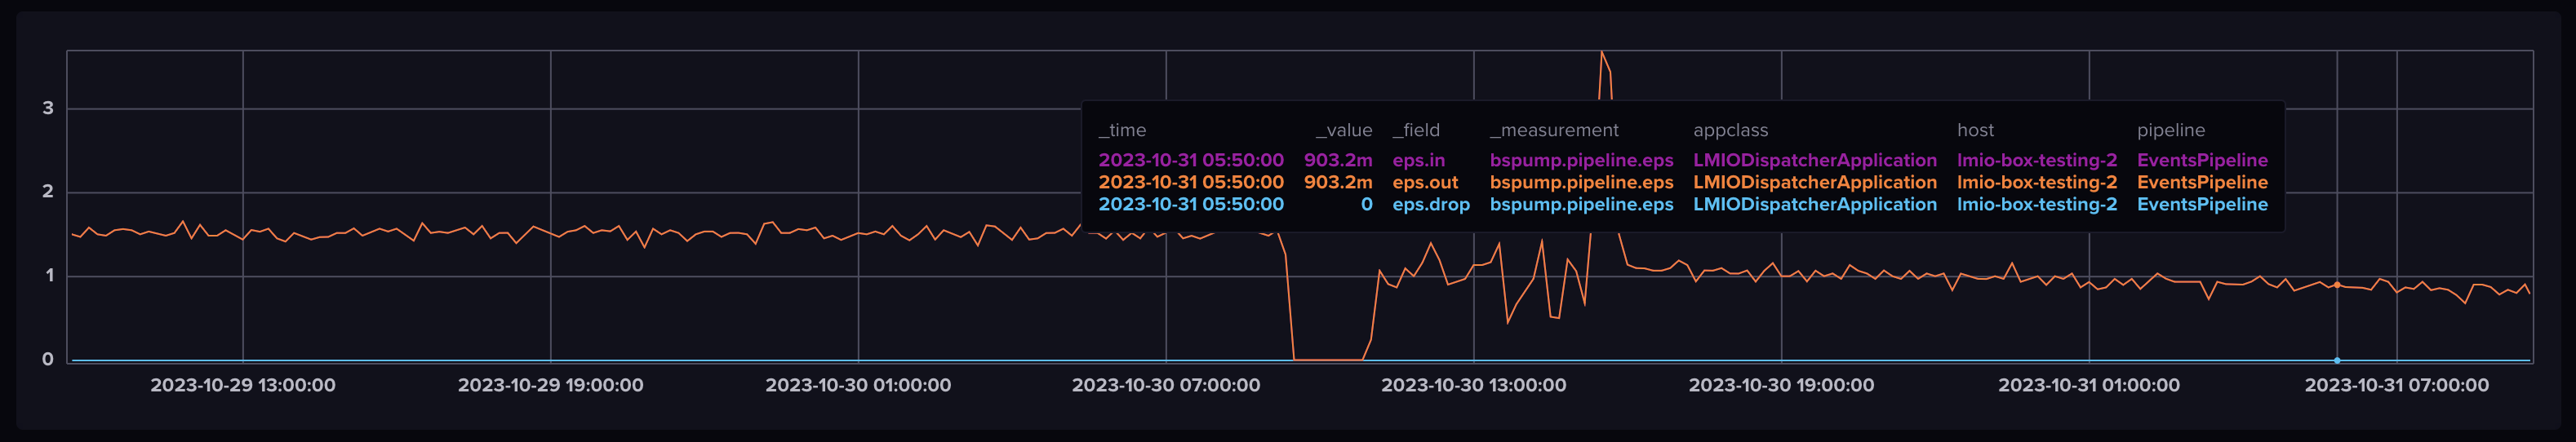 Similar to graphing
 event.in and event.out, the expected behavior of most microservices is for eps.out to equal eps.in with drop being equal to 0.
warning
Description: Counts the number of warnings produced in a pipeline in the specified timeframe.
Unit: Number (of warnings)
Interpretation: Warnings tell you that there is an issue with the data, but the pipeline was still able to process it. A warning is less severe than an error.
error
Description: Counts the number of errors in a pipeline in the specified timeframe.
Unit: Number (of errors)
Interpretation: Microservices might trigger errors for different reasons. The main reason for an error is that the data does not match the microservice's expectation, and the pipeline has failed to process that data.
bspump.pipeline.gauge
A gauge metric, percentage expressed as a number 0 to 1.
warning.ratio
Description: Ratio of events that generated warnings compared to the total number of successfully processed events.
Interpretation: If the warning ratio increases unexpectedly, investigate the pipeline for problems.
error.ratio
Description: Ratio of events that failed to process compared to the total number of successfully processed events.
Interpretation: If the error ratio increases unexpectedly, investigate the pipeline for problems. You could create a trigger to notify you when error.ratio exceeds, for example, 5%.
bspump.pipeline.dutycycle
The duty cycle (also called power cycle) describes if a pipeline is waiting for messages (ready, value 1) or unable to process new messages (busy, value 0).
In general:
- A value of 1 is acceptable because the pipeline can process new messages
- A value 0 indicates a problem, because the pipeline cannot process new messages.
Understanding the idea of duty cycle
We can use human productivity to explain the concept of the duty cycle. If a person is not busy at all and has nothing to do, they are just waiting for a task. Their duty cycle reading is at 100% - they are spending all of their time waiting and can take on more work. If a person is busy doing something and cannot take on any more tasks, their duty cycle is at 0%.
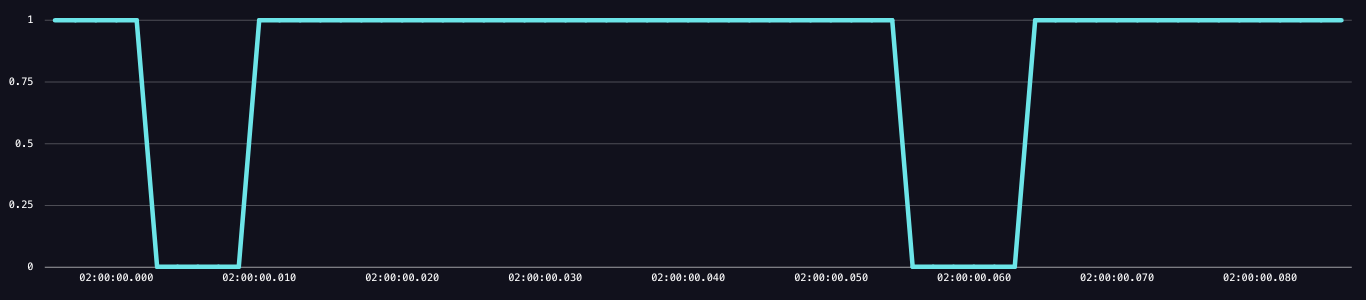 The above example (not taken from InfluxDB) shows what a change in duty cycle looks like on a very short time scale. In this example, the pipeline had two instances of being at 0, meaning not ready and unable to process new incoming events. Keep in mind that your system's duty cycle can fluctuate between 1 or 0 thousands of times per second; the duty cycle
 ready graphs you'll see in Grafana or InfluxDB will already be aggregated (more below).
ready
Description: ready aggregates (averages) the duty cycle values once per minute. While duty cycle is expressed as 0 (false, busy) or 1 (true, waiting), the ready metric represents the percentage of time the duty cycle is at 0 or 1. Therefore, the value of ready is a percentage anywhere between 0 and 1, so the graph does not look like a typical duty cycle graph.
Unit: Percentage expressed as a number, 0 to 1
Interpretation: Monitoring the duty cycle is critical to understanding your system's capacity. While every system is different, in general, ready should stay above 70%. If ready goes below 70%, that means the duty cycle has dropped to 0 (busy) more than 30% of the time in that interval, indicating that the system is quite busy and requires some attention or adjustment.
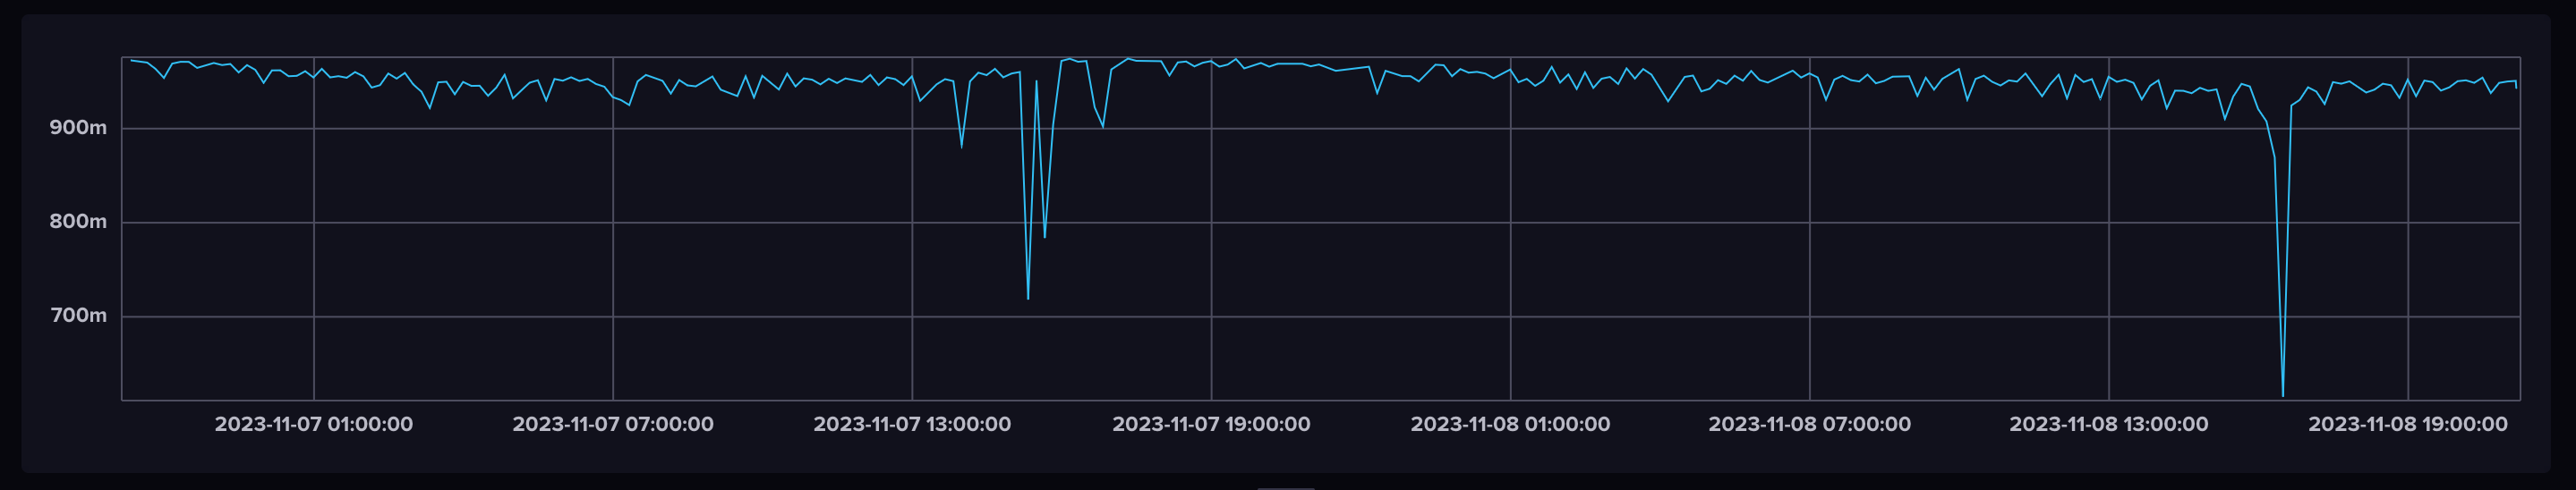 The above graph shows that the majority of the time, the duty cycle was ready more than 90% of the time over the course of these two days. However, there are two points at which it dropped near and below 70%.
timedrift
The timedrift metric serves as a way to understand how much the timing of events' origins (usually @timestamp) varies from what the system considers to be the "current" time. This can be helpful for identifying issues like delays or inaccuracies in a microservice.
Each value is calculated once per minute by default:
avg
Average. This calculates the average time difference between when an event actually happened and when your system recorded it. If this number is high, it may indicate a consistent delay.
median
Median. This tells you the middle value of all timedrifts for a set interval, offering a more "typical" view of your system's timing accuracy. The median is less sensitive to outliers than average, since it is a value and not a calculation.
stddev
Standard deviation. This gives you an idea of how much the timedrift varies. A high standard deviation might mean that your timing is inconsistent, which could be problematic.
min
Minimum. This shows the smallest timedrift in your set of data. It's useful for understanding the best-case scenario in your system's timing accuracy.
max
Maximum. This indicates the largest time difference. This helps you understand the worst-case scenario, which is crucial for identifying the upper bounds of potential issues.
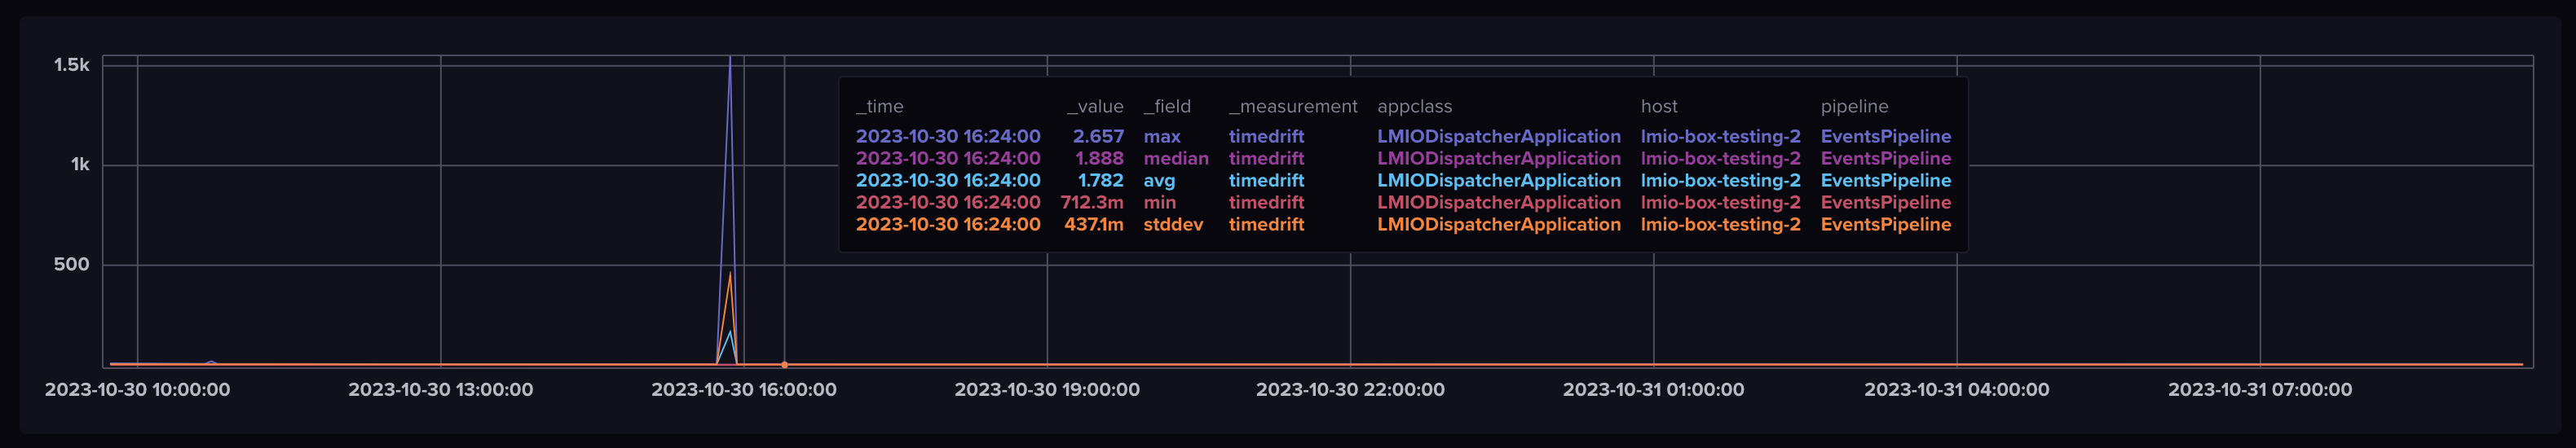 In this graph of time drift, you can see a spike in lag before the pipeline returns to normal.
commlink
The commlink is the communication link between LogMan.io Collector and LogMan.io Receiver. These metrics are specific to data sent from the Collector microservice to the Receiver microservice.
Tags: ActivityState, appclass (LogMan.io Receiver only), host, identity, tenant
- bytes.in: bytes that enter LogMan.io Receiver
- event.in: events that enter LogMan.io Receiver
logs
Count of logs that pass through microservices.
Tags: appclass, host, identity, instance_id, node_id, service_id, tenant
- critical: Count of critical logs
- errors: Count of error logs
- warnings: Count of warning logs