System monitoring
The following tools and techniques can help you understand how your TeskaLabs LogMan.io system is performing and investigate any issues that arise.
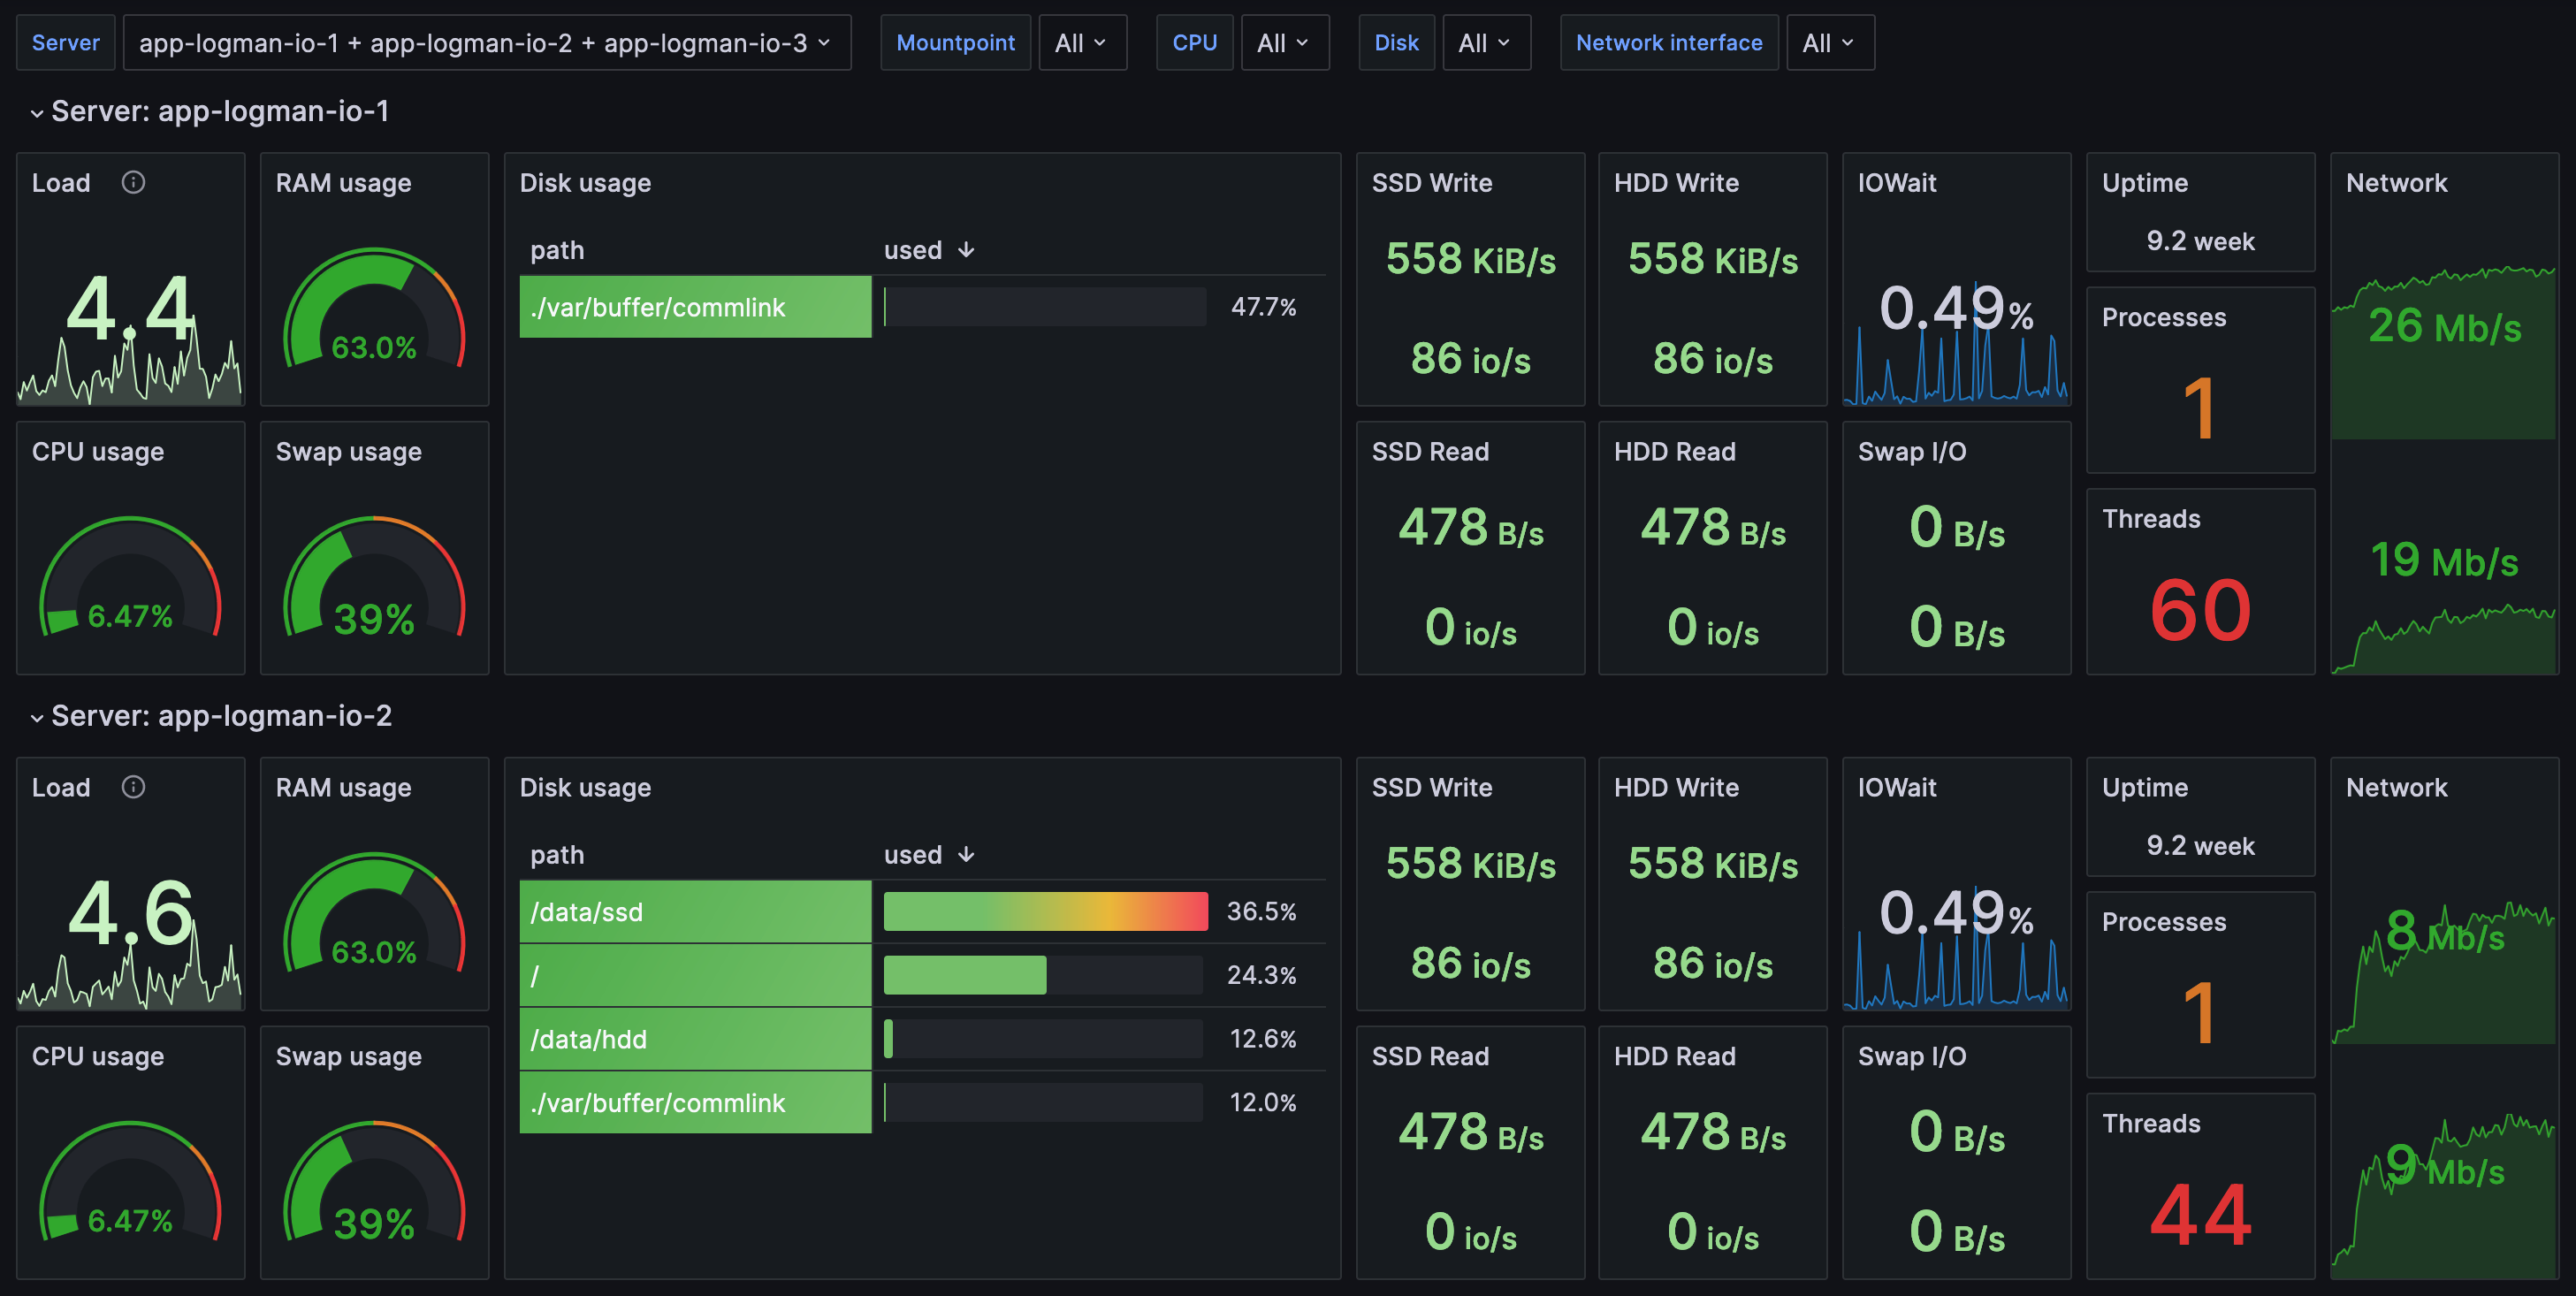
Preset dashboards
LogMan.io includes preset diagnostic dashboards that give you insight into your system performance. This is the best place to start monitoring.
Preset dashboard example
Prophylactic checks
Prophylacitic checks are preventative checkups on your LogMan.io app and system performance. Visit our prophylactic check manual to learn how to perform regular prophylactic checks.
Metrics
Metrics are measurements regarding system performance. Investigating metrics can be useful if you already know what area of your system you need insight into, which you can discover through analyzing your preset dashboards or performing a prophylactic check.