Grafana dashboards for system diagnostics
Through TeskaLabs LogMan.io, you can access dashboards in Grafana that monitor your data pipelines. Use these dashboards for diagnostic purposes.
The first few months of your deployment of TeskaLabs LogMan.io are a stabilization period, in which you might see extreme values produced by these metrics. These dashboards are especially useful during stabilization and can help with system optimization. Once your system is stable, extreme values, in general, indicate a problem.
To access the dashboards:
1. In LogMan.io, go to Tools.


2. Click on Grafana. You are now securely logged in to Grafana with your LogMan.io user credentials.
3. Click the menu button, and go to Dashboards.
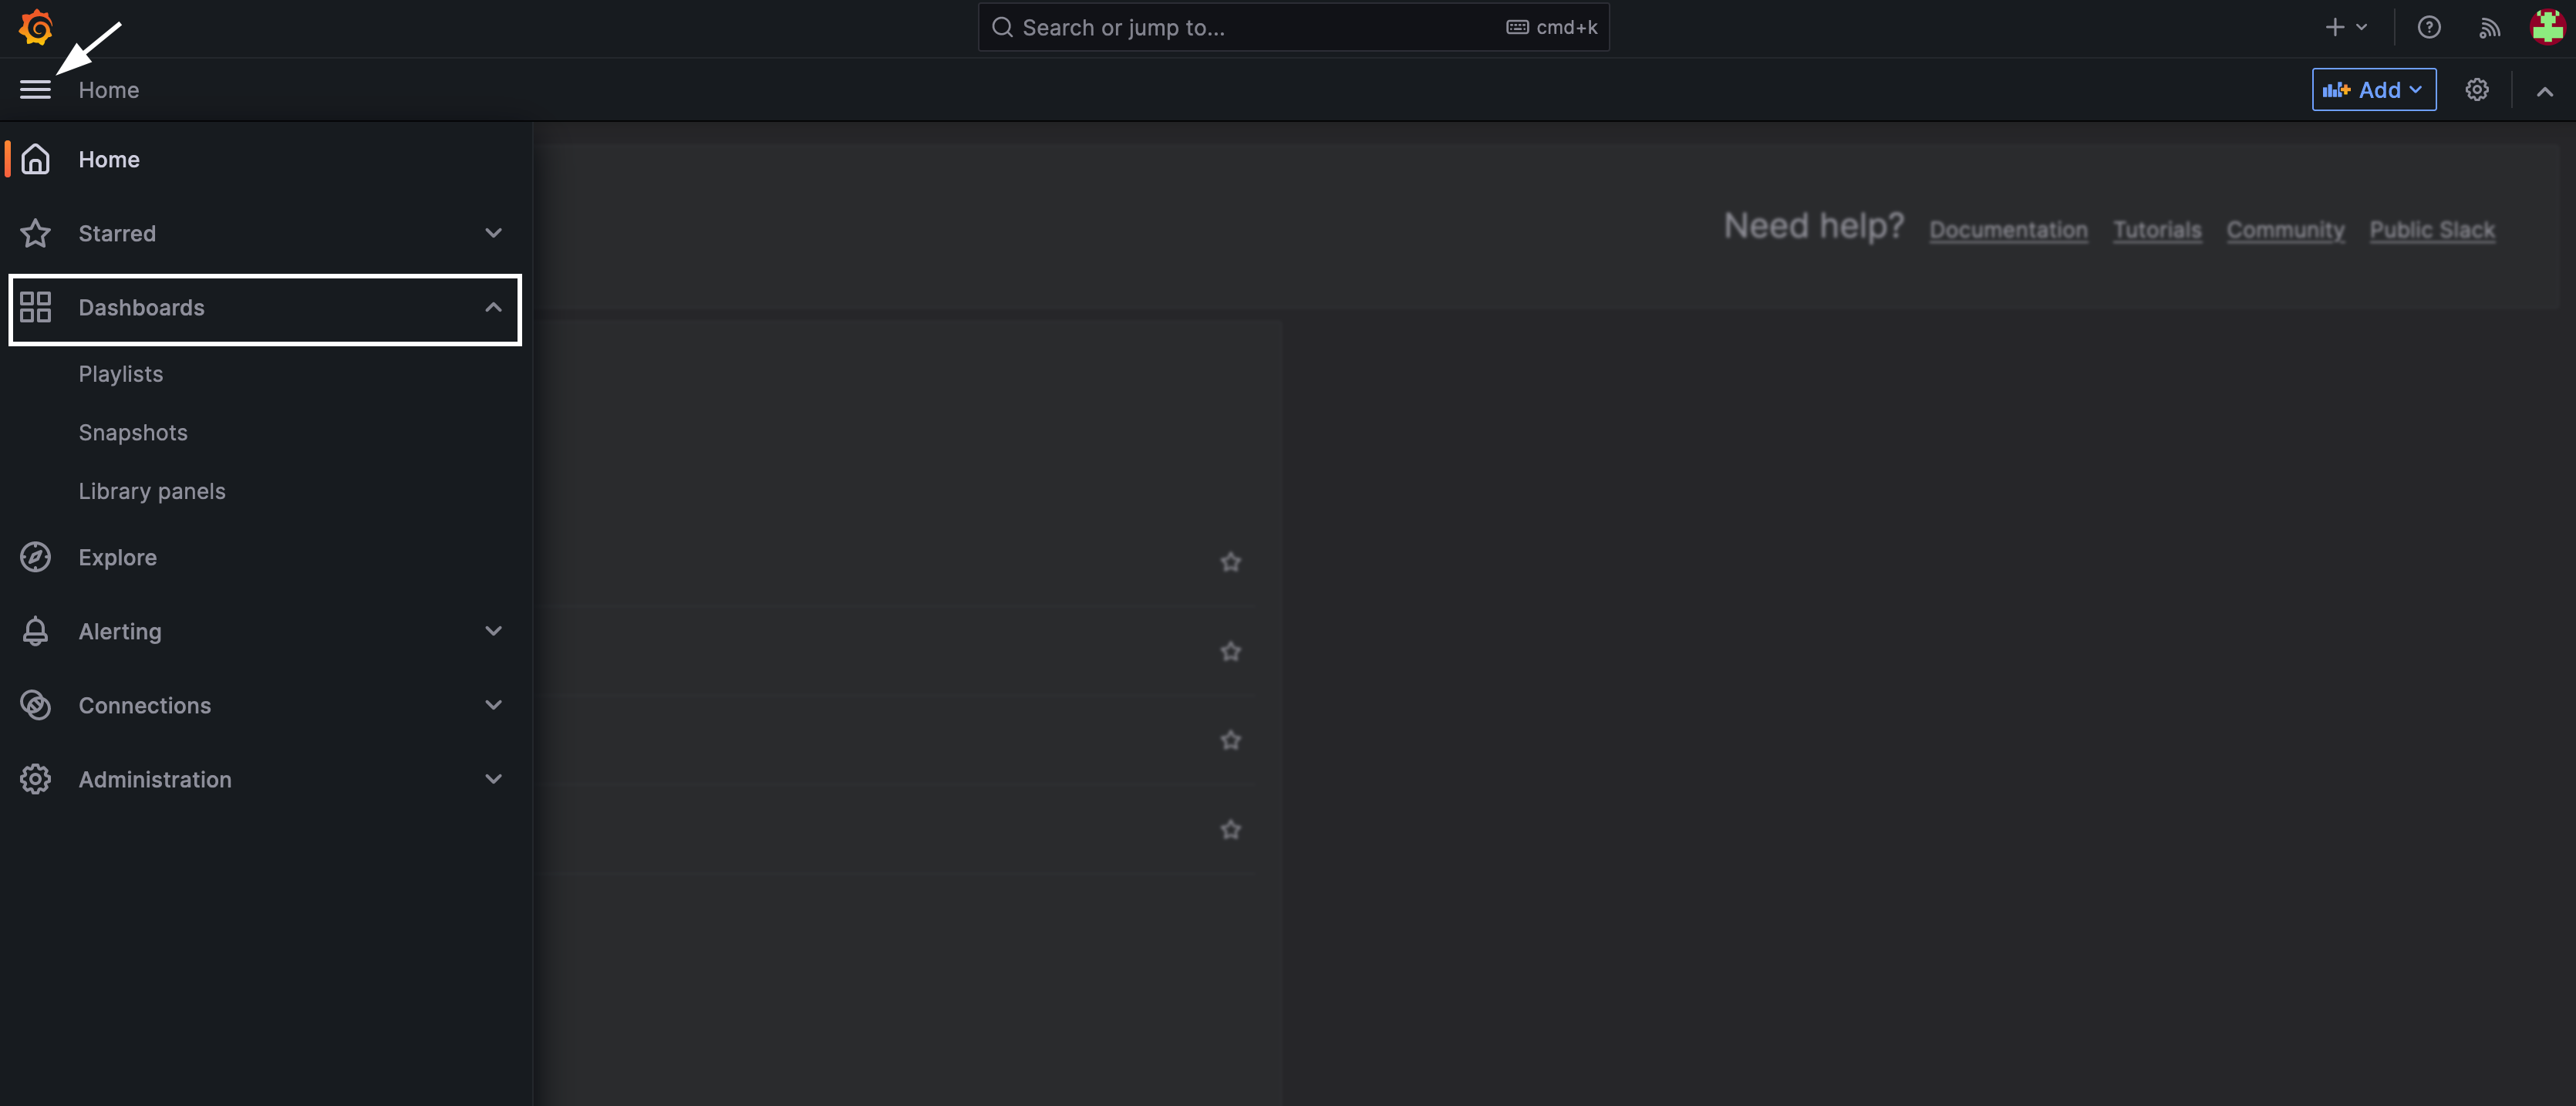
4. Select the dashboard you want to see.
Tips
- Hover over any graph to see details at specific time points.
- You can change the timeframe of any dashboard with the timeframe tools in the top right corner of the screen.
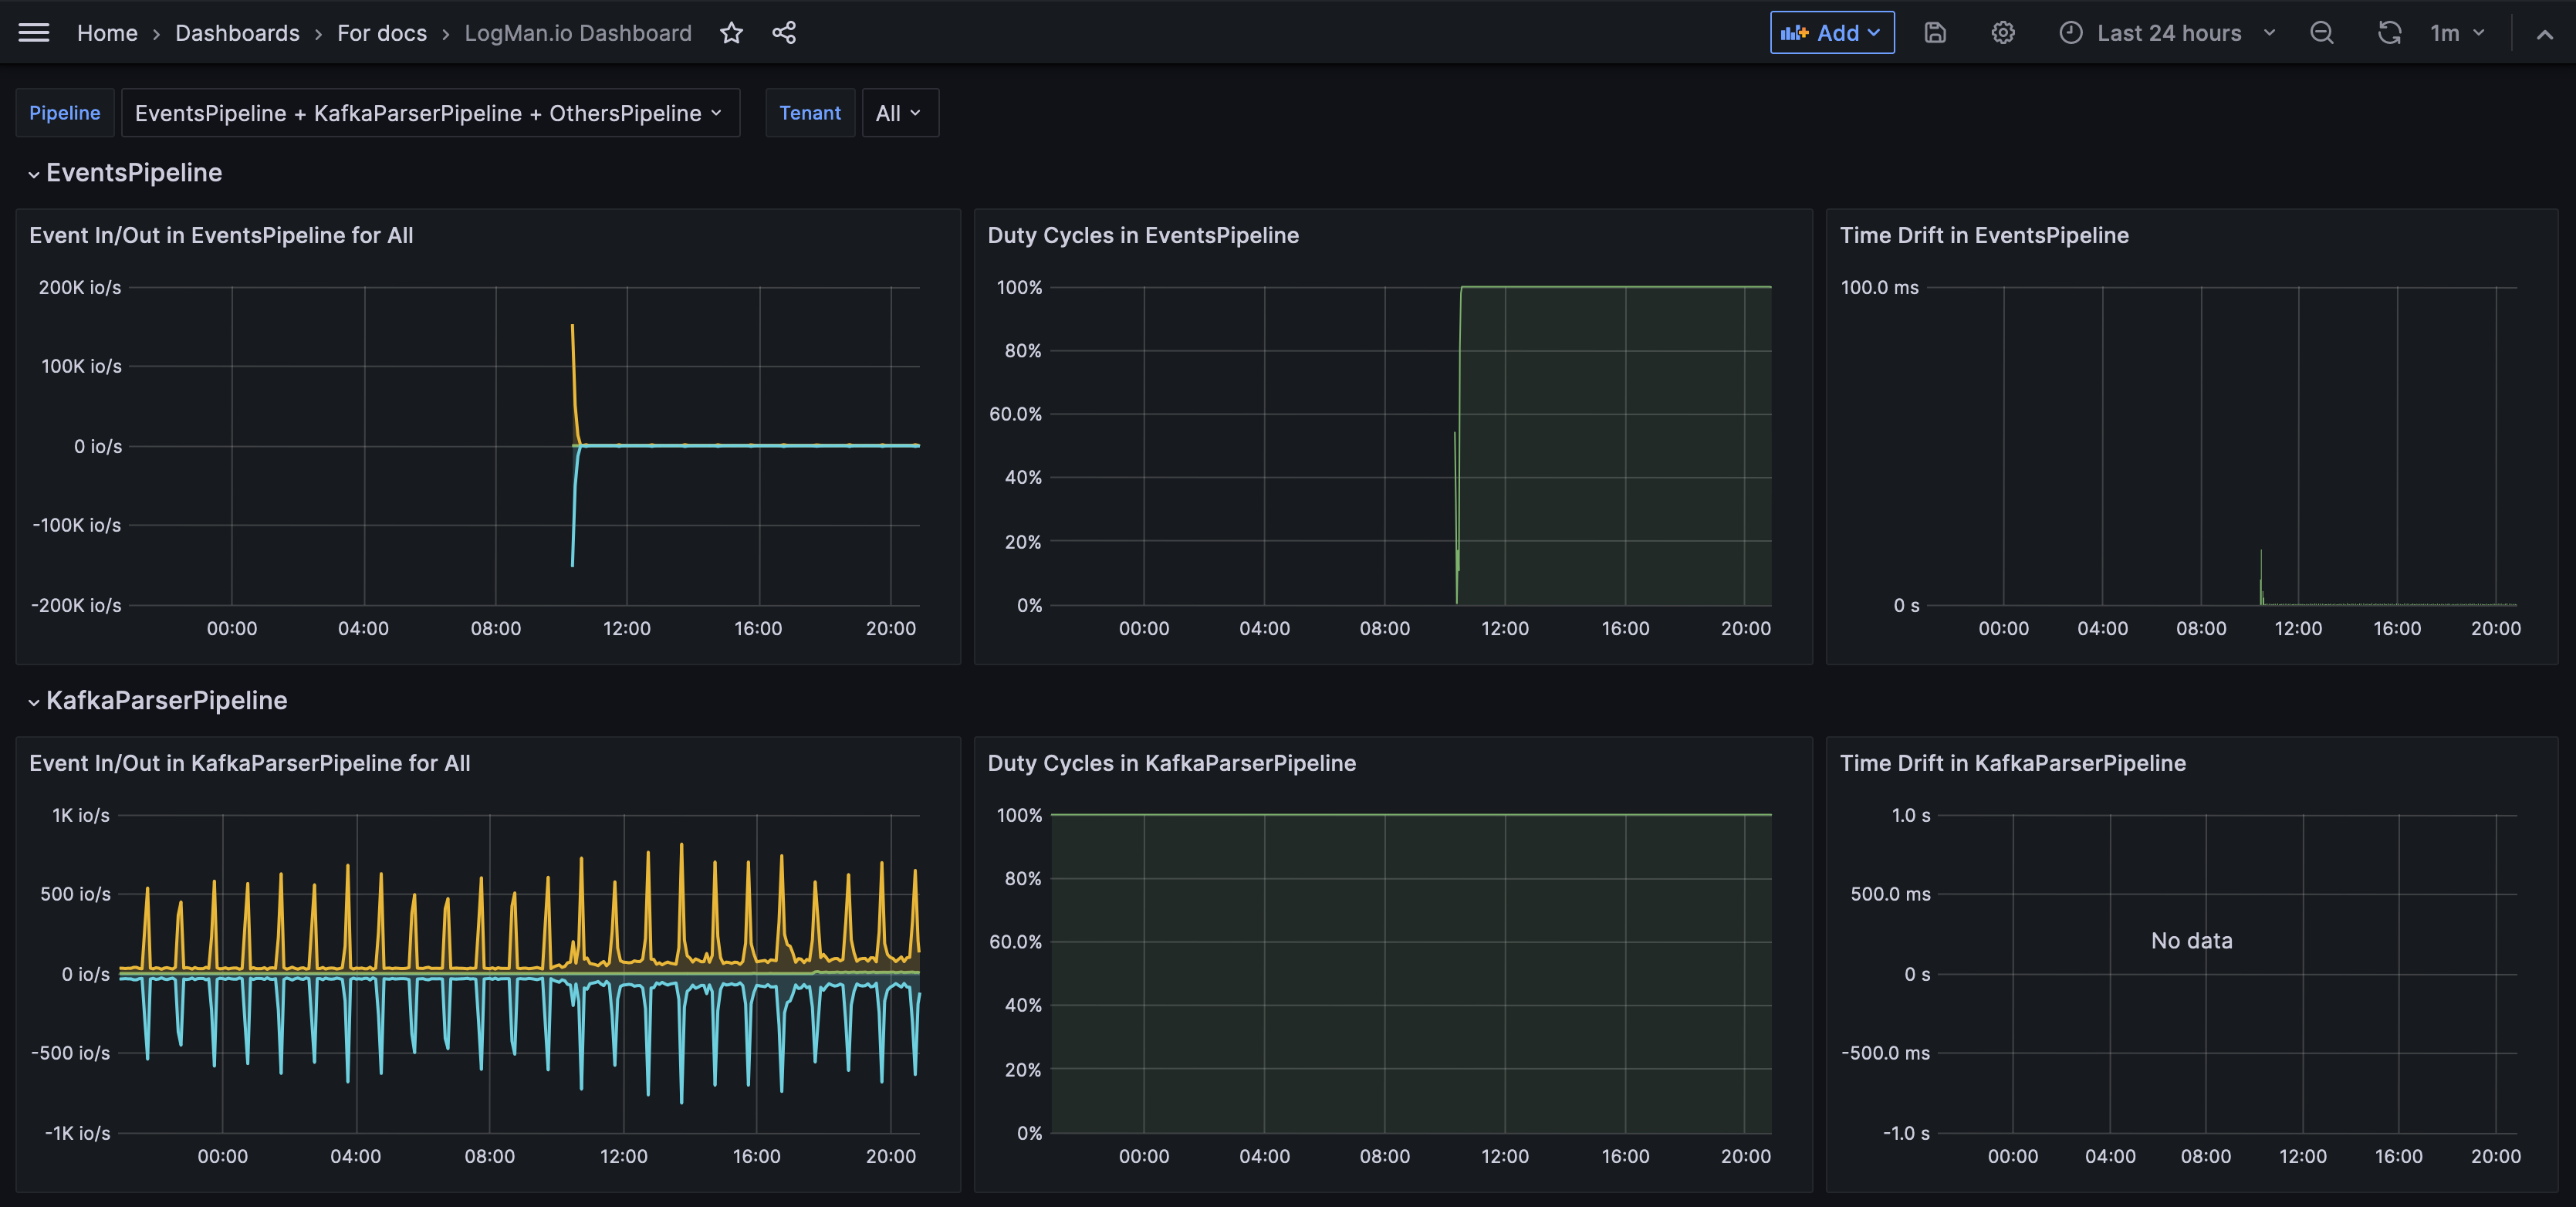
LogMan.io dashboard
The LogMan.io dashboard monitors all data pipelines in your installation of TeskaLabs LogMan.io. This dashboard can help you investigate if, for example, you're seeing fewer logs than expected in LogMan.io. See Pipeline metrics for deeper explanations.
Metrics included:
-
Event In/Out: The volume of events passing through each data pipeline measured in in/out operations per second (io/s). If the pipeline is running smoothly, the In and Out quantities are equal, and the Drop line is zero. This means that the same amount of events are entering and leaving the pipeline, and none are dropped. If you can see in the graph that the In quantity is greater than the Out quantity, and that the Drop line is greater than zero, then some events have been dropped, and there might be an issue.
-
Duty cycle: Displays the percentage of data being processed as compared to data waiting to be processed. If the pipeline is working as expected, the duty cycle is at 100%. If the duty cycle is lower than 100%, it means that somewhere in the pipeline, there is a delay or a throttle causing events to queue.
-
Time drift: Shows you the delay or lag in event processing, meaning how long after an event's arrival it is actually processed. A significant or increased delay impacts your cybersecurity because it inhibits your ability to respond to threats immediately. Time drift and duty cycle are related metrics. There is a greater time drift when the duty cycle is below 100%.
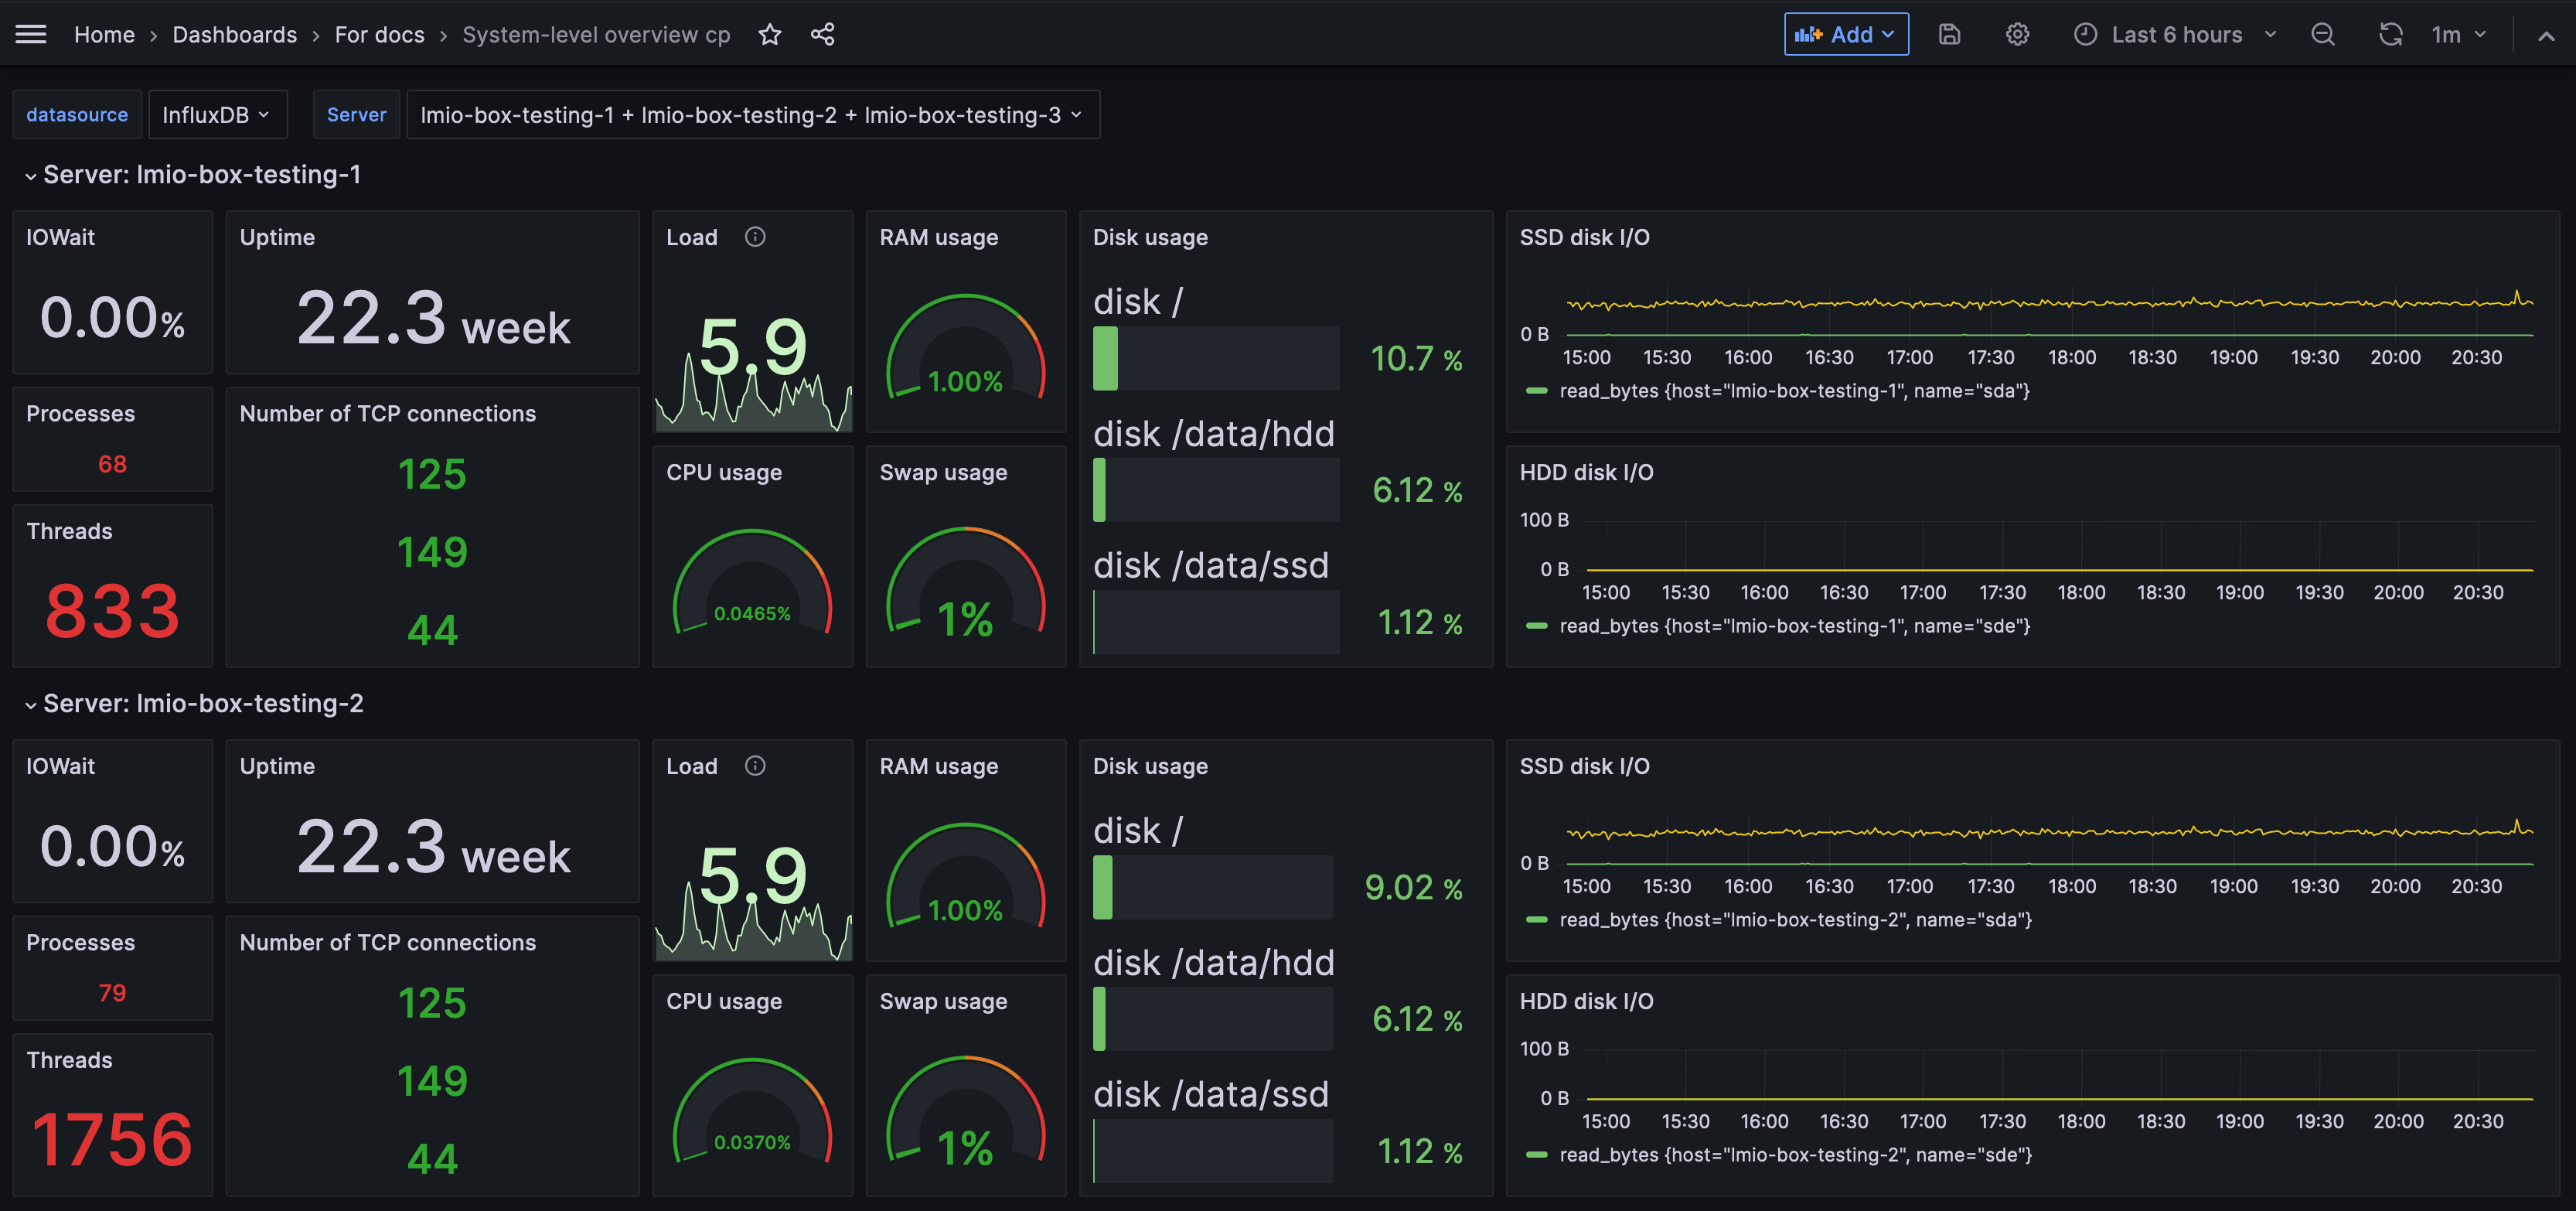
System-level overivew dashboard
The System-level overview dashboard monitors the servers involved in your TeskaLabs LogMan.io installation. Each node of the installation has its own section in the dashboard. When you encounter a problem in your system, this dashboard helps you perform an initial assessment on your server by showing you if the issue is related to input/output, CPU usage, network, or disk space or usage. However, for a more specific analysis, pursue exploring specific metrics in Grafana or InfluxDB.
Metrics included:
- IOWait: Percentage of time the CPU remains idle while waiting for disk I/O (input/output) requests. In other words, IOWait tells you how much processing time is being wasted waiting for data. A high IOWait, especially if it's around or exceeds 20% (depending on your system), signals that the disk read/write speed is becoming a system bottleneck. A rising IOWait indicates that the disk's performance is limiting the system's ability to receive and store more logs, impacting overall system throughput and efficiency.
- Uptime: The amount of a time the server has been running without since last being shut down or restarted.
- Load: Represents the average number of processes waiting in the queue for CPU time over the last 5 minutes. It's a direct indicator of how busy your system is. In systems with multiple CPU cores, this metric should be considered in relation to the total number of available cores. For instance, a load of 64 on a 64-core system might be acceptable, but above 100 indicates severe stress and unresponsiveness. The ideal load varies based on the specific configuration and use case but generally should not exceed 80% of the total number of CPU cores. Consistently high load values indicate that the system is struggling to process the incoming stream of logs efficiently.
- RAM usage: The percentage of the total memory currently being used by the system. Keeping RAM usage between 60-80% is generally optimal. Usage above 80% often leads to increased swap usage, which in turn can slow down the system and lead to instability. Monitoring RAM usage is crucial for ensuring that the system has enough memory to handle the workload efficiently without resorting to swap, which is significantly slower.
- CPU usage: An overview of the percentage of CPU capacity currently in use. It averages the utilization across all CPU cores, which means individual cores could be under or over-utilized. High CPU usage, particularly over 95%, suggests the system is facing CPU-bound challenges, where the CPU's processing capacity is the primary limitation. This dashboard metric helps differentiate between I/O-bound issues (where the bottleneck is data transfer) and CPU-bound issues. It's a critical tool for identifying processing bottlenecks, although it's important to interpret this metric alongside other system indicators for a more accurate diagnosis.
- Swap usage: How much of the swap space is being used. A swap partition is dedicated space on the disk used as a temporary substitute for RAM ("data overflow"). When RAM is full, the system temporarily stores data in swap space. High swap usage, above approximately 5-10%, indicates that the system is running low on memory, which can lead to degraded performance and instability. Persistent high swap usage is a sign that the system requires more RAM, as relying heavily on swap space can become a major performance bottleneck.
- Disk usage: Measures how much of the storage capacity is currently being used. In your log management system, it's crucial to keep disk usage below 90% and take action if it reaches 80%. Inadequate disk space is a common cause of system failures. Monitoring disk usage helps in proactive management of storage resources, ensuring that there is enough space for incoming data and system operations. Since most systems are configured to delete data after 18 months of storage, disk space usage can begin to stabilize after the system has been running for 18 months. Read more about the data lifecycle.
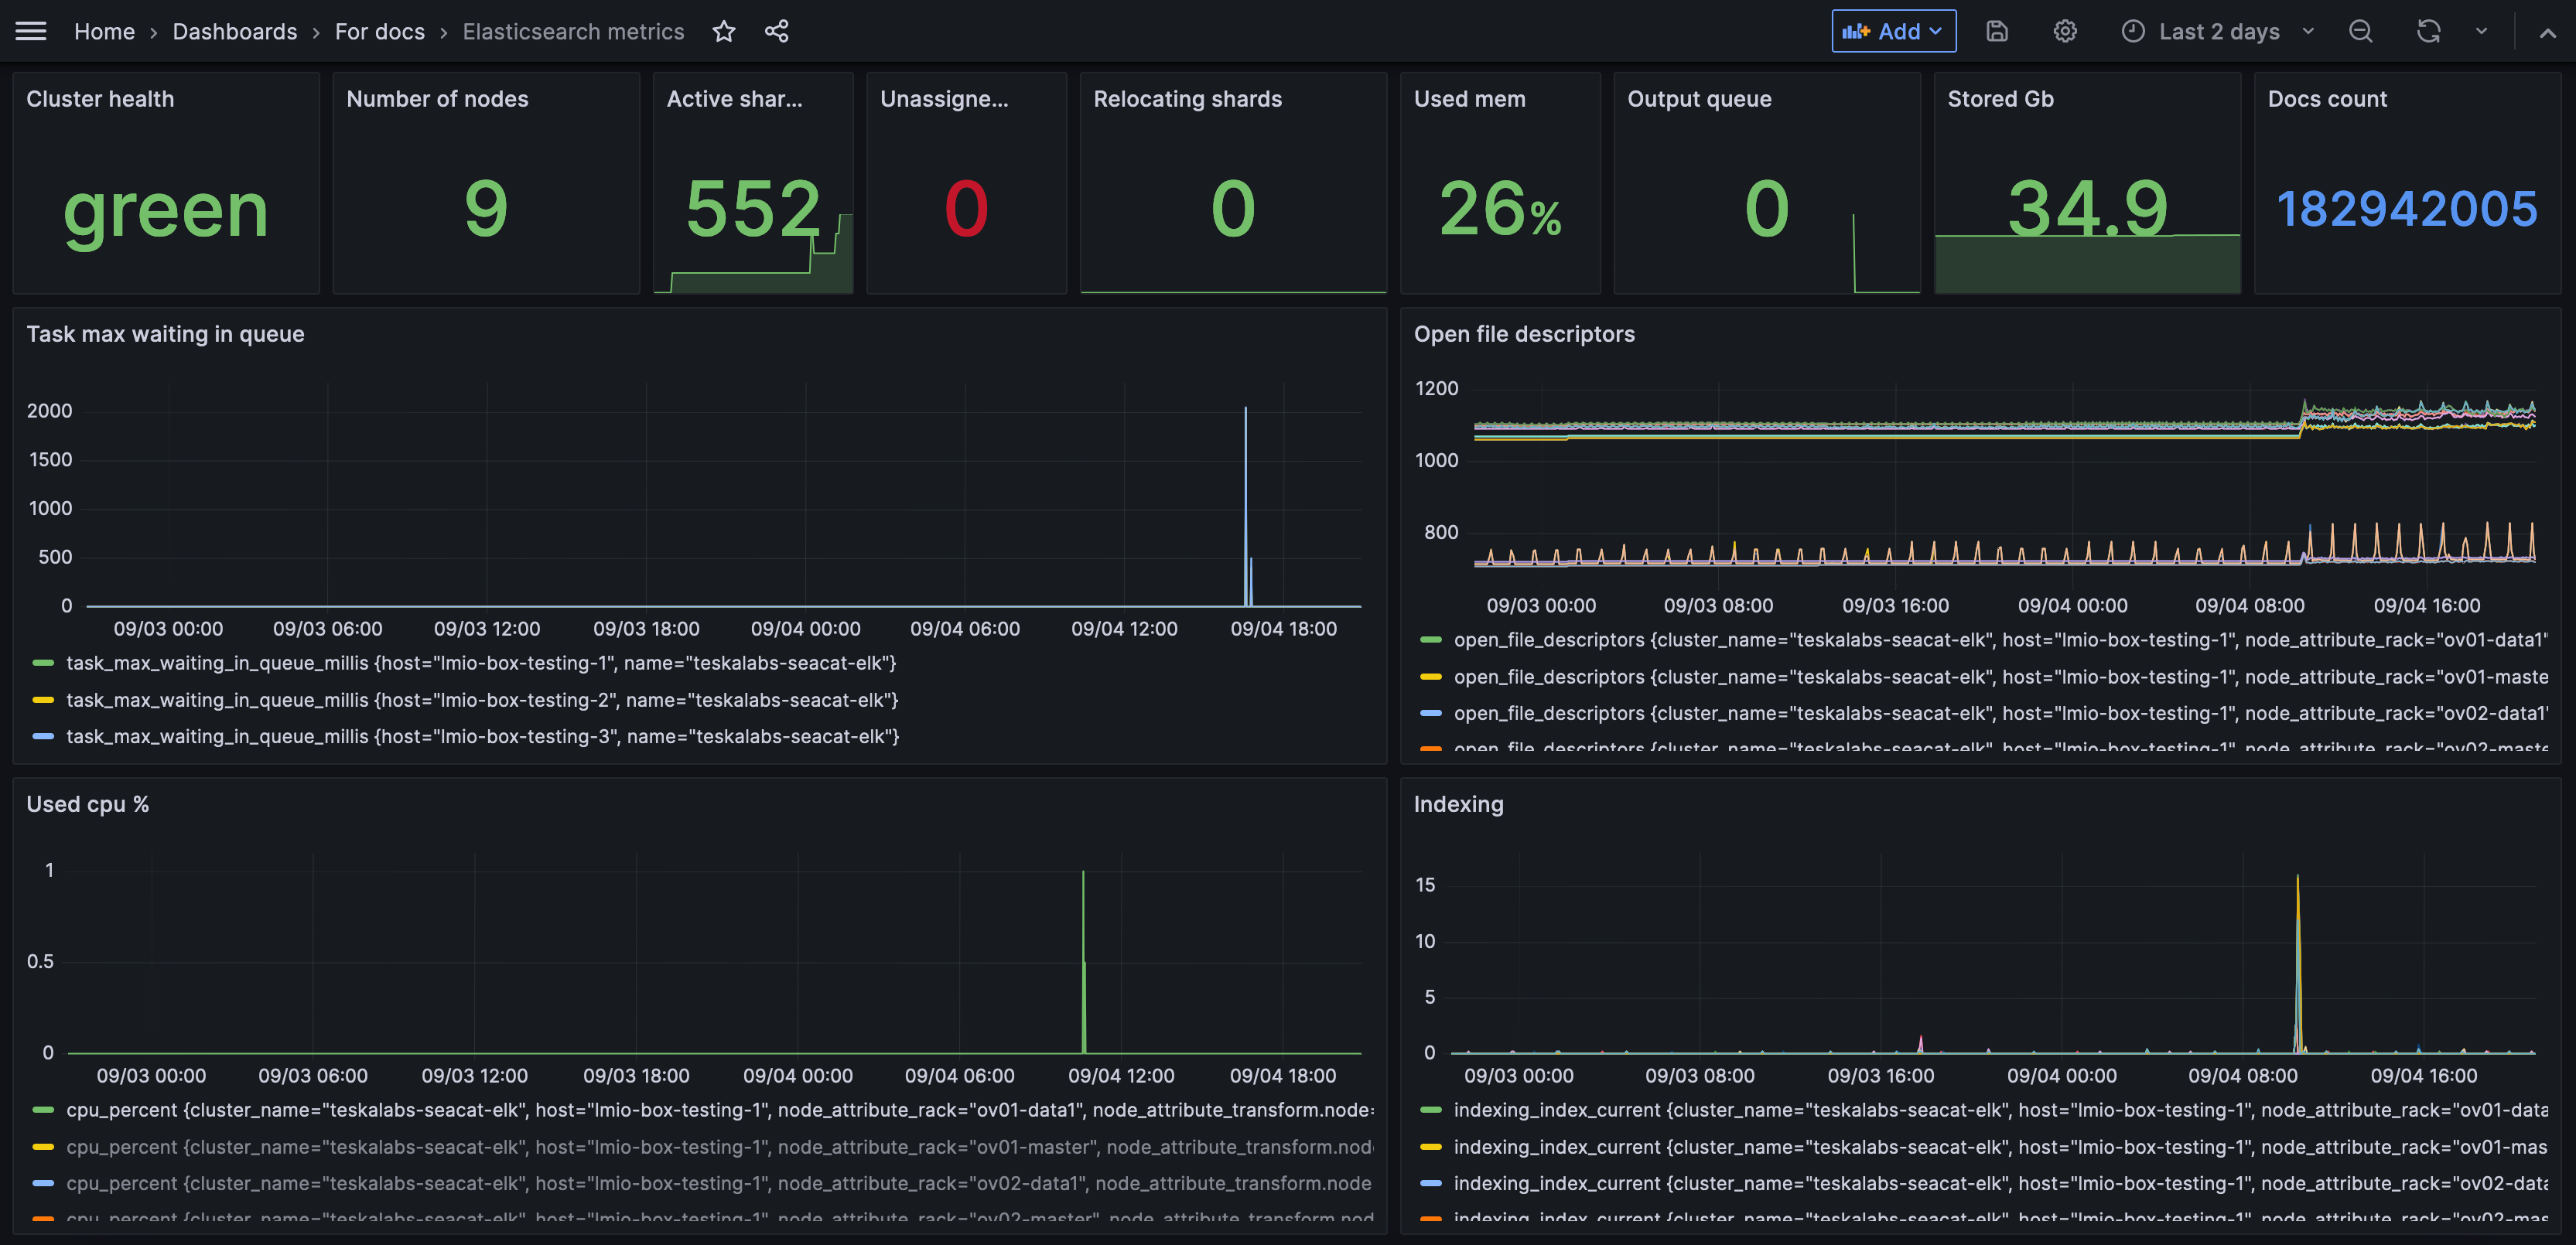
Elasticsearch metrics dashboard
The Elasticsearch metrics dashboard monitors the health of the Elastic pipeline. (Most TeskaLabs LogMan.io users use the Elasticsearch database to store log data.)
Metrics included:
- Cluster health: Green is good; yellow and red indicate a problem.
- Number of nodes: A node is a single instance of Elasticsearch. The number of nodes is how many nodes are part of your LogMan.io Elasticsearch cluster.
- Shards
- Active shards: Number of total shards active. A shard is the unit at which Elasticsearch distributes data around a cluster.
- Unassigned shards: Number of shards that are not available. They might be in a node which is turned off.
- Relocating shards: Number of shards that are in the process of being moved to a different node. (You might want to turn off a node for maintenance, but you still want all of your data to be available, so you can move a shard to a different node. This metrics tells you if any shards are actively in this process and therefore can't provide data yet.)
- Used mem: Memory used. Used memory at 100% would mean that Elasticsearch is overloaded and requires investigation.
- Output queue: The number of tasks waiting to be processed in the output queue. A high number could indicate a significant backlog or bottleneck.
- Stored GB: The amount of disk space being used for storing data in the Elasticsearch cluster. Monitoring disk usage is helps to ensure that there's sufficient space available and to plan for capacity scaling as necessary.
- Docs count: The total number of documents stored within the Elasticsearch indices. Monitoring the document count can provide insights into data growth and index management requirements
- Task max waiting in queue: The maximum time a task has waited in a queue to be processed. It’s useful for identifying delays in task processing which could impact system performance and throughput.
- Open file descriptors: File descriptors are handles that allow the system to manage and access files and network connections. Monitoring the number of open file descriptors is important to ensure that system resources are being managed effectively and to prevent potential file handle leaks which could lead to system instability
- Used cpu %: The percentage of CPU resources currently being used by Elasticsearch. Monitoring CPU usage helps you understand the system's performance and identify potential CPU bottlenecks.
- Indexing: The rate at which new documents are being indexed into Elasticsearch. A higher rate means your system can index more information more efficiently.
- Inserts: The number of new documents being added to the Elasticsearch indices. This line follows a regular pattern if you have a consistent number of inputs. If the line spikes or dips irregularly, there could be an issue in your data pipeline keeping events from reaching Elasticsearch.
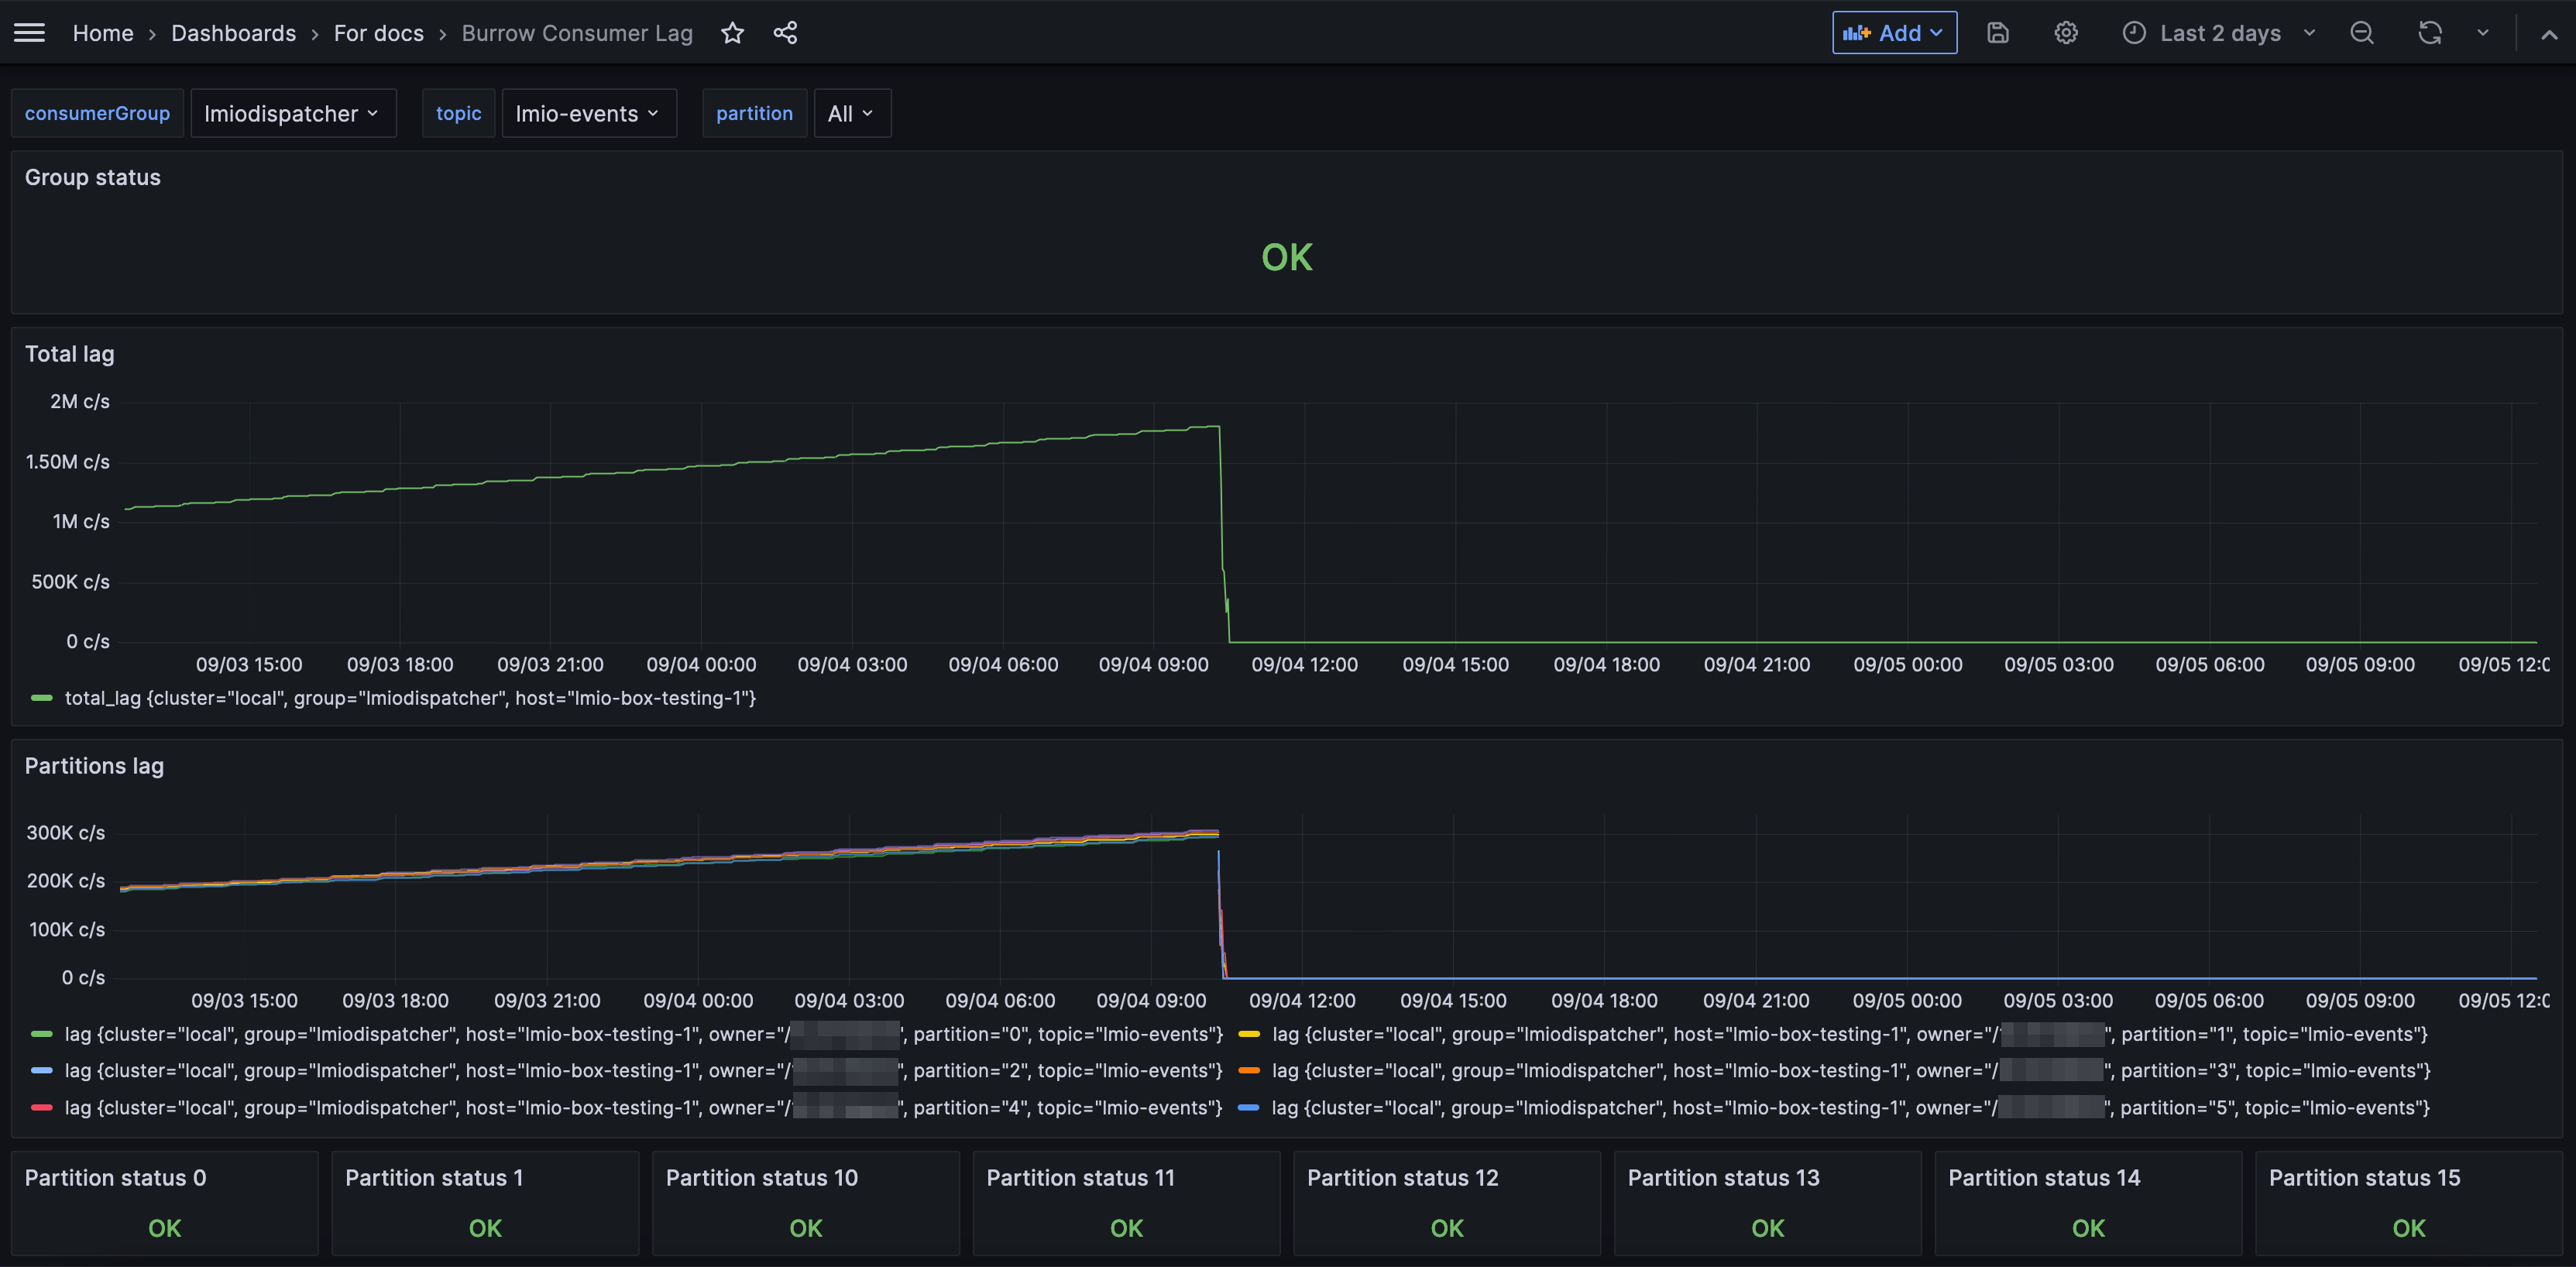
Burrow consumer lag dashboard
The Burrow dashboard monitors the consumers and partitions of Apache Kafka. Learn more about Burrow here.
Apache Kafka terms:
- Consumers: Consumers read data. They subscribe to one or more topics and read the data in the order in which it was produced.
- Consumer groups: Consumers are typically organized into consumer groups. Each consumer within a group reads from exclusive partitions of the topics they subscribe to, ensuring that each record is processed only once by the group, even if multiple consumers are reading.
- Partitions: Topics are split into partitions. This allows the data to be distributed across the cluster, allowing for concurrent read and write operations.
Metrics included:
- Group status: The overall health status of the consumer group. A status of OK means that the group is functioning normally, while a warning or error could indicate issues like connectivity problems, failed consumers, or misconfigurations.
- Total lag: In this case, lag can be thought of as a queue of tasks waiting to be processed by a microservice. The total lag metric represents the count of messages that have been produced to the topic but not yet consumed by a specific consumer or consumer group. If the lag is 0, everything is dispatched properly, and there is no queue. Because Apache Kafka tends to group data into batches, some amount of lag is often normal. However, an increasing lag, or a lag above approximately 300,000 (this number is dependent on your system capacity, configuration, and sensitivity) is cause for investigation.
- Partitions lag: The lag for individual partitions within a topic. Being able to see partitions' lags separated tells you if some partitions have a larger queue, or higher delay, than others, which might indicate uneven data distribution or other partition-specific issues.
- Partition status: The status of individual partitions. An OK status indicates the partition is operating normally. Warnings or errors can signify problems like a stalled consumer, which is not reading from the partition. This metric helps identify specific partition-level issues that might not be apparent when looking at the overall group status.