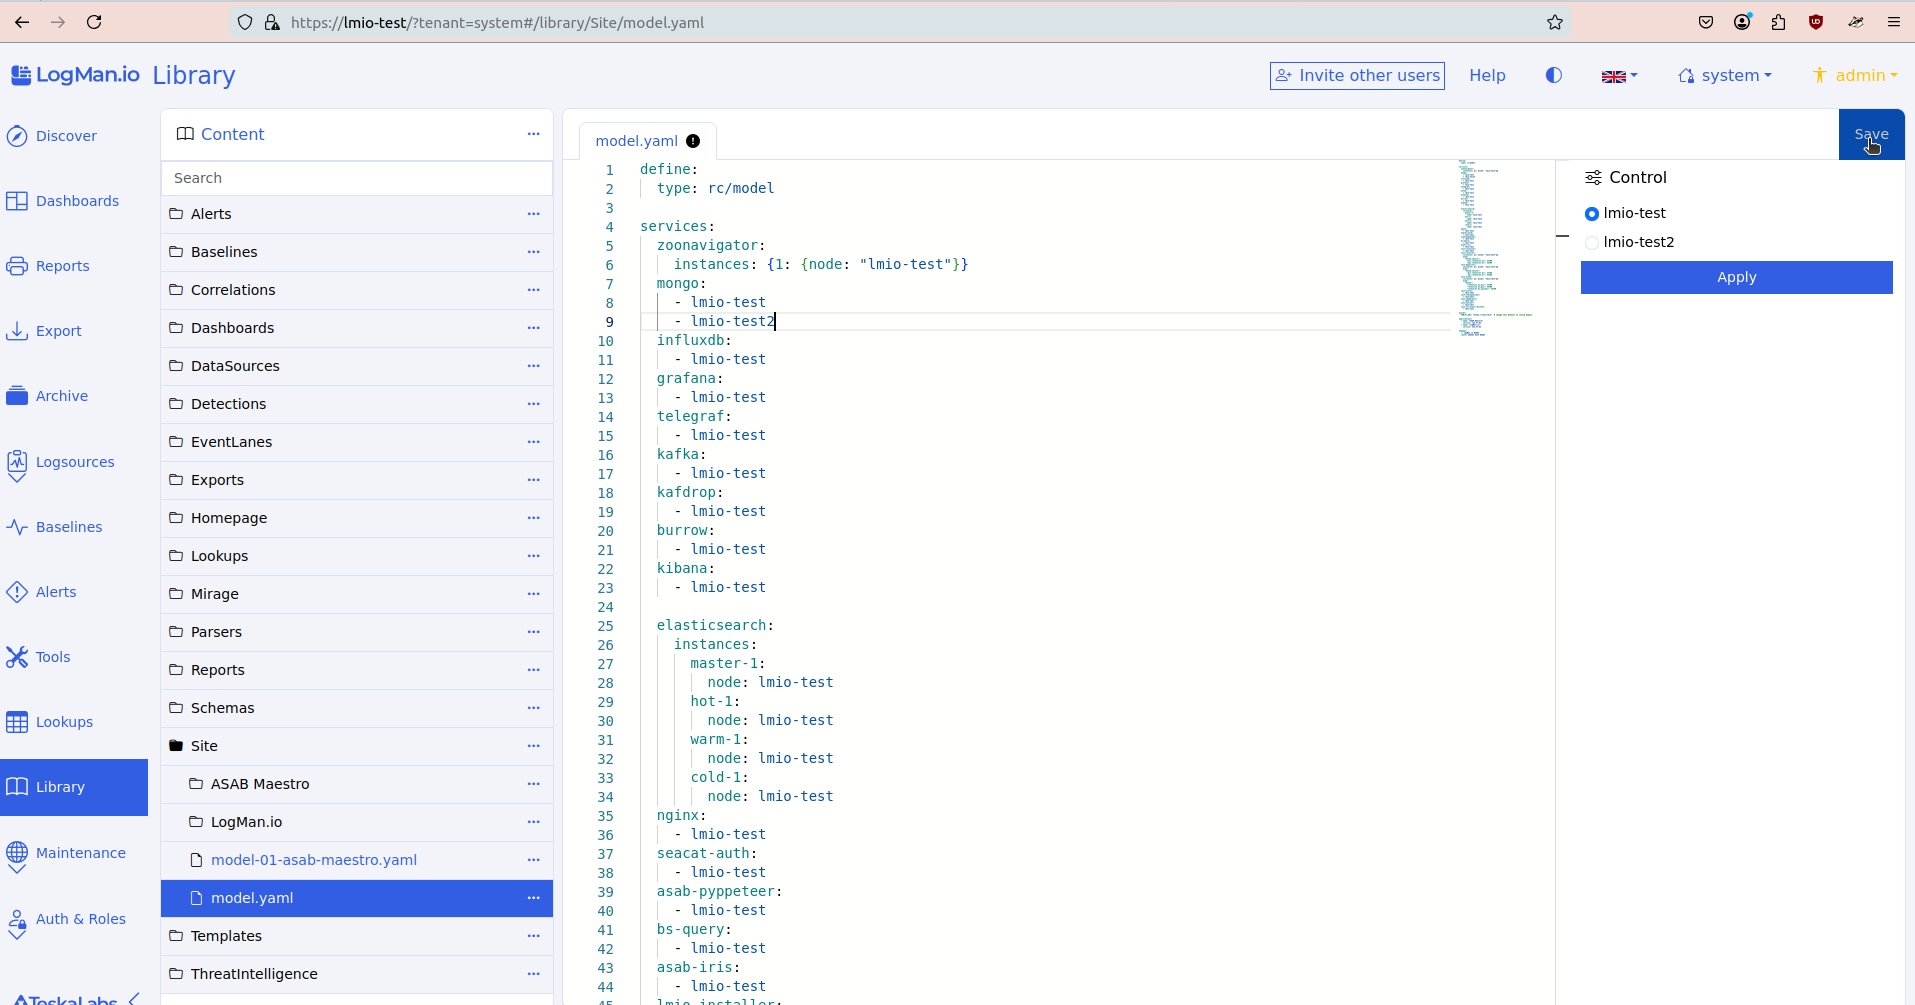
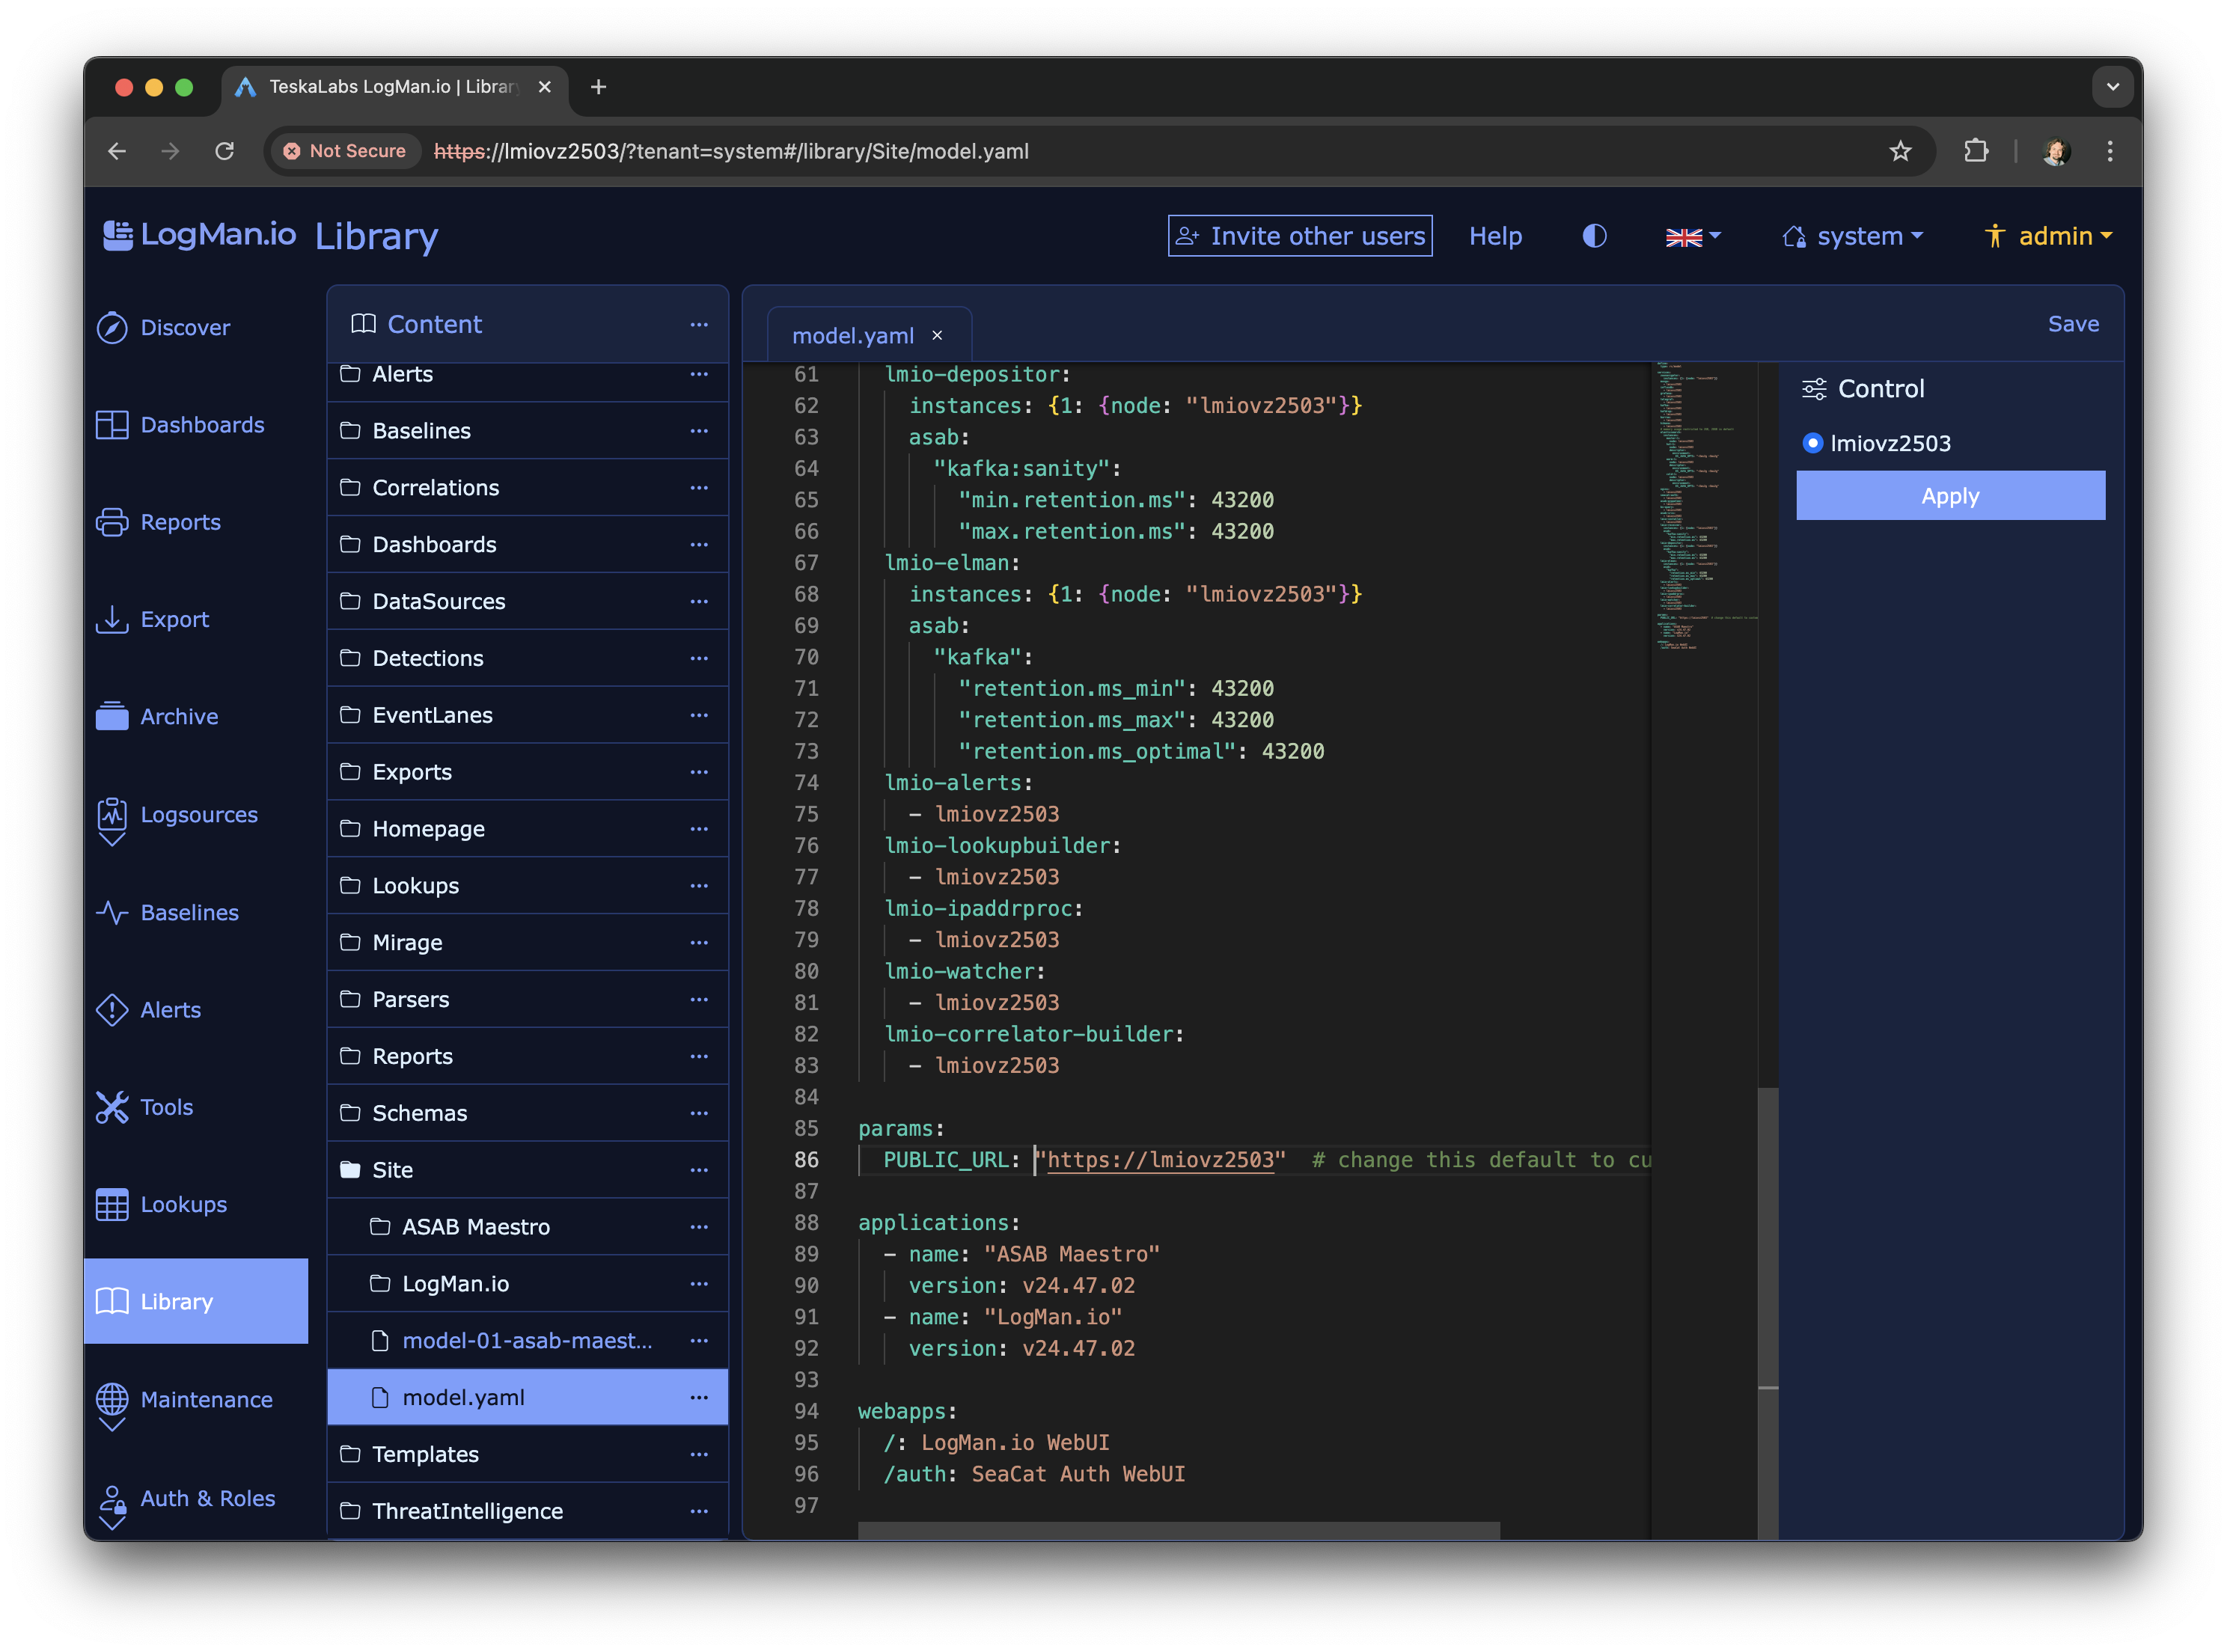
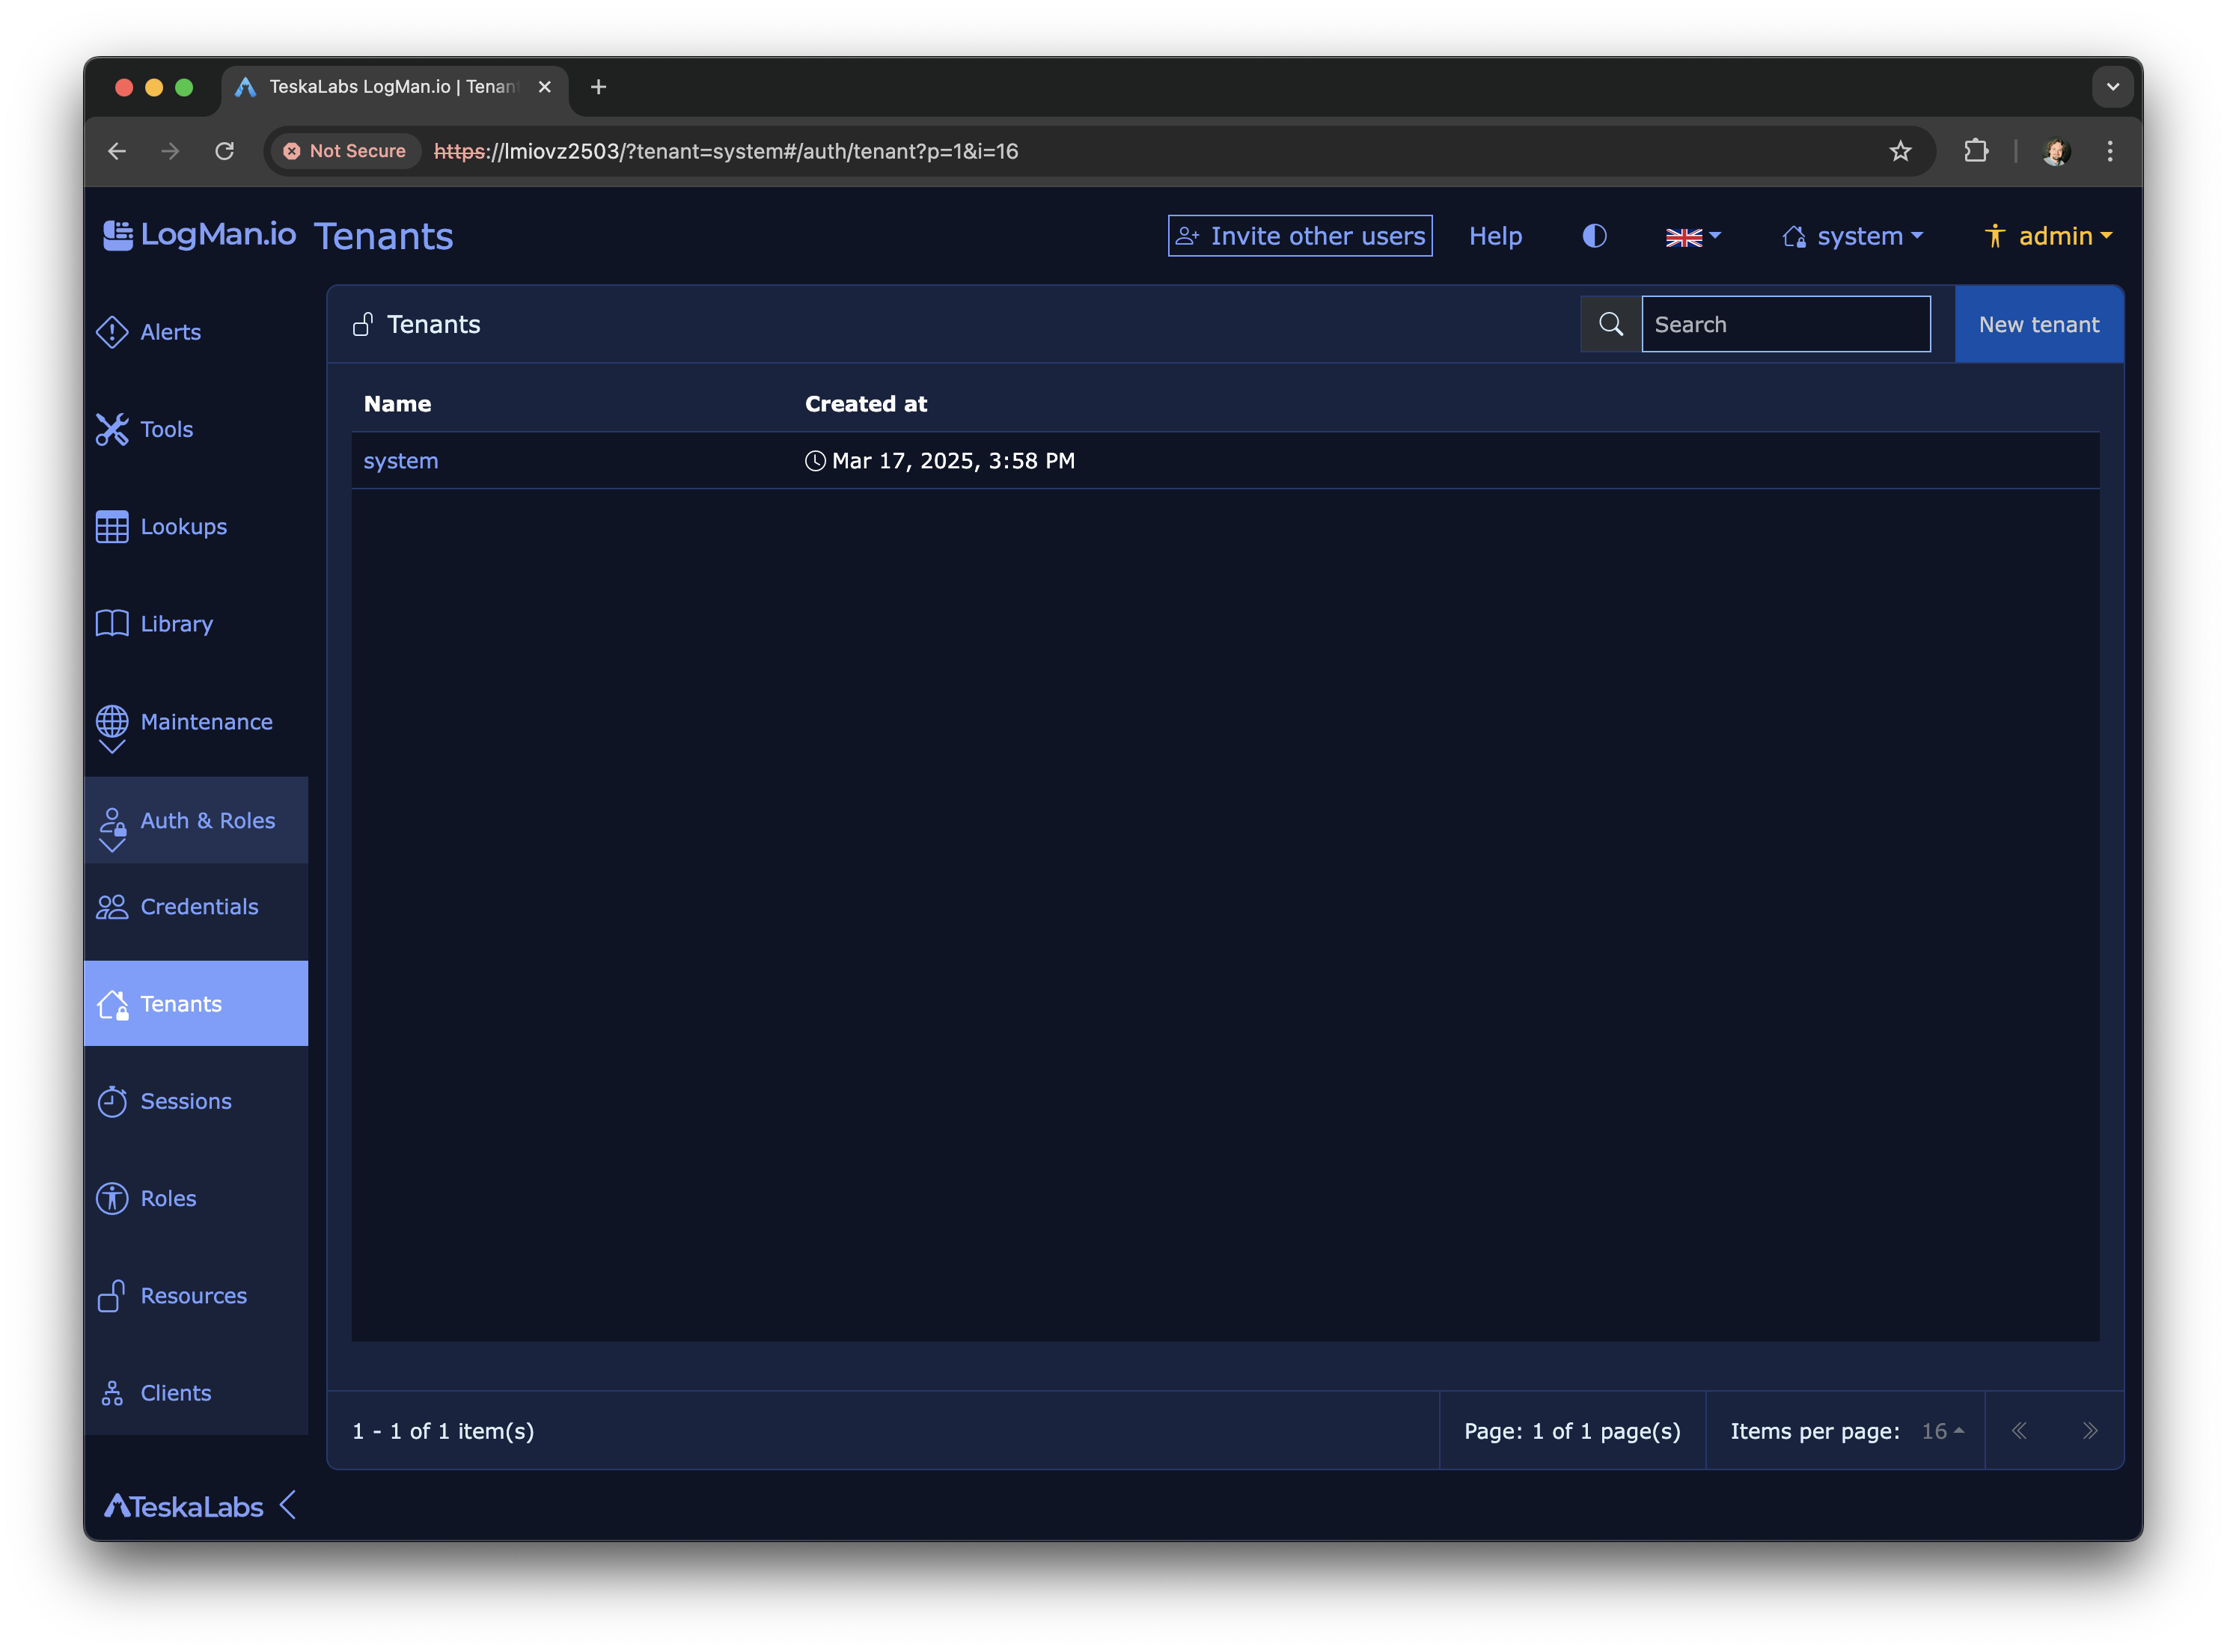
Table of Contents
Introduction
TeskaLabs LogMan.io documentation
Welcome to TeskaLabs LogMan.io documentation.
TeskaLabs LogMan.io
TeskaLabs LogMan.io™️ is a cybersecurity software product for log collection, log aggregation, log storage and retention, real-time log analysis and prompt incident response for an IT infrastructure, collectively known as log management.
TeskaLabs LogMan.io consists of a central infrastructure and log collectors, that resides on monitored systems such as servers or network appliances. Log collectors collect various logs (operation system, applications, databases) and system metrics such as CPU usage, memory usage, disk space etc. Collected events are sent in real-time to central infrastructure for consolidation, orchestration and storage. Thanks to its real-time nature, LogMan.io provides alerts for anomalous situation in perspective of system operation (e.g. is disk space running low), availability (e.g. is the application running?), business (e.g. is number of transaction below normal?) or security (e.g. any unusual access to servers?).
TeskaLabs SIEM
TeskaLabs SIEM is a real-time Security Information and Event Managemet tool. TeskaLabs SIEM provides real-time analysis and correlations of security events and alerts processed by a TeskaLabs LogMan.io. We designed TeskaLabs SIEM to enhance cyber security posture and compliance with regulatory.
More components
TeskaLabs SIEM and TeskaLabs LogMan.io are standalone products. Thanks to its modular architecture, these products also include other TeskaLabs technologies:
- TeskaLabs SeaCat Auth for authentification, authorization including user roles and fine-grained access control.
- TeskaLabs SP-Lang is an expression language used on many places in the product.
Made with ❤️ by TeskaLabs
TeskaLabs LogMan.io™️ is a product of TeskaLabs.
Features
TeskaLabs LogMan.io is a real-time SIEM with log management.
- Multitenancy: a single instance of TeskaLabs LogMan.io can serve multiple tenants (customers, departments).
- Multiuser: TeskaLabs LogMan.io can be used by unlimmited number of users simultanously.
Technologies
Cryptography
- Transport layer: TLS 1.2, TLS 1.3 and better
- Symmetric cryptography: AES-128, AES-256, AES-512
- Asymmetric cryptography: RSA, ECC
- Hash methods: SHA-256, SHA-384, SHA-512
- MAC functions: HMAC
- HSM: PKCS#11 interface
Note
TeskaLabs LogMan.io uses only strong cryptography, it means that we use only these ciphers, hashes and other algorithms that are recongized as secure by cryptographic comunity and by organizations such as ENISA or NIST.
Supported Log Sources
TeskaLabs LogMan.io supports a variety of different technologies, which we have listed below.
Formats
- Syslog RFC 5424 (IEFT)
- Syslog RFC 3164 (BSD)
- Syslog RFC 3195 (BEEP profile)
- Syslog RFC 6587 (Frames over TCP)
- Reliable Event Logging Protocol (REPL), including SSL
- Windows Event Log
- SNMP
- ArcSight CEF
- LEEF
- JSON
- XML
- YAML
- Avro
- Custom/raw log format
And many more.
Info
Syslog protocols can be transported over TCP, UDP and TLS/SSL.
Vendors and Products
Cisco
- Cisco Firepower Threat Defense (FTD)
- Cisco Adaptive Security Appliance (ASA)
- Cisco Identity Services Engine (ISE)
- Cisco Meraki (MX, MS, MR devices)
- Cisco Catalyst Switches
- Cisco IOS
- Cisco WLC
- Cisco ACS
- Cisco SMB
- Cisco UCS
- Cisco IronPort
- Cisco Nexus
- Cisco Routers
- Cisco VPN
- Cisco Umbrella
Palo Alto Networks
- Palo Alto Next-Generation Firewalls
- Palo Alto Panorama (Centralized Management)
- Palo Alto Traps (Endpoint Protection)
Fortinet
- FortiGate (Next-Generation Firewalls)
- FortiSwitch (Switches)
- FortiAnalyzer (Log Analytics)
- FortiMail (Email Security)
- FortiWeb (Web Application Firewall)
- FortiADC
- FortiDDos
- FortiSandbox
Juniper Networks
- Juniper SRX Series (Firewalls)
- Juniper MX Series (Routers)
- Juniper EX Series (Switches)
Check Point Software Technologies
- Check Point Security Gateways
- Check Point SandBlast (Threat Prevention)
- Check Point CloudGuard (Cloud Security)
Microsoft
- Microsoft Windows (Operating System)
- Microsoft Azure (Cloud Platform)
- Microsoft SQL Server (Database)
- Microsoft IIS (Web Server)
- Microsoft Office 365
- Microsoft Exchange
- Microsoft Sharepoint
Linux
- Ubuntu (Distribution)
- CentOS (Distribution)
- Debian (Distribution)
- Red Hat Enterprise Linux (Distribution)
- IPTables
- nftables
- Bash
- Cron
- Kernel (dmesg)
Oracle
- Oracle Database
- Oracle WebLogic Server (Application Server)
- Oracle Cloud
Amazon Web Services (AWS)
- Amazon EC2 (Virtual Servers)
- Amazon RDS (Database Service)
- AWS Lambda (Serverless Computing)
- Amazon S3 (Storage Service)
VMware
- VMware ESXi (Hypervisor)
- VMware vCenter Server (Management Platform)
F5 Networks
- F5 BIG-IP (Application Delivery Controllers)
- F5 Advanced Web Application Firewall (WAF)
Barracuda Networks
- Barracuda CloudGen Firewall
- Barracuda Web Application Firewall
- Barracuda Email Security Gateway
Sophos
- Sophos XG Firewall
- Sophos UTM (Unified Threat Management)
- Sophos Intercept X (Endpoint Protection)
Aruba Networks (HPE)
- Aruba Switches
- Aruba Wireless Access Points
- Aruba ClearPass (Network Access Control)
- Aruba Mobility Controller
HPE
- iLO
- IMC
- HPE StoreOnce
- HPE Primera Storage
- HPE 3PAR StoreServ
Trend Micro
- Trend Micro Deep Security
- Trend Micro Deep Discovery
- Trend Micro TippingPoint (Intrusion Prevention System)
- Trend Micro Endpoint Protection Manager
- Trend Micro Apex One
Fidelis
- Fidelis Elevate
Zscaler
- Zscaler Internet Access (Secure Web Gateway)
- Zscaler Private Access (Remote Access)
Akamai
- Akamai (Content Delivery Network and Security)
- Akamai Kona Site Defender (Web Application Firewall)
- Akamai Web Application Protector
Imperva
- Imperva Web Application Firewall (WAF)
- Imperva Database Security (Database Monitoring)
SonicWall
- SonicWall Next-Generation Firewalls
- SonicWall Email Security
- SonicWall Secure Mobile Access
WatchGuard Technologies
- WatchGuard Firebox (Firewalls)
- WatchGuard XTM (Unified Threat Management)
- WatchGuard Dimension (Network Security Visibility)
Apple
- macOS (Operating System)
Apache
- Apache Cassandra (Database)
- Apache HTTP Server
- Apache Kafka
- Apache Tomcat
- Apache Zookeeper
NGINX
- NGINX (Web Server and Reverse Proxy Server)
Docker
- Docker (Container Platform)
Kubernetes
- Kubernetes (Container Orchestration)
Atlassian
- Jira (Issue and Project Tracking)
- Confluence (Collaboration Software)
- Bitbucket (Code Collaboration and Version Control)
Cloudflare
- Cloudflare (Content Delivery Network and Security)
SAP
- SAP HANA (Database)
Balabit
- syslog-ng
Open-source
- PostgreSQL (Database)
- MySQL (Database)
- OpenSSH (Remote access)
- Dropbear SSH (Remote access)
- Jenkins (Continuous Integration and Continuous Delivery)
- rsyslog
- GenieACS
- Haproxy
- spamassasin
- FreeRadius
- Bind
- DHCP
- Postfix
- Squid Cache
- Zabbix
- FileZilla
IBM
- IBM Db2 (Database)
- IBM AIX (Operating System)
- IBM i (Operating System)
Brocade
- Brocade Switches
Google
- Google Cloud
- Pub/Sub & BigQuery
Elastic
- Logstash
- Filebeat
- Winlogbeat
- Auditbeat
- Metricbeat
- Packetbeat
- Heartbeat
- ... and beats from the community list
- ElasticSearch
Citrix
- Citrix Virtual Apps and Desktops (Virtualization)
- Citrix Hypervisor (Virtualization)
- Citrix ADC, NetScaler
- Citrix Gateway (Remote access)
- Citrix SD-WAN
- Citrix Endpoint Management (MDM, MAM)
Dell
- Dell EMC Isilon (network-attached storage)
- Dell PowerConnect Switches
- Dell W-Series (Access points)
- Dell iDRAC
- Dell Force10 Switches
FlowMon
- Flowmon Collector
- Flowmon Probe
- Flowmon ADS
- Flowmon FPI
- Flowmon APM
GreyCortex
- GreyCortex Mendel
Huawei
- Huawei Routers
- Huawei Switches
- Huawei Unified Security Gateway (USG)
Synology
- Synology NAS
- Synology SAN
- Synology NVR
- Synology Wi-Fi routers
Ubiquity
- UniFi
Avast
- Avast Antivirus
Kaspersky
- Kaspesky Endpoint Security
- Kaspesky Security Center
Kerio
- Kerio Connect
- Kerio Control
- Kerio Clear Web
Symantec
- Symantec Endpoint Protection Manager
- Symantec Messaging Gateway
ESET
- ESET Antivirus
- ESET Remote Administrator
AVG
- AVG Antivirus
Extreme Networks
- ExtremeXOS
IceWarp
- IceWarp Mail Server
Mikrotik
- Mikrotic Routers
- Mikrotik Switches
Pulse Secure
- Pulse Connect Secure SSL VPN
QNAP
- QNAP NAS
Safetica
- Safetica DLP
Veeam
- Veeam Backup and Restore
SuperMicro
- IPMI
Mongo
- MongoDB
YSoft
- SafeQ
Bitdefender
- Bitdefender GravityZone
- Bitdefender Network Traffic Security Analytics (NTSA)
- Bitdefender Advanced Threat Intelligence
Stapro
- Stapro FONS Akord
This list is not exhaustive, as there are many other vendors and products that can send logs to TeskaLabs LogMan.io using standard protocols such as Syslog. Please contact us if you seek for a specific technology to be integrated.
SQL log extraction
TeskaLabs LogMan.io can extract logs from various SQL databases using ODBC (Open Database Connectivity).
Among supported databases are:
- PostgreSQL
- Oracle Database
- IBM Db2
- MySQL
- SQLite
- MariaDB
- SAP HANA
- Sybase ASE
- Informix
- Teradata
- Amazon RDS (Relational Database Service)
- Google Cloud SQL
- Azure SQL Database
- Snowflake
Trademarks
All trademarks ortrade names mentioned or used are the property of their respective owners.
TeskaLabs LogMan.io Architecture
lmio-collector
LogMan.io Collector serves to receive log lines from various sources such as SysLog NG, files, Windows Event Forwarding, databases via ODBC connectors and so on. The log lines may be further processed by a declarative processor and put into LogMan.io Ingestor via WebSocket.
lmio-ingestor
LogMan.io Ingestor receives events via WebSocket, transforms them to Kafka-readable format
and put them to Kafka collected- topic. There are multiple ingestors for different
event formats, such as SysLog, databases, XML and so on.
lmio-parser
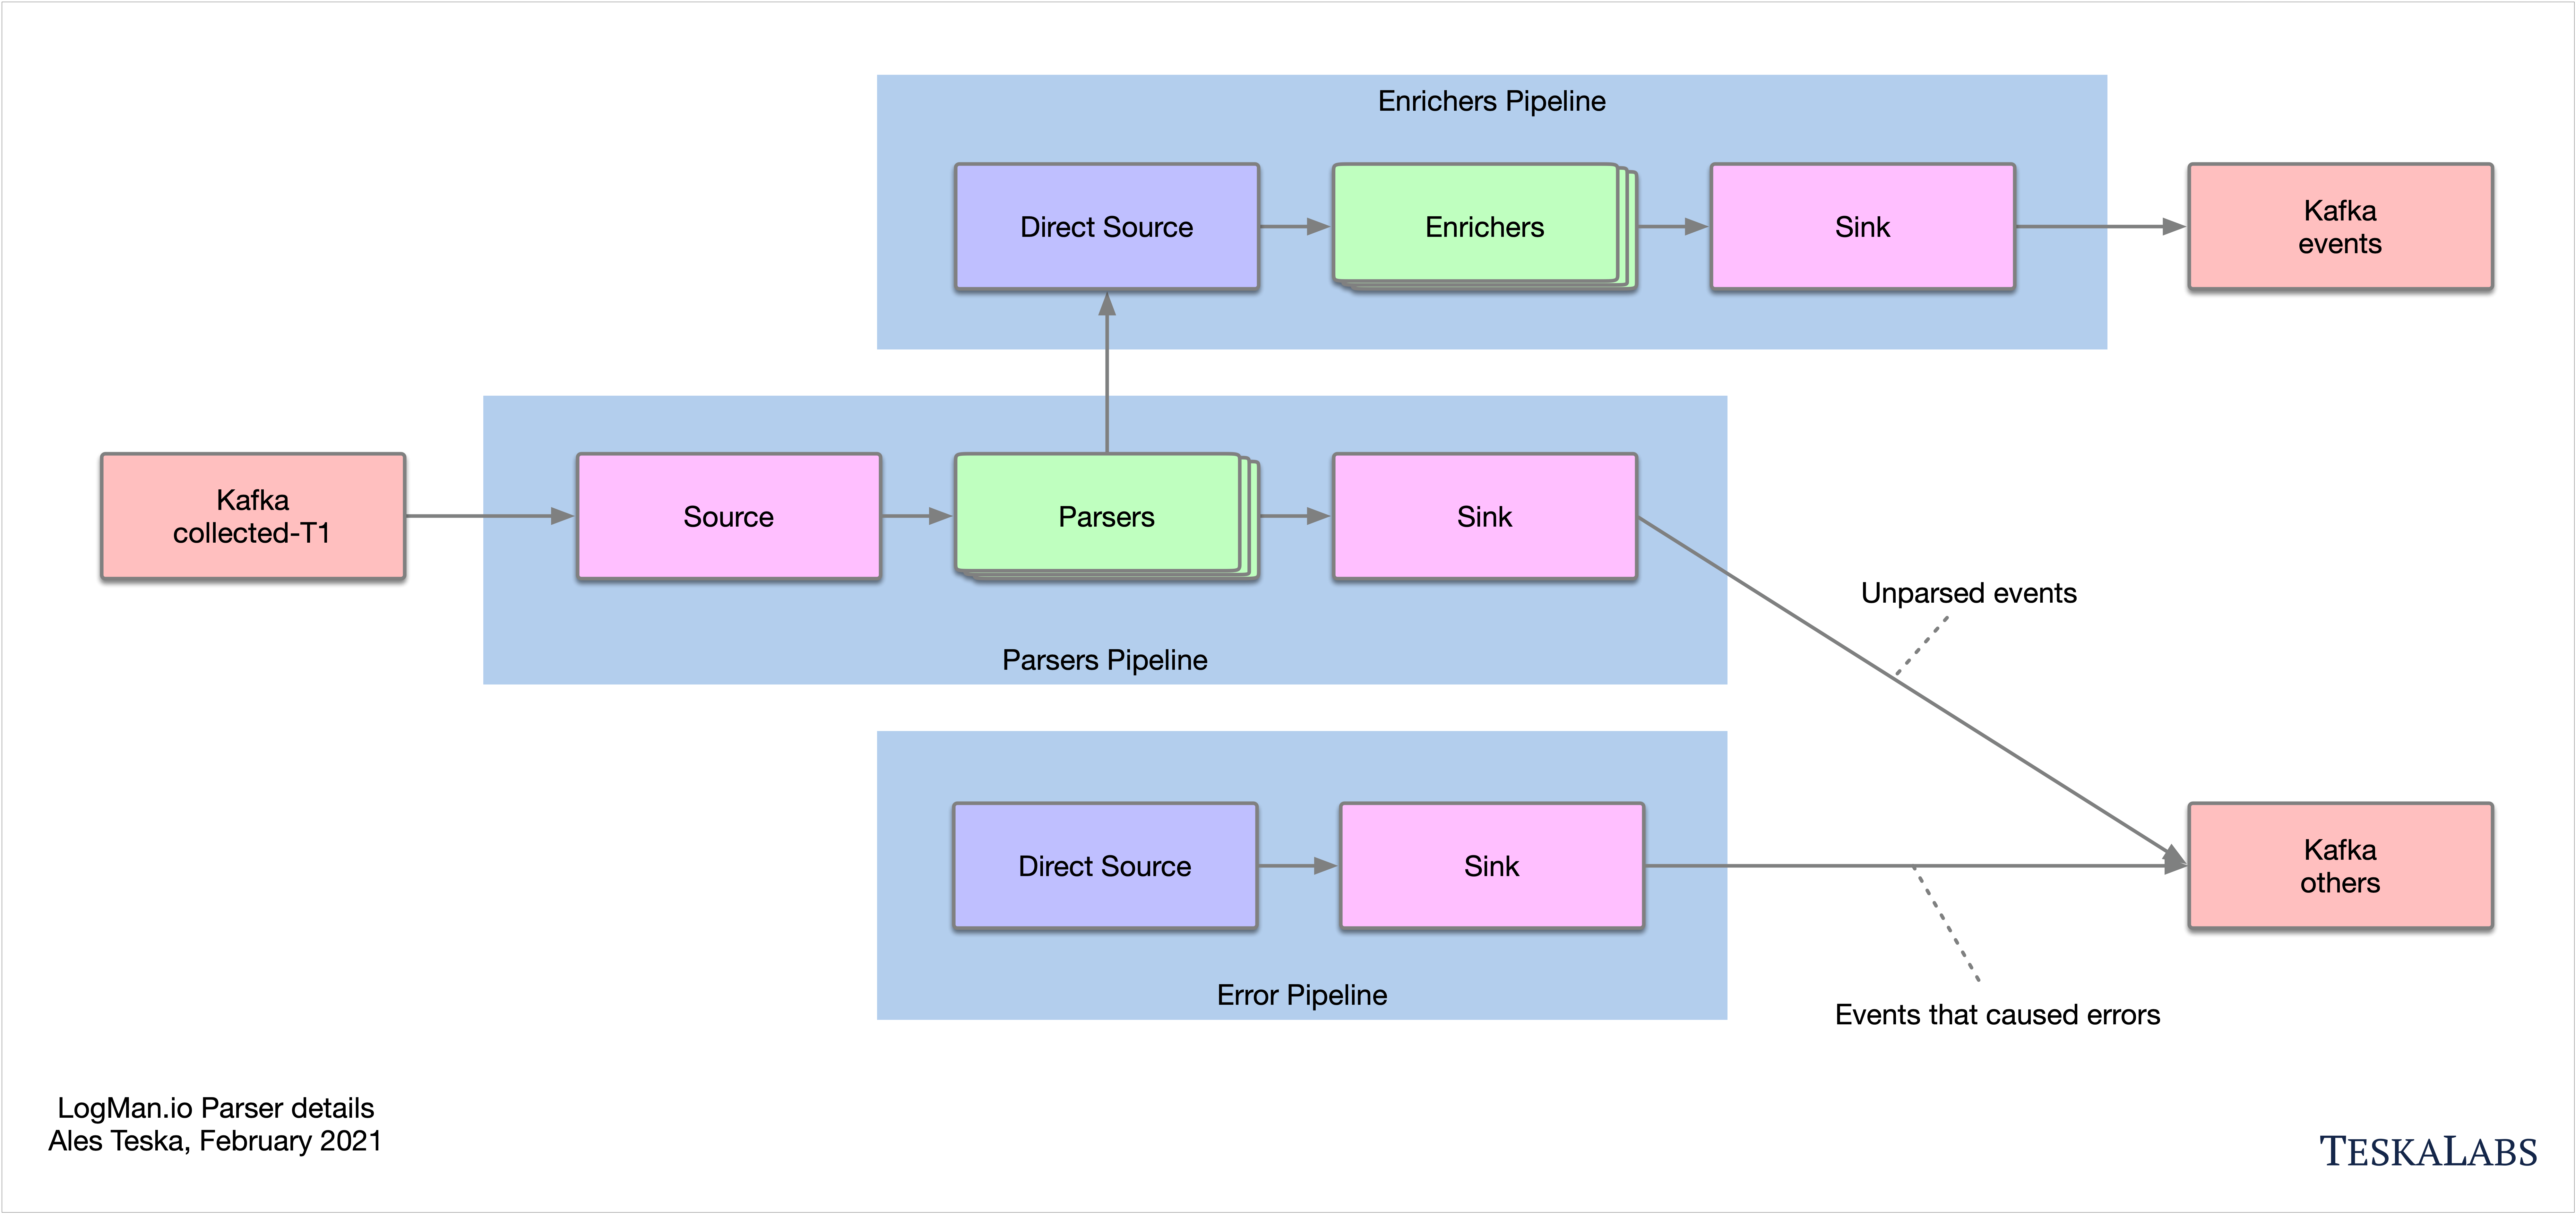
LogMan.io Parser runs in multiple instances to receive different formats of incoming events (different Kafka topics) and/or the same events (the instances then run in the same Kafka group to distribute events among them). LogMan.io Parser loads the LogMan.io Library via ZooKeeper or from files to load declarative parsers and enrichers from configured parsing groups.
If the events were parsed by the loaded parser, they are put to lmio-events Kafka topic, otherwise
they enter the lmio-others Kafka topic.
lmio-dispatcher
LogMan.io Dispatcher loads events from lmio-events Kafka topic and sends them both to all
subscribed (via ZooKeeper) LogMan.io Correlator instances and ElasticSearch in the
appropriate index, where all events can be queried and visualized using Kibana.
LogMan.io Dispatcher runs in multiple instances as well.
lmio-correlator
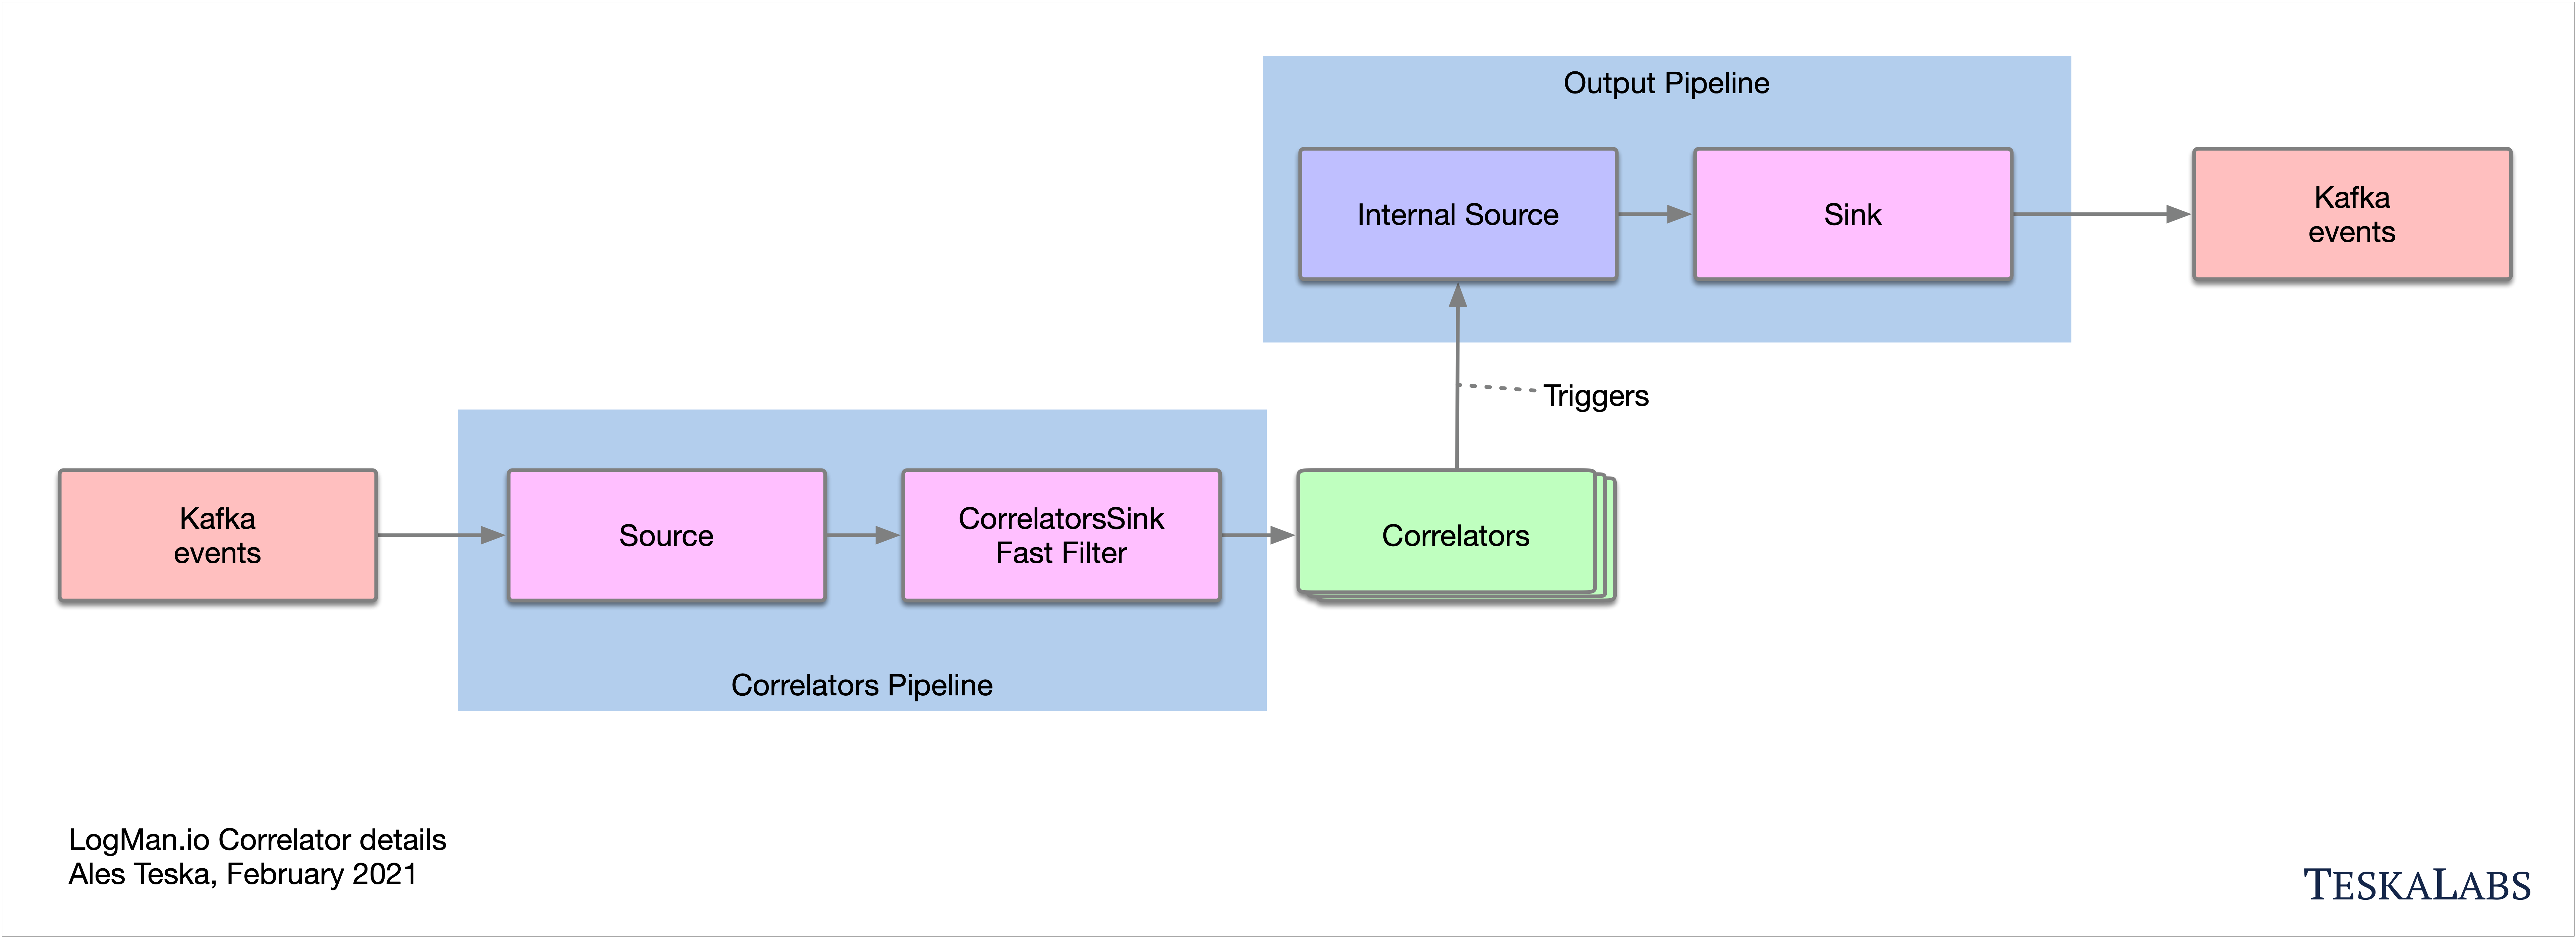
LogMan.io Correlator uses ZooKeeper to subscribe to all LogMan.io Dispatcher instances to receive parsed events (log lines etc.). Then LogMan.io Correlator loads the LogMan.io Library from ZooKeeper or from files to create correlators based on the declarative configuration. Events produced by correlators (Window Correlator, Match Correlator) are then handed down to LogMan.io Dispatcher and LogMan.io Watcher via Kafka.
lmio-watcher
LogMan.io Watcher observes changes in lookups used in LogMan.io Parsers and LogMan.io Correlators
instances. When a change occurs, all running components that use LogMan.io Library are notified
via Kafka topic lmio-lookups about the change and the lookup is updated in the ElasticSearch,
which serves as a persistent storage for all lookups.
lmio-integ
LogMan.io Integ allows LogMan.io to be integrated with supported external systems via expected message format and output/input protocol.
Support
Live help
Our team is available at our live support channel at Slack. You can message our internal experts directly, consult your plans, problems and challenges and even get online live help over share screen so that you don't need to be afraid of major upgrades and so on. The access is provided to customers with an active support plan.
Email support
Contact us at: support@teskalabs.com
Support hours
The 5/8 support level is available at working days based on Czech calendar, 09-18 Central European Time (Europe/Prague).
The 24/7 support level is also available, depending on your active support plan.
User Manual
Welcome
What's in the User Manual?
Here, you can learn how to use the TeskaLabs LogMan.io app. For information about setup, configuration, and maintenance, visit the Administration Manual or the Reference guide. If you can't find the help you need, contact Support.
Quickstart
Jump to:
- Get an overview of all events in your system (Home)
- Read incoming logs, and filter logs by field and time (Discover)
- View and filter your data as charts and graphs (Dashboards)
- View and print reports (Reports)
- Run, download, and manage exports (Export)
- Change your general or account settings
Some features are only visible to administrators, so you might not see all of the features that are included in the User Manual in your own version of TeskaLabs LogMan.io.
Administrator quickstart
Are you an administrator? Jump to:
- Add or edit files in the library, such as dashboards, reports, and exports (Library)
- Add or edit lookups (Lookups)
- Access external components that work with TeskaLabs LogMan.io (Tools)
- Change the configuration of your interface (Configuration)
- See microservices (Services)
- Manage user permissions (Auth)
Settings
Use these controls in the top right corner of your screen to change settings:
Tenants
A tenant is one entity collecting data from a group of sources. When you're using the program, you can only see the data belonging to the selected tenant. A tenant's data is completely separated from all other tenants' data in TeskaLabs LogMan.io (learn about multitenancy). Your company might have just one tenant, or possibly multiple tenants (for different departments, for example). If you're distributing or managing TeskaLabs LogMan.io for other clients, you have multiple tenants, at least one per client.
Tenants can be accessible by multiple users, and users can have access to multiple tenants. Learn more about tenancy here.
Tips
If you're new to log collection, click on the tip boxes to learn why you might want to use a feature.
Why use TeskaLabs LogMan.io?
TeskaLabs LogMan.io collects logs, which are records of every single event in your network system. This information can help you:
- Understand what's happening in your network
- Troubleshoot network problems
- Investigate security issues
Managing your account
Your account name is at the top right corner of your screen:
Changing your password
- Click on your account name.
- Click Change a password.
- Enter your current password and new password.
- Click Set password.
You should see confirmation of your password change. To return to the page you were on before changing your password, click Go back.
Changing account information
- Click on your account name.
- Click Manage.
- Here you can:
- Change your password
- Change your email address
- Change or add your phone number
- Log out
- Click on what you want to do, and make your changes. The changes won't be visible immediately - they'll be visible when you log out and log back in.
Seeing your access permissions
- Click on your account name.
- Click Access control, and you'll see what permissions you have.
Logging out
- Click on your account name.
- Click Logout.
You can also log out from the Manage screen.
Logging out from all devices
- Click on your account name.
- Click Manage.
- Click Logout from all devices.
When you log out, you'll be automatically taken to the login screen.
Using the Home page
The Home page gives you an overview of your data sources and critical incoming events. You'll be on the Home page by default when you log in, but you can also get to the Home page from the buttons on the left.
Viewing options
Chart and list view
To switch between chart and list view, click the list button.
Getting more details
Clicking on any portion of a chart takes you to Discover, where you then see the list of logs that make up this portion of the chart. From there, you can examine and filter these logs.
You can see here that Discover is automatically filtering for events from the selected dataset (from the chart on the Home page), event.dataset:devolutions.
Using Discover
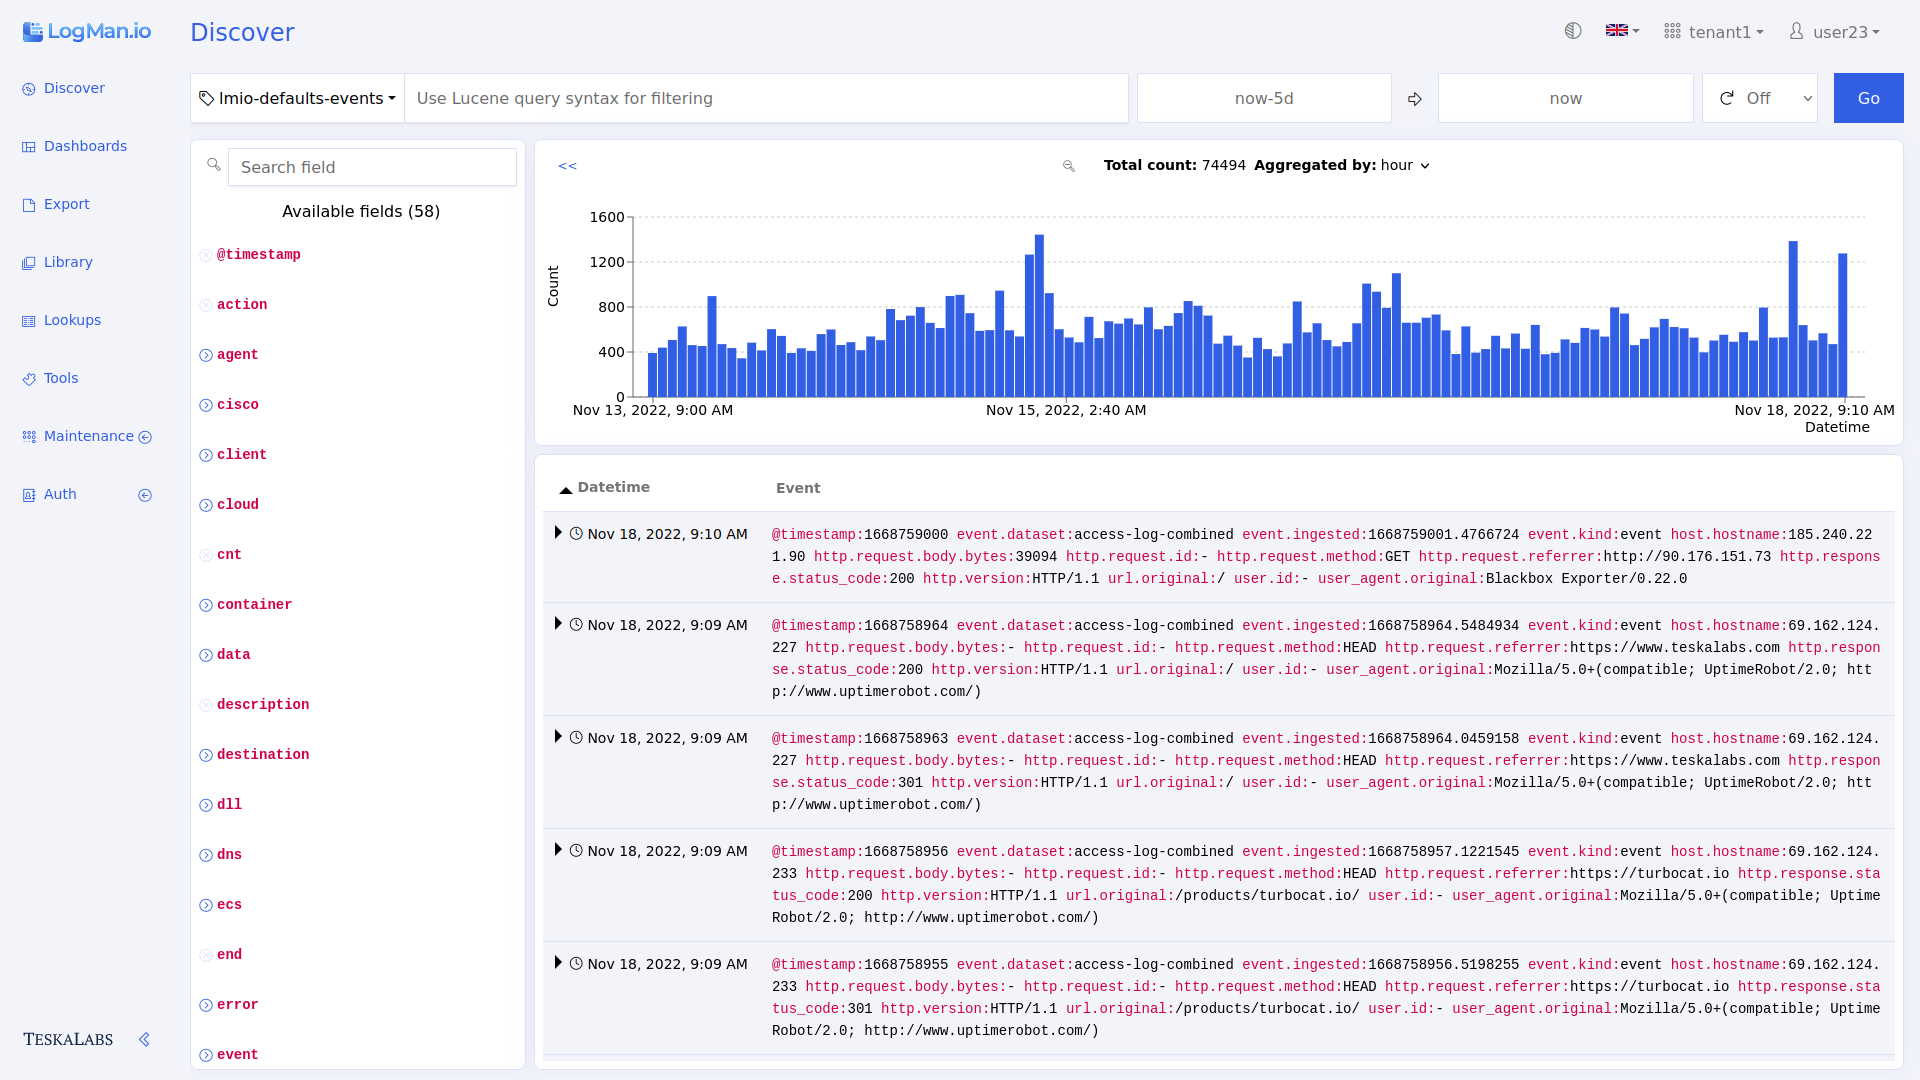
Discover gives you an overview of all logs being collected in real time. Here, you can filter the data by time and field.
Navigating Discover
Terms
Total count: The total number of logs in the timeframe being shown.
Aggregated by: In the bar chart, each bar represents the count of logs collected within a time interval. Use Aggregated by to choose the time interval. For example, Aggregated by: 30m means that each bar in the bar chart shows the count of all of the logs collected in a 30 minute timeframe. If you change to Aggregated by: hour, then each bar represents one hour of logs. The available options change based on the overall timeframe you are viewing in Discover.
Filtering data
Change the timeframe from which logs appear, and filter logs by field.
Tip: Why filter data?
Logs contain a lot of information, more than you need to accomplish most tasks. When you filter data, you choose which information you see. This can help you learn more about your network, identify trends, and even hunt for threats.
Examples:
- You want to see login data from just one user, so you filter the data to show logs containing their username.
- You had a security event on Wednesday night, and you want to learn more about it, so you filter the data to show logs from that time period.
- You notice you don't see any data from one of your network devices. You can filter the data to see all the logs from just that device. Now, you can see when the data stopped coming, and what the last event was that might have caused the problem.
Changing the timeframe
You can view logs from a specified timeframe. Set the timeframe by choosing start and end points using this tool:
Remember: Once you change the timeframe, press the blue refresh button to update your page.
Using the time setting tool
Setting a relative start/end point
To set the start or end point to a time relative to now, use the Relative tab.
Quick time settings
Use the quick now- ("now minus") options to set the timeframe to a preset with one click. Selecting one of these options affects both the start and end point. For example, if you choose now-1 week, the start point will be one week ago, and the end point will be "now." Choosing a now- option from the end point does the same thing as choosing a now- option from the start point. (You can't use the now- options to set the end point to anything besides "now.")
Drop-down options
To set a relative time (such as 15 minutes ago) for the start or end point, use the relative time options below the quick setting options. Select your unit of time from the drop-down list, and type or click to your desired number.
To confirm your choice, click Set relative time, and view the logs by clicking on the refresh button.
Example shown: This selection will show logs collected starting from one day ago until now.
Setting an exact start/end point
To choose the exact day and time for the start or end point, use the Absolute tab and select a date and time on the calendar.
To confirm your choice, click Set date.
Example shown: This selection will show logs collected starting from June 7, 2023 at 6:00 until now.


Auto refresh
To update the view automatically at a set time interval, choose a refresh rate:


Refresh
To reload the view with your changes, click the blue refresh button.


Note: Don't choose "Now" as your start point. Since the program can't show data newer than "now," it's not valid, so you'll see an error message.
Using the time selector
To select a more specific time period within the current timeframe, click and drag on the graph.
Filtering by field
In Discover, you can filter data by any field in multiple ways.
Using the field list
Use the search bar to find the field you want, or scroll through the list.
Isolating fields
To choose which fields you see in the log list, click the + symbol next to the field name. You can select multiple fields.
Seeing all occuring values in one field
To see a percentage breakdown of all the values from one field, click the magnifying glass next to the field name (the magnifying glass appears when you hover over the field name).
Tip: What does this mean?
This list of values from the field http.response.status_code compares how often users are getting certain http response codes. 51.4% of the time, users are getting a 404 code, meaning the webpage wasn't found. 43.3% of the time, users are getting a 200 code, which means that the request succeeded. The high percentage of "not found" response codes could inform a website administrator that one or more of their frequently clicked links are broken.
Viewing and filtering log details
To view the details of individual logs as a table or in JSON, click the arrow next to the timestamp. You can apply filters using the field names in the table view.
Filtering from the expanded table view
You can use controls in the table view to filter logs:


Filter for logs that contain the same value in the selected field (update_item in action in the example)
Filter for logs that do NOT contain the same value in the selected field (update_item in action in the example)
Show a percentage breakdown of values in this field (the same function as the magnifying glass in the fields list on the left)
Add to list of displayed fields for all visible logs (the same function as in the fields list on the left)
Query bar
You can filter for field (not time) using the query bar. The query bar tells you which query language to use. The query language depends on your data source. Use Lucene Query Syntax for data stored using ElasticSearch.
After you type your query, set the timeframe and click the refresh button. Your filters will be applied to the visible incoming logs.
Investigating IP addresses
You can investigate IP addresses using external analysis tools. You might want to do this, for example, if you see multiple suspicious logins from one IP address.
Using external IP analysis tools
1. Click on the IP address you want to analyze.
2. Click on the tool you want to use. You'll be taken to the tool's website, where you can see the results of the IP address analysis.
Using Dashboards
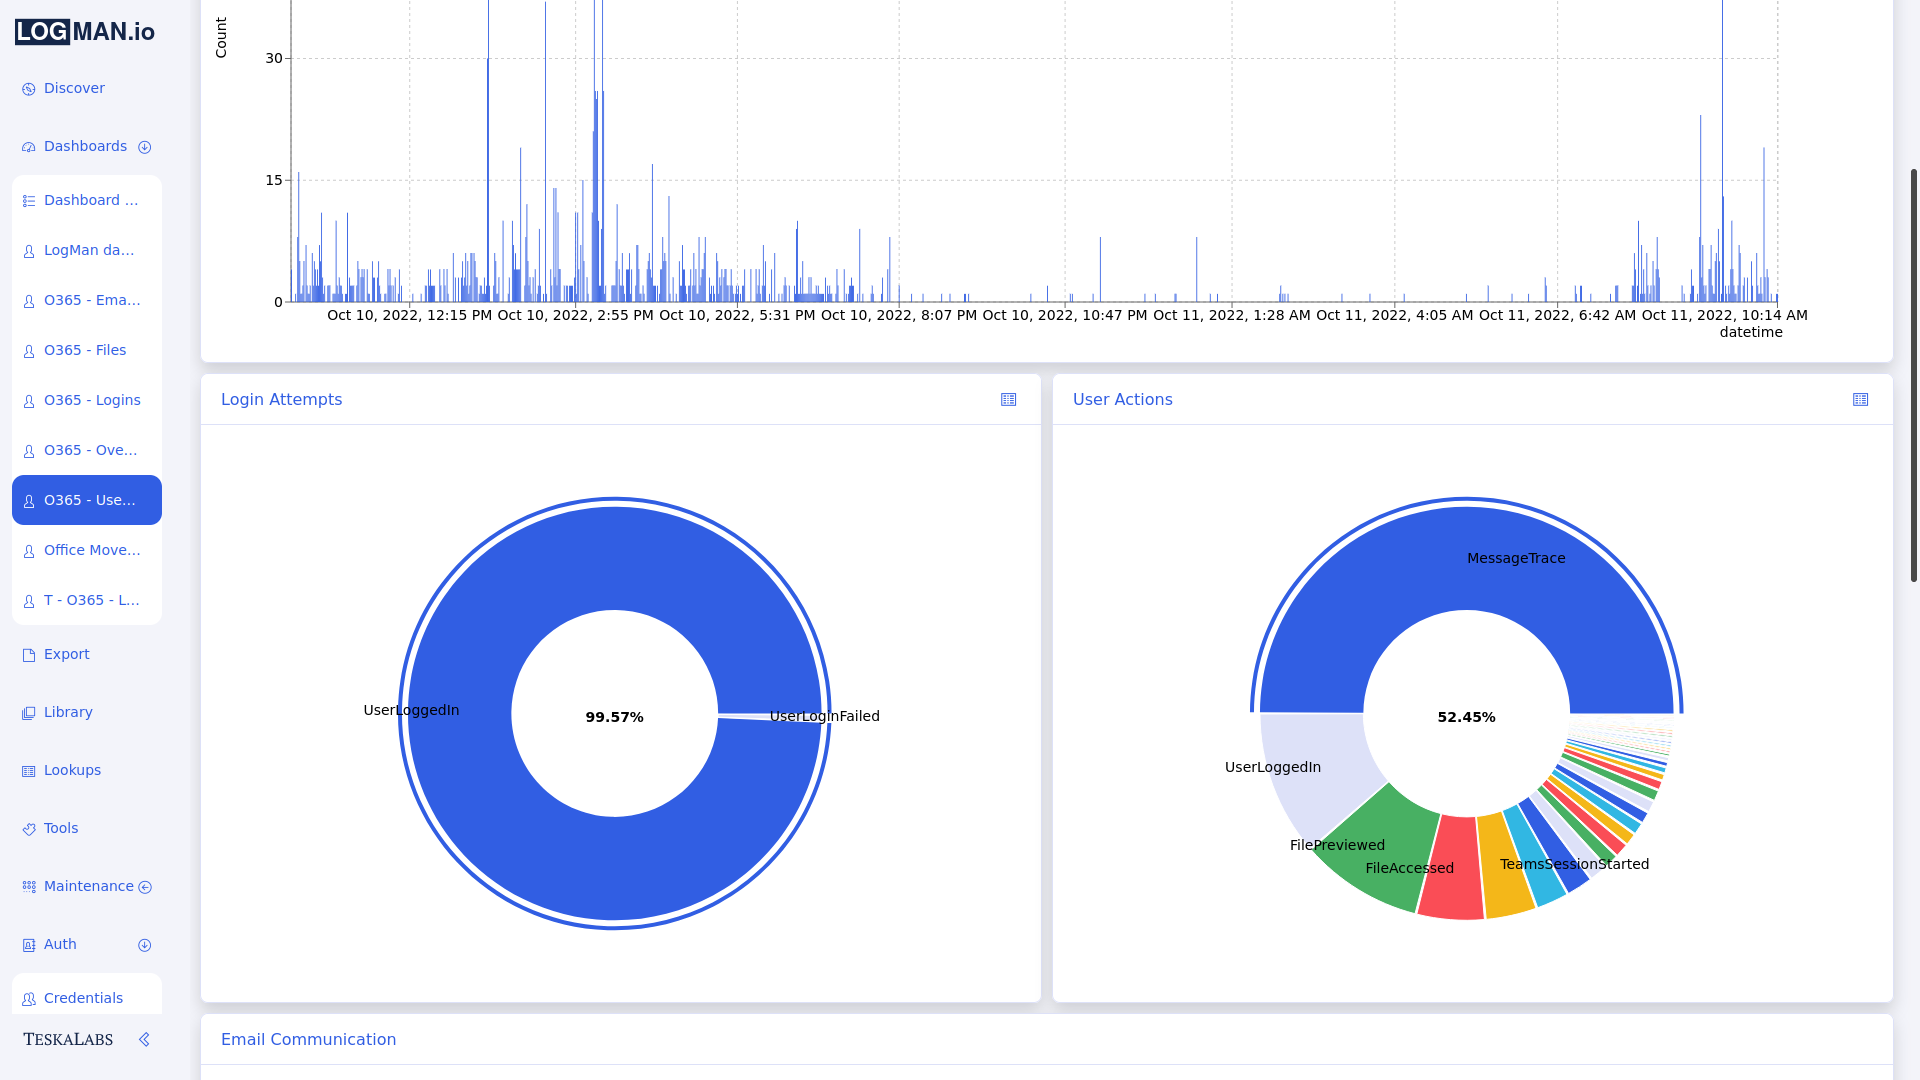
A dashboard is a set of charts and graphs that represent data from your system. Dashboards allow you to quickly get a sense for what's going on in your network.
Your administrator sets up dashboards based on the data sources and fields that are most useful to you. For example, you might have a dashboard that shows graphs related only to email activity, or only to login attempts. You might have many dashboards for different purposes.
You can filter the data to change which data the dashboard shows within its preset constraints.
How can dashboards help me?
By having certain data arranged into a chart, table, or graph, you can get a visual overview of activity within your system and identify trends.
In this example, you can see that a high volume of emails were sent and received on June 19th.


Navigating Dashboards
Opening a dashboard
To open a dashboard, click on its name.
Dashboard controls
Setting the timeframe
You can change the timeframe the dashboard represents. Find the time-setting guide here. To refresh the dashboard with your new timeframe, click on the refresh button.
Note: There is no auto-refresh rate in Dashboards.
Filtering dashboard data
To filter the data the dashboard shows, use the query bar. The query language you need to use depends on your data source. The query bar tells you which query language to use. Use Lucene Query Syntax for data stored using ElasticSearch.
Moving widgets
You can reposition and resize each widget. To move widgets, click on the dashboard menu button and select Edit.
To move a widget, click anywere on the widget and drag. To resize a widget, click on the widget's bottom right corner and drag.
To save your changes, click the green save button. To cancel the changes, click the red cancel button.
Printing dashboards
To print a dashboard, click on the dashboard menu button and select Print. Your browser opens a window, and you can choose your print settings there.
Reports
Reports are printer-friendly visual representations of your data, like printable dashboards. Your administrator chooses what information goes into your reports based on your needs.
Find and print a report
- Select the report from your list, or use the search bar to find your report.
- Click Print. Your browser opens a print window where you can choose your print settings.
Using Export
Turn sets of logs into downloadable, sendable files in Export. You can keep these files on your computer, inspect them in another program, or send them via email.
What is an export?
An export is not a file, but a process that creates a file. The export contains and follows your instructions for which data to put in the file, what type of file to create, and what to do with the file. When you run the export, you create the file.
Why would I export logs?
Being able to see a group of logs in one file can help you inspect the data more closely. A few reasons you might want to export logs are:
- To investigate an event or attack
- To send data to an analyst
- To explore the data in a program outside TeskaLabs LogMan.io
Navigating Export
List of exports
The List of exports shows you all the exports that have been run.
From the list page, you can:
- See an export's details by clicking on the export's name
- Download the export by clicking on the cloud beside its name
- Delete the export by clicking on the trash can beside its name
- Search for exports using the search bar
Export status is color-coded:
- Green: Completed
- Yellow: In progress
- Blue: Scheduled
- Red: Failed
Jump to:
Run an export
Running an export adds the export to your List of exports, but it does not automatically download the export. See Download an export for instructions.
Run an export based on a preset
1. Click New on the List of exports page. Now you can see the preset exports:
2. To run a preset export, click the run button beside the export name.
OR
2. To edit the export before running, click on the edit button beside the export name. Make your changes, and then click Start. (Use this guide to learn about making changes.)
Once you run the export, you are automatically brought back to the list of exports, and your export appears at the top of the list.
Note
Export presets are created by administrators.
Run an export based on an export you've run before
You can re-run an export. Running an export again does not overwrite the original export.
1. On the List of exports page, click on the name of the export you want to run again.
2. Click Restart.
3. You can make changes here (see this guide) or run as-is.
4. Click Start.
Once you run the export, you are automatically brought back to the list of exports, and your new export appears at the top of the list.
Create a new export
Create an export from a blank form
1. In List of exports, click New, then click Custom.
2. Fill in the fields.
Note
The options in the drop down menus might change based on the selections you make.
Name
Name the export.
Data Source
Select your data source from the drop-down list.
Output
Choose the file type for your data. It can be:
- Raw: If you want to download the export and import the logs into different software, choose raw. If the data source is Elasticsearch, the raw file format is .json.
- .csv: Comma-separated values
- .xlsx: Microsoft Excel format
Compression
Choose to zip your export file, or leave it uncompressed. A zipped file is compressed, and therefore smaller, so it's easier to send, and it takes up less space in your computer.
Target
Choose the target for your file. It can be:
- Download: A file you can download to your computer.
- Email: Fill in the email fields. When you run the export, the email sends. You can still download the data file any time in the List of exports.
- Jupyter: Saves the file in the Jupyter notebook, which you can access through the Tools page. You need to have administrator permissions to access the Jupyter notebook, so only choose Jupyter as the target if you're an administrator.
Separator
If you select .csv as your output, choose what character will mark the separation between each value in each log. Even though CSV means comma-separated values, you can choose to use a different separator, such as a semicolon or space.
Schedule (optional)
To schedule the export, rather than running it immediately, click Add schedule.
-
Schedule once:
- To run the export one time at a future time, type the desired date and time in
YYYY-MM-DD HH:mmformat, for example2023-12-31 23:59(December 31st, 2023, at 23:59).
- To run the export one time at a future time, type the desired date and time in
-
Schedule a recurring export:
-
To set up the export to run automatically on a regular schedule, use
cronsyntax. You can learn more aboutcronfrom Wikipedia, and use this tool and these examples by Cronitor to help you writecronexpressions. -
The Schedule field also supports random
Rusage and Vixie cron-style@keyword expressions.
-
Query
Type a query to filter for certain data. The query determines which data to export, including the timeframe of the logs.
Warning
You must include a query in every export. If you run an export without a query, all of the data stored in your program will be exported with no filter for time or content. This could create an extremely large file and put strain on data storage components, and the file likely won't be useful to you or to analysts.
If you accidentally run an export without a query, you can delete the export while it's still running in the List of exports by clicking on the trash can button.
TeskaLabs LogMan.io uses the Elasticsearch Query DSL (Domain Specific Language).
Here's the full guide to the Elasticsearch Query DSL.
Example of a query:
{
  "bool": {
    "filter": [
      {
        "range": {
          "@timestamp": {
            "gte": "now-1d/d",
            "lt": "now/d"
          }
        }
      },
      {
        "prefix": {
         "event.dataset": {
            "value": "microsoft-office-365"
          }
       }
      }
   ]
  }
}
Query breakdown:
bool: This tells us that the whole query is a Boolean query, which combines mutliple conditions such as "must," "should," and "must not" Here, it's using filter to find characteristics the data must have to make it into the export. filter can have mutliple conditions.
range is the first filter condition. Since it refers to the field below it, which is @timestamp, it will filter for logs based on a range of values in the timestamp field.
@timestamp tells us that the query is filtering for time, so it will export logs from a certain timeframe.
gte: This means "greater than or equal to," which is set to the value now-1d/d, meaning the earliest timestamp (the first log) will be from exactly one day ago at the moment you run the export.
lt means "less than," and it is set to now/d, so the latest timestamp (the last log) will be the newest at the moment you run the export ("now").
prefix is the second filter condition. It looks for logs where the value of a field, in this case event.dataset, starts with microsoft-office-365.
So, what does this query mean?
This export will show all logs from Microsoft Office 365 from the last 24 hours.
3. Add columns
For .csv and .xlsx files, you need to specify what columns you want to have in your document. Each column represents a data field. If you don't specify any columns, the resulting table will have all possible columns, so the table might be much bigger than you expect or need it to be.
You can see the list of all available data fields in Discover. To find which fields are relevant to the logs you're exporting, inspect an individual log in Discover.
- To add a column, click Add. Type the name of the column.
- To delete a column, click -.
- To reorder the columns, click and drag the arrows.
Warning
Pressing enter after typing a column name will run the export.
This example was downloaded from the export shown above as a .csv file, then separated into columns using the Microsoft Excel Convert Text to Columns Wizard. You can see that the columns here match the columns specified in the export.
4. Run the export by pressing Start.
Once you run the export, you are automatically brought back to the list of exports, and your export appears at the top of the list.
Download an export
1. On the List of exports page, click on the cloud button to download.
OR
1. On the List of exports page, click on the export's name.
2. Click Download.
Your browser should automatcially start a download.
Delete an export
1. On the List of exports page, click on the trash can button.
OR
1. On the List of exports page, click on the export's name.
2. Click Remove.
The export should disappear from your list.
Add an export to your library
Note
This feature is only available to administrators.
If you like an export you've created or edited, you can save it to your library as a preset for future use.
1. On the List of exports page, click on the export's name.
2. Click Save to Library.
When you click on New from the List of exports page, your new export preset should be in the list.
All features
Home page
The Home page gives you an overview of your data sources and critical incoming events.
Viewing options
Chart and list view
To switch between chart and list view, click the list button.
Getting more details
Clicking on any portion of a chart takes you to Discover, where you then see the list of logs that make up this portion of the chart. From there, you can examine and filter these logs.
You can see here that Discover is automatically filtering for events from the selected dataset (from the chart on the Home page), event.dataset:devolutions.
Discover
Discover gives you an overview of all logs being collected in real time. Here, you can filter the data by time and field.
Navigating Discover
Terms
Total count: The total number of logs in the timeframe being shown.
Aggregated by: In the bar chart, each bar represents the count of logs collected within a time interval. Use Aggregated by to choose the time interval. For example, Aggregated by: 30m means that each bar in the bar chart shows the count of all of the logs collected in a 30 minute timeframe. If you change to Aggregated by: hour, then each bar represents one hour of logs. The available options change based on the overall timeframe you are viewing in Discover.
Filtering data
Change the timeframe from which logs appear, and filter logs by field.
Tip: Why filter data?
Logs contain a lot of information, more than you need to accomplish most tasks. When you filter data, you choose which information you see. This can help you learn more about your network, identify trends, and even hunt for threats.
Examples:
- You want to see login data from just one user, so you filter the data to show logs containing their username.
- You had a security event on Wednesday night, and you want to learn more about it, so you filter the data to show logs from that time period.
- You notice you don't see any data from one of your network devices. You can filter the data to see all the logs from just that device. Now, you can see when the data stopped coming, and what the last event was that might have caused the problem.
Changing the timeframe
You can view logs from a specified timeframe. Set the timeframe by choosing start and end points using this tool:
Remember: Once you change the timeframe, press the blue refresh button to update your page.
Using the time setting tool
Setting a relative start/end point
To set the start or end point to a time relative to now, use the Relative tab.
Quick time settings
Use the quick now- ("now minus") options to set the timeframe to a preset with one click. Selecting one of these options affects both the start and end point. For example, if you choose now-1 week, the start point will be one week ago, and the end point will be "now." Choosing a now- option from the end point does the same thing as choosing a now- option from the start point. (You can't use the now- options to set the end point to anything besides "now.")
Drop-down options
To set a relative time (such as 15 minutes ago) for the start or end point, use the relative time options below the quick setting options. Select your unit of time from the drop-down list, and type or click to your desired number.
To confirm your choice, click Set relative time, and view the logs by clicking on the refresh button.
Example shown: This selection will show logs collected starting from one day ago until now.
Setting an exact start/end point
To choose the exact day and time for the start or end point, use the Absolute tab and select a date and time on the calendar.
To confirm your choice, click Set date.
Example shown: This selection will show logs collected starting from June 7, 2023 at 6:00 until now.


Auto refresh
To update the view automatically at a set time interval, choose a refresh rate:


Refresh
To reload the view with your changes, click the blue refresh button.


Note: Don't choose "Now" as your start point. Since the program can't show data newer than "now," it's not valid, so you'll see an error message.
Using the time selector
To select a more specific time period within the current timeframe, click and drag on the graph.
Filtering by field
In Discover, you can filter data by any field in multiple ways.
Using the field list
Use the search bar to find the field you want, or scroll through the list.
Isolating fields
To choose which fields you see in the log list, click the + symbol next to the field name. You can select multiple fields.
Seeing all occuring values in one field
To see a percentage breakdown of all the values from one field, click the magnifying glass next to the field name (the magnifying glass appears when you hover over the field name).
Tip: What does this mean?
This list of values from the field http.response.status_code compares how often users are getting certain http response codes. 51.4% of the time, users are getting a 404 code, meaning the webpage wasn't found. 43.3% of the time, users are getting a 200 code, which means that the request succeeded. The high percentage of "not found" response codes could inform a website administrator that one or more of their frequently clicked links are broken.
Viewing and filtering log details
To view the details of individual logs as a table or in JSON, click the arrow next to the timestamp. You can apply filters using the field names in the table view.
Filtering from the expanded table view
You can use controls in the table view to filter logs:


Filter for logs that contain the same value in the selected field (update_item in action in the example)
Filter for logs that do NOT contain the same value in the selected field (update_item in action in the example)
Show a percentage breakdown of values in this field (the same function as the magnifying glass in the fields list on the left)
Add to list of displayed fields for all visible logs (the same function as in the fields list on the left)
Query bar
You can filter for field (not time) using the query bar. The query bar tells you which query language to use. The query language depends on your data source. Use Lucene Query Syntax for data stored using ElasticSearch.
After you type your query, set the timeframe and click the refresh button. Your filters will be applied to the visible incoming logs.
Investigating IP addresses
You can investigate IP addresses using external analysis tools. You might want to do this, for example, if you see multiple suspicious logins from one IP address.
Using external IP analysis tools
1. Click on the IP address you want to analyze.
2. Click on the tool you want to use. You'll be taken to the tool's website, where you can see the results of the IP address analysis.
Dashboards
A dashboard is a set of charts and graphs that represent data from your system. Dashboards allow you to quickly get a sense for what's going on in your network.
Your administrator sets up dashboards based on the data sources and fields that are most useful to you. For example, you might have a dashboard that shows graphs related only to email activity, or only to login attempts. You might have many dashboards for different purposes.
You can filter the data to change which data the dashboard shows within its preset constraints.
How can dashboards help me?
By having certain data arranged into a chart, table, or graph, you can get a visual overview of activity within your system and identify trends.
In this example, you can see that a high volume of emails were sent and received on June 19th.


Navigating Dashboards
Opening a dashboard
To open a dashboard, click on its name.
Dashboard controls
Setting the timeframe
You can change the timeframe the dashboard represents. Find the time-setting guide here. To refresh the dashboard with your new timeframe, click on the refresh button.
Note: There is no auto-refresh rate in Dashboards.
Filtering dashboard data
To filter the data the dashboard shows, use the query bar. The query language you need to use depends on your data source. The query bar tells you which query language to use. Use Lucene Query Syntax for data stored using ElasticSearch.
The example above uses Lucene Query Syntax.
Moving widgets
You can reposition and resize each widget. To move widgets, click on the dashboard menu button and select Edit.
To move a widget, click anywere on the widget and drag. To resize a widget, click on the widget's bottom right corner and drag.
To save your changes, click the green save button. To cancel the changes, click the red cancel button.
Printing dashboards
To print a dashboard, click on the dashboard menu button and select Print. Your browser opens a window, and you can choose your print settings there.
Reports
Reports are printer-friendly visual representations of your data, like printable dashboards. Your administrator chooses what information goes into your reports based on your needs.
Find and print a report
- Select the report from your list, or use the search bar to find your report.
- Click Print. Your browser opens a print window where you can choose your print settings.
Export
Turn sets of logs into downloadable, sendable files in Export. You can keep these files on your computer, inspect them in another program, or send them via email.
What is an export?
An export is not a file, but a process that creates a file. The export contains and follows your instructions for which data to put in the file, what type of file to create, and what to do with the file. When you run the export, you create the file.
Why would I export logs?
Being able to see a group of logs in one file can help you inspect the data more closely. A few reasons you might want to export logs are:
- To investigate an event or attack
- To send data to an analyst
- To explore the data in a program outside TeskaLabs LogMan.io
Navigating Export
List of exports
The List of exports shows you all the exports that have been run.
From the list page, you can:
- See an export's details by clicking on the export's name
- Download the export by clicking on the cloud beside its name
- Delete the export by clicking on the trash can beside its name
- Search for exports using the search bar
Export status is color-coded:
- Green: Completed
- Yellow: In progress
- Blue: Scheduled
- Red: Failed
Jump to:
Run an export
Running an export adds the export to your List of exports, but it does not automatically download the export. See Download an export for instructions.
Run an export based on a preset
1. Click New on the List of exports page. Now you can see the preset exports:
2. To run a preset export, click the run button beside the export name.
OR
2. To edit the export before running, click on the edit button beside the export name. Make your changes, and then click Start. (Use this guide to learn about making changes.)
Once you run the export, you are automatically brought back to the list of exports, and your export appears at the top of the list.
Note
Presets are created by administrators.
Run an export based on an export you've run before
You can re-run an export. Running an export again does not overwrite the original export.
1. On the List of exports page, click on the name of the export you want to run again.
2. Click Restart.
3. You can make changes here (see this guide) or run as-is.
4. Click Start.
Once you run the export, you are automatically brought back to the list of exports, and your new export appears at the top of the list.
Create a new export
Create an export from a blank form
1. In List of exports, click New, then click Custom.
2. Fill in the fields.
Note
The options in the drop down menus might change based on the selections you make.
Name
Name the export.
Data Source
Select your data source from the drop-down list.
Output
Choose the file type for your data. It can be:
- Raw: If you want to download the export and import the logs into different software, choose raw. If the data source is Elasticsearch, the raw file format is .json.
- .csv: Comma-separated values
- .xlsx: Microsoft Excel format
Compression
Choose to zip your export file, or leave it uncompressed. A zipped file is compressed, and therefore smaller, so it's easier to send, and it takes up less space in your computer.
Target
Choose the target for your file. It can be:
- Download: A file you can download to your computer.
- Email: Fill in the email fields. When you run the export, the email sends. You can still download the data file any time in the List of exports.
- Jupyter: Saves the file in the Jupyter notebook, which you can access through the Tools page. You need to have administrator permissions to access the Jupyter notebook, so only choose Jupyter as the target if you're an administrator.
Separator
If you select .csv as your output, choose what character will mark the separation between each value in each log. Even though CSV means comma-separated values, you can choose to use a different separator, such as a semicolon or space.
Schedule (optional)
To schedule the export, rather than running it immediately, click Add schedule.
-
Schedule once:
- To run the export one time at a future time, type the desired date and time in
YYYY-MM-DD HH:mmformat, for example2023-12-31 23:59(December 31st, 2023, at 23:59).
- To run the export one time at a future time, type the desired date and time in
-
Schedule a recurring export:
-
To set up the export to run automatically on a regular schedule, use
cronsyntax. You can learn more aboutcronfrom Wikipedia, and use this tool and these examples by Cronitor to help you writecronexpressions. -
The Schedule field also supports random
Rusage and Vixie cron-style@keyword expressions.
-
Query
Type a query to filter for certain data. The query determines which data to export, including the timeframe of the logs.
Warning
You must include a query in every export. If you run an export without a query, all of the data stored in your program will be exported with no filter for time or content. This could create an extremely large file and put strain on data storage components, and the file likely won't be useful to you or to analysts.
If you accidentally run an export without a query, you can delete the export while it's still running in the List of exports by clicking on the trash can button.
TeskaLabs LogMan.io uses the Elasticsearch Query DSL (Domain Specific Language).
Here's the full guide to the Elasticsearch Query DSL.
Example of a query:
{
  "bool": {
    "filter": [
      {
        "range": {
          "@timestamp": {
            "gte": "now-1d/d",
            "lt": "now/d"
          }
        }
      },
      {
        "prefix": {
         "event.dataset": {
            "value": "microsoft-office-365"
          }
       }
      }
   ]
  }
}
Query breakdown:
bool: This tells us that the whole query is a Boolean query, which combines mutliple conditions such as "must," "should," and "must not" Here, it's using filter to find characteristics the data must have to make it into the export. filter can have mutliple conditions.
range is the first filter condition. Since it refers to the field below it, which is @timestamp, it will filter for logs based on a range of values in the timestamp field.
@timestamp tells us that the query is filtering for time, so it will export logs from a certain timeframe.
gte: This means "greater than or equal to," which is set to the value now-1d/d, meaning the earliest timestamp (the first log) will be from exactly one day ago at the moment you run the export.
lt means "less than," and it is set to now/d, so the latest timestamp (the last log) will be the newest at the moment you run the export ("now").
prefix is the second filter condition. It looks for logs where the value of a field, in this case event.dataset, starts with microsoft-office-365.
So, what does this query mean?
This export will show all logs from Microsoft Office 365 from the last 24 hours.
3. Add columns
For .csv and .xlsx files, you need to specify what columns you want to have in your document. Each column represents a data field. If you don't specify any columns, the resulting table will have all possible columns, so the table might be much bigger than you expect or need it to be.
You can see the list of all available data fields in Discover. To find which fields are relevant to the logs you're exporting, inspect an individual log in Discover.
- To add a column, click Add. Type the name of the column.
- To delete a column, click -.
- To reorder the columns, click and drag the arrows.
Warning
Pressing enter after typing a column name will run the export.
This example was downloaded from the export shown above as a .csv file, then separated into columns using the Microsoft Excel Convert Text to Columns Wizard. You can see that the columns here match the columns specified in the export.
4. Run the export by pressing Start.
Once you run the export, you are automatically brought back to the list of exports, and your export appears at the top of the list.
Download an export
1. On the List of exports page, click on the cloud button to download.
OR
1. On the List of exports page, click on the export's name.
2. Click Download.
Your browser should automatcially start a download.
Delete an export
1. On the List of exports page, click on the trash can button.
OR
1. On the List of exports page, click on the export's name.
2. Click Remove.
The export should disappear from your list.
Add an export to your library
Note
This feature is only available to administrators.
If you like an export you've created or edited, you can save it to your library as a preset for future use.
1. On the List of exports page, click on the export's name.
2. Click Save to Library.
When you click on New from the List of exports page, your new export preset should be in the list.
Library
Administrator feature
The Library is an administrator feature. The Library has a significant impact on the way TeskaLabs LogMan.io works. Some users don't have access to the Library.
The Library holds items (files) that determine what you see when using TeskaLabs LogMan.io. The items in the Library determine, for example, your homepage, dashboards, reports, exports, and some SIEM functions.
When you recieve TeskaLabs LogMan.io, the Library is already filled with files. You can change these according to your needs.
The Library supports these file types:
- .html
- .json
- .md
- .txt
- .yaml
- .yml
Warning
Changing items in the Library impacts how TeskaLabs LogMan.io and TeskaLabs SIEM work. If you are unsure about making changes in the Library, contact Support.
Navigating the Library
Some items have additional options in the upper right corner of the screen:
Locating items
To find an item, use the search bar, or click through the folders.
If you navigate to a folder in the Library and want to return to the search bar, click Library again.
Adding items to the Library
Warning
Do NOT attempt to add single items to the library with the Restore function. Restore is only for importing a whole library.
Creating items in a folder
You can create an item directly in certain folders. If adding an item is possible, you'll see a Create new item in (folder) button when you click on the folder.
- To add an item, click Create new item in (folder).
- Name the item, select the file extension from the dropdown, and click Create.
- If the item doesn't appear immediately, refresh the page, and your item should appear in the library.
Adding an item by duplicating an existing item
- Click on the item you want to duplicate.
- Click on the ... button near the top.
- Click Copy.
- Rename the item, choose the file extension from the dropdown, and click Copy.
- If the item doesn't appear immediately, refresh the page, and your item should appear in the library.
Editing an item in the Library
- Click on the item you want to edit.
- To edit the item, click Edit.
- To save your changes, click Save, or exit the editor without saving by clicking Cancel.
- If your edits don't display immediately, refresh the page, and your changes should be saved.
Removing an item from the Library
- Click on the item you want to remove.
- Click on the ... button near the top.
- Click Remove and confirm Yes if your browser prompts.
- If if the item doesn't disappear immediately, refresh the page, and the removed item should be gone.
Disabling items
You can temporarily disable an item. It stays in your library, but its effect on your system is paused.
To disable an item, click on the item and click Disable.
You can re-enable the file any time by clicking Enable.
Note
You can't read the contents of an item while it's disabled.
Backing up the Library
You can back up your whole Library onto your computer or other external storage by exporting the Library.
To export and download the contents of the Library, click Actions, then click Backup. Your browswer will start the download.
Restoring the library from backup
Warning
Using Restore means importing a whole library from your computer. Restore is intended to restore your library from a backup version, so it will overwrite (delete) the existing contents of your Library in TeskaLabs LogMan.io. ONLY restore the Library if you intend to replace the entire contents of the Library with the files you're importing.
Restoring
- Click Actions.
- Click Restore.
- Choose the file from your computer. You can only import tar.gz files.
- Click Import.
Remember, using Restore and Import overwrites your whole library.
Lookups
Administrator feature
Lookups are an administrator feature. Some users don't have access to Lookups.
You can use lookups to get and store additional information from external sources. The additional information enhances your data and adds relevant context. This makes your data more valuable because you can analyze the data more deeply. For example, you can store user names, active users, active VPNs, and suspicious IP addresses.
Tip
You can read more about Lookups here in the Reference guide.
Navigating Lookups
Creating a new lookup
To create a new lookup:
- Click Create lookup.
- Fill in the fields: Name, Short description, Detail description, and Key(s).
- To add another key, click on the +.
- Choose to add or not add an expiration.
- Click Save.
Finding a lookup
Use the search bar to find a specific lookup. Using the search bar does not search the contents of the lookups, only the lookup names. To view all the lookups again after using the search bar, clear the search bar and press Enter or Return.
Viewing and editing a lookup's details
Viewing a lookup's keys/items
To see a lookup's keys and values, or items, click on the ... button, and click Items.
Editing a lookup's keys/items
From the List of lookups, click on the ... button and click Items. This takes you to the individual lookup's page.
Adding: To add an item, click Add item.
Editing: To edit an existing item, click the ... button on the item line, and click Edit.
Deleting: To delete the item, click the ... button on the item line, and click Delete.
Remember to click Save after making changes.
Viewing a lookup's description
To see the detailed description of a lookup, click on the ... button on the List of lookups page, and click Info.
Editing a lookup's description
- Click on the ... button on the List of lookups page, and click Info. This takes you to the lookup's info page.
- Click Edit lookup at the bottom.
- After making changes, click Save, or click Cancel to exit editing mode.
Deleting a lookup
To delete a lookup:
-
Click on the ... button on the List of lookups page, and click Info. This takes you to the lookup's info page.
-
Click Delete lookup.
Tools
Administrator feature
Tools are an administrator feature. Changes you make when visiting external tools can have a significant impact on the way TeskaLabs LogMan.io works. Some users don't have access to the Tools page.
The Tools page gives you quick access to external programs that interact with or can be used alongside TeskaLabs LogMan.io.
Using external tools
To automatically log in securely to a tool, click on the tool's icon.
Warnings
- While tenants' data is separated in the TeskaLabs LogMan.io UI, tenants' data is not separated within these tools.
- Changes you make in Zookeeper, Kafka, and Kibana could damage your deployment of TeskaLabs LogMan.io.
Maintenance
Administrator feature
Maintenance is an administrator feature. What you do in Maintenance has a significant impact on the way TeskaLabs LogMan.io works. Some users don't have access to Maintenance.
The Maintenance section includes Configuration and Services.
Configuration
Configuration holds JSON files that determine some of the components you can see and use in TeskaLabs LogMan.io. For example, Configuration includes:
- The Discover page
- The sidebar
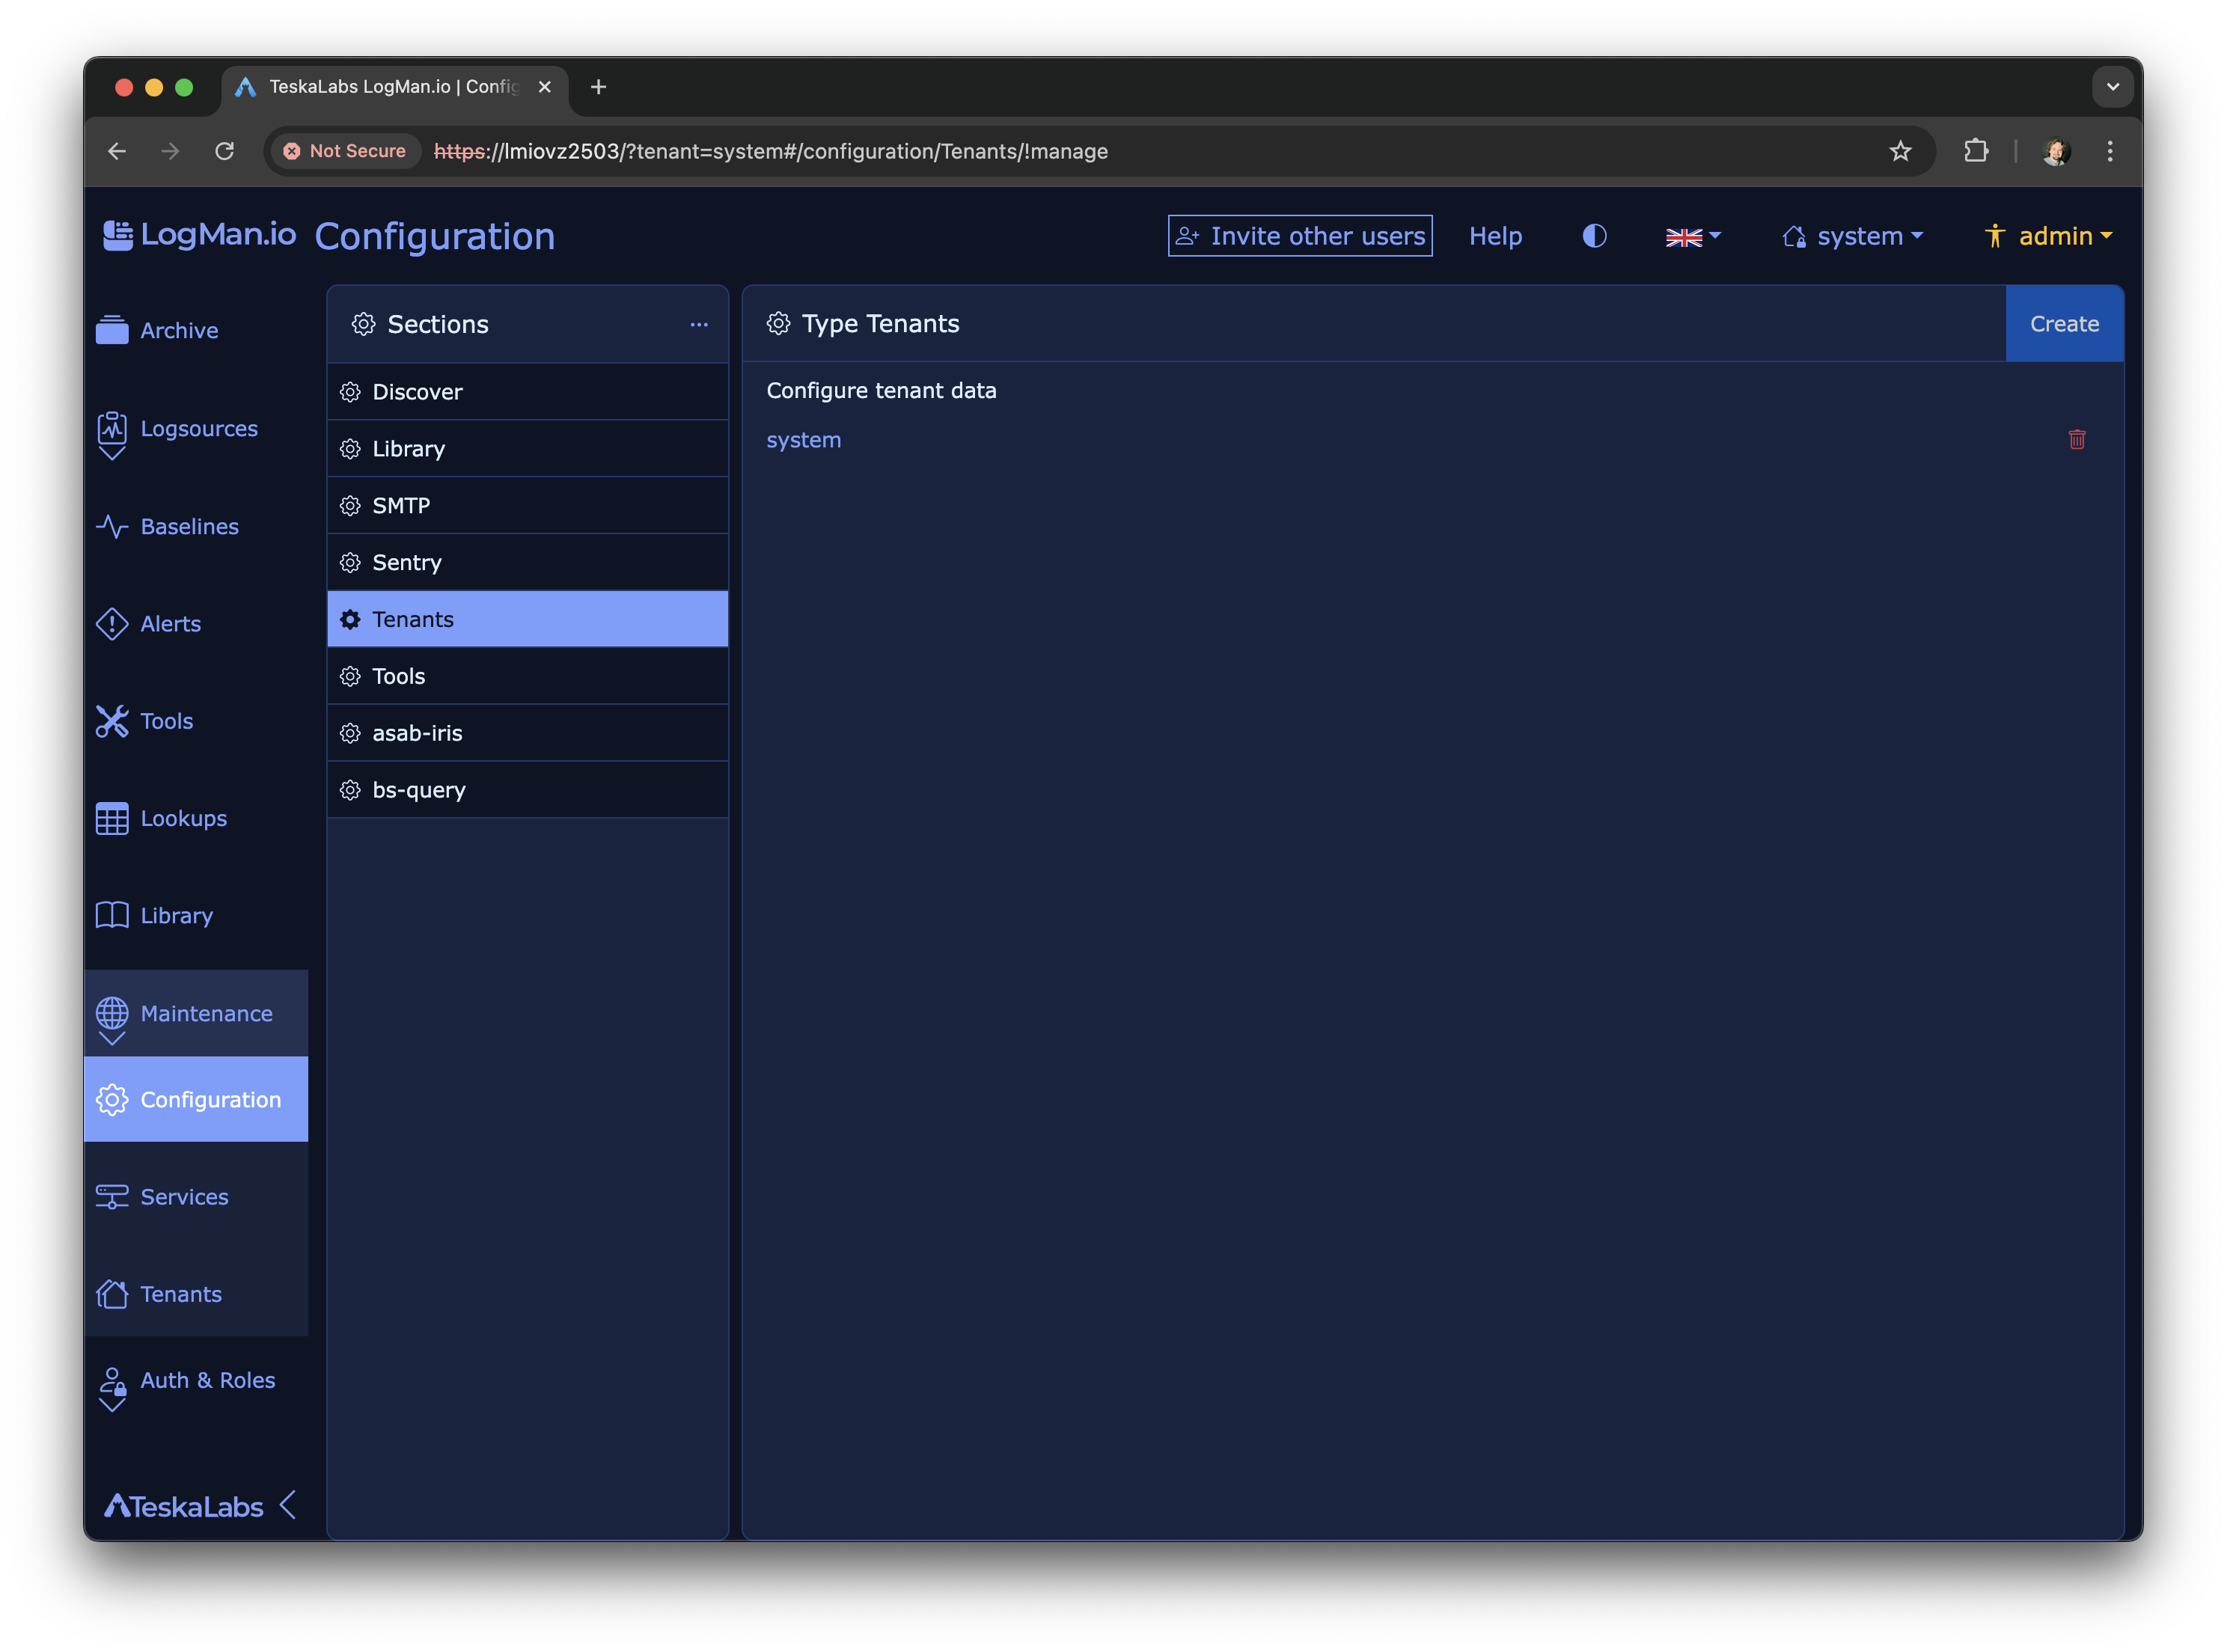
- Tenants
- The Tools page
Warning
Configuration files have a significant impact on the way TeskaLabs LogMan.io works. If you need help with your UI configuration, contact Support.
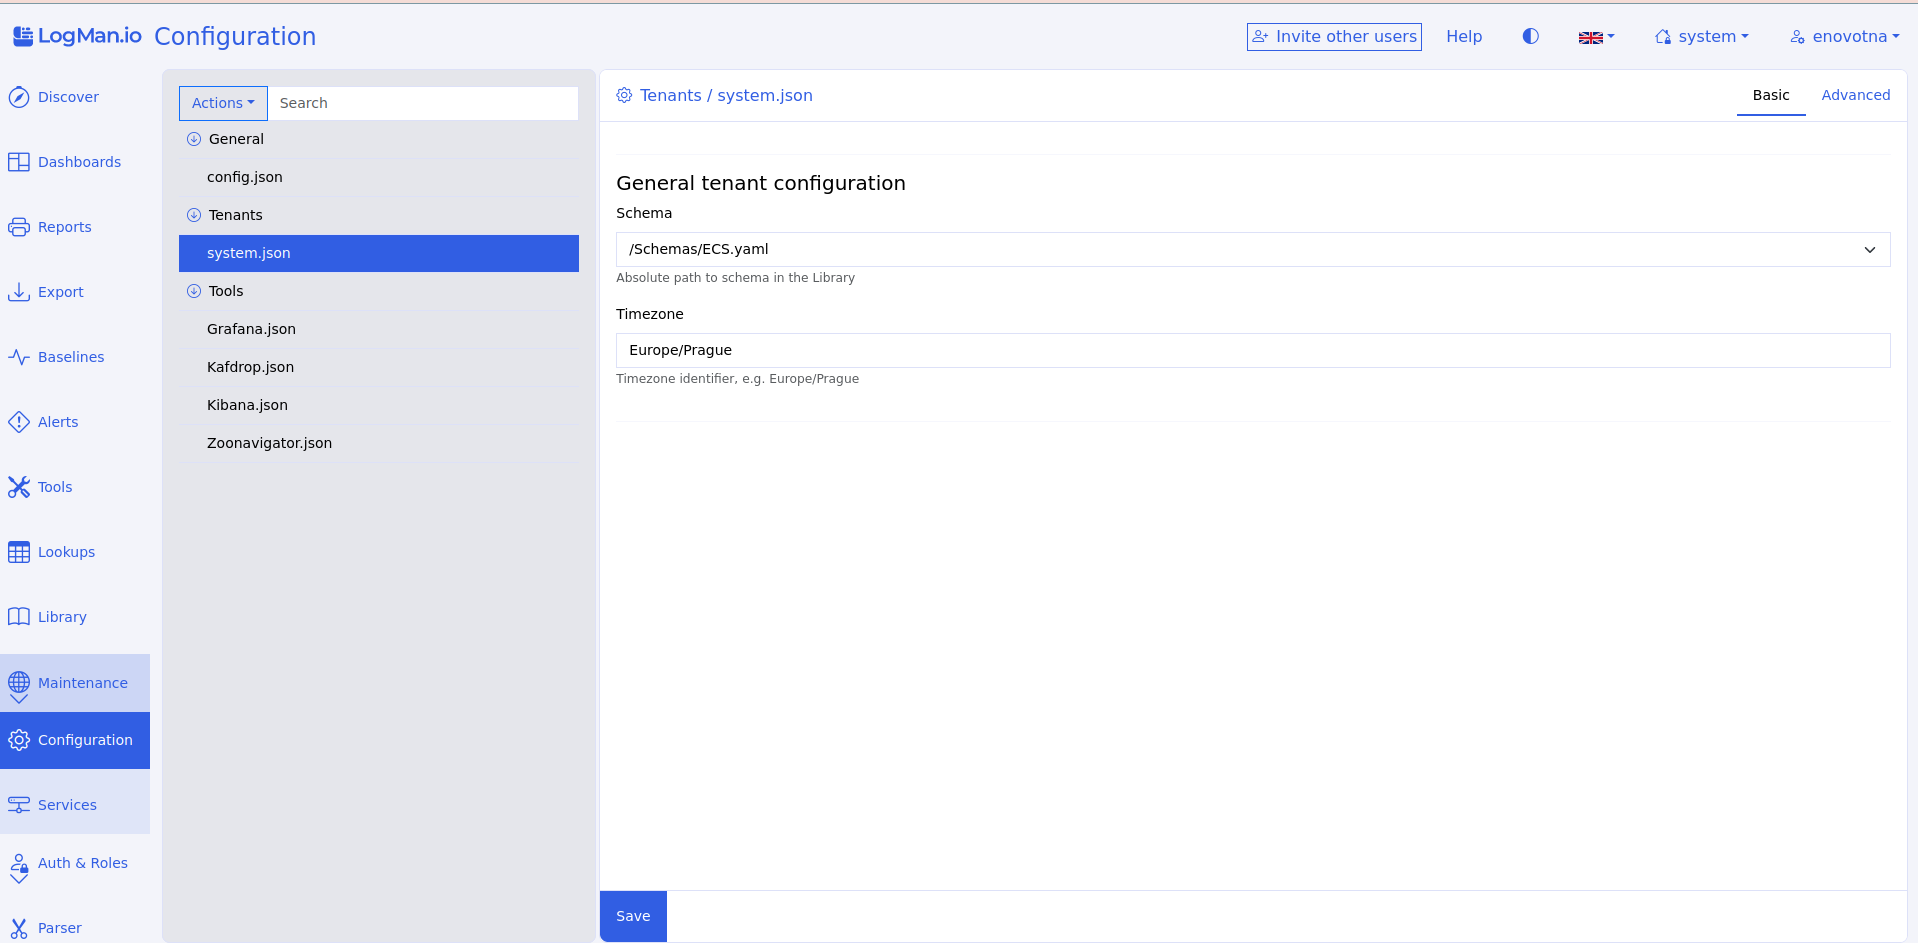
Basic and Advanced modes
You can switch between Basic and Advanced mode for configuration files.
Basic has fillable fields. Advanced shows the file in JSON. To choose a mode, click Basic or Advanced in the upper right corner.
Editing a configuration file
To edit a configuration file, click on the file name, choose your preferred mode, and make the changes. The file is always editable - you don't have to click anything to begin editing. Remember to click Save when you're finished.
Services
Services shows you all of the services and microservices ("mini programs") that make up the infrastructure of TeskaLabs LogMan.io.
Warning
Since TeskaLabs LogMan.io is made of microservices, interfering with the microservices could have a significant impact on the performance of the program. If you need help with microservices, contact Support.
Viewing service details
To view a service's details, click the arrow to the left of the service name.
Auth: Controlling user access
Administrator feature
Auth is an administrator feature. It has a significant impact on the people using TeskaLabs LogMan.io. Some users don't have access to the Auth pages.
The Auth (authorization) section includes all the controls administrators need to manage users and tenants.
Credentials
Credentials are users. From the Credentials screen, you can see:
- Name: The username that someone uses to log in
- Tenants: The tenants this user has access to
- Roles: The set of permissions this user has (see Roles)
Creating new credentials
1. To create a new user, click Create new credentials.
2. In the Create tab, enter a username. If you want to send the person an email inviting them to reset their password, enter their email address and check Send instructions to set password.
3. Click Create credentials.
The new credentials appear in the Credentials list. If you checked Send instructions to set password, the new user should recieve an email.
Editing credentials
To edit a credential, click on a username, and click Edit in the section you want to change. Remember to click Save to save your changes, or click Cancel to exit the editor.
Tenants
A tenant is one entity collecting data from a group of sources. Each tenant has an isolated space to collect and manage its data. (Every tenant's data is completely separated from all other tenants' data in the UI.) One deployment of TeskaLabs LogMan.io can handle many tenants (mutlitenancy).
As a user, your company might be just one tenant, or you might have different tenants for different departments. If you're a distributor, each of your clients has at least one tenant.
One tenant can be accessible by multiple users, and users can have access to multiple tenants. You can control which users can access which tenants by assigning credentials to tentants or vice-versa.
Resources
Resources are the most basic unit of authorization. They are single and specific access permissions.
Examples:
- Being able to access dashboards from a certain data source
- Being able to delete tenants
- Being able to make changes in the Library
Roles
A role is a container for resources. You can create a role to include any combination of resources, so a role is a set of permissions.
Clients
Clients are additonal applications that are accessing TeskaLabs LogMan.io to support its functioning.
Warning
Removing a client could interrupt essential program functions.
Sessions
Sessions are active login periods currently running.
Ways to end a session:
- Click on the red X on the session's line on the Sessions page.
- Click on the session's name, then click Terminate session
- To terminate all sessions (logging all users out), click Terminate all on the Sessions page.
Tip
The Auth module uses TeskaLabs SeaCat Auth. To learn more, you can read its documentation or take a look at its repository on GitHub.
Data tables
Several LogMan.io features use data tables to display lists. We are working continuously to extend the capabilities of data tables across the product.
Feature pages that use data tables include Exports, Baselines, Alerts, Lookups, Services maintenance, Collectors, and Auth modules such as Credentials, Tenants, etc.
Sorting
Sorting by a single column
You can sort data by any column with a sorting icon beside the column name.
To sort alphanumerically by a column, click the two-arrow icon beside the column name.
An arrow pointing down indicates sorting in alphanumeric order, descending.
An arrow pointing up indicates that the data is sorted in alphanumeric order, ascending.
Sorting by multiple columns
To sort alphanumerically by multiple columns, hold shift while you click on the sort icons.
Items per page
To change the number of items displayed per page:
- Click the number beside Items per page near the bottom of the screen.
- Select the number. The page automatically reloads.
Alternatively, you can customize the number of items per page using the URL.
The URL includes i= followed by a number.
To change the number of itmes per page, change that number, and press enter or return.
For exmaple, i=7 displays 7 items per page.
Specialized filtering
Some features, such as Alerts, allow for specialized filtering. Here, for example, you can filter for specific values from the fields Type, Severity, and Status.
Analyst Manual
Analyst Manual
The Analyst Manual
Cybersecurity and data analysts use the Analyst Manual to:
- Query data
- Create cybersecurity detections
- Create data visualizations
- Use and create other analytical tools
To learn how to use the TeskaLabs LogMan.io web app, visit the User Manual. For information about setup and installation, see the Administration Manual and the Reference guide.
Quick start
- Queries: Writing queries to find and filter data
- Dashboards: Designing visualizations for data summaries and patterns
- Detections: Creating custom detections for activity and patterns
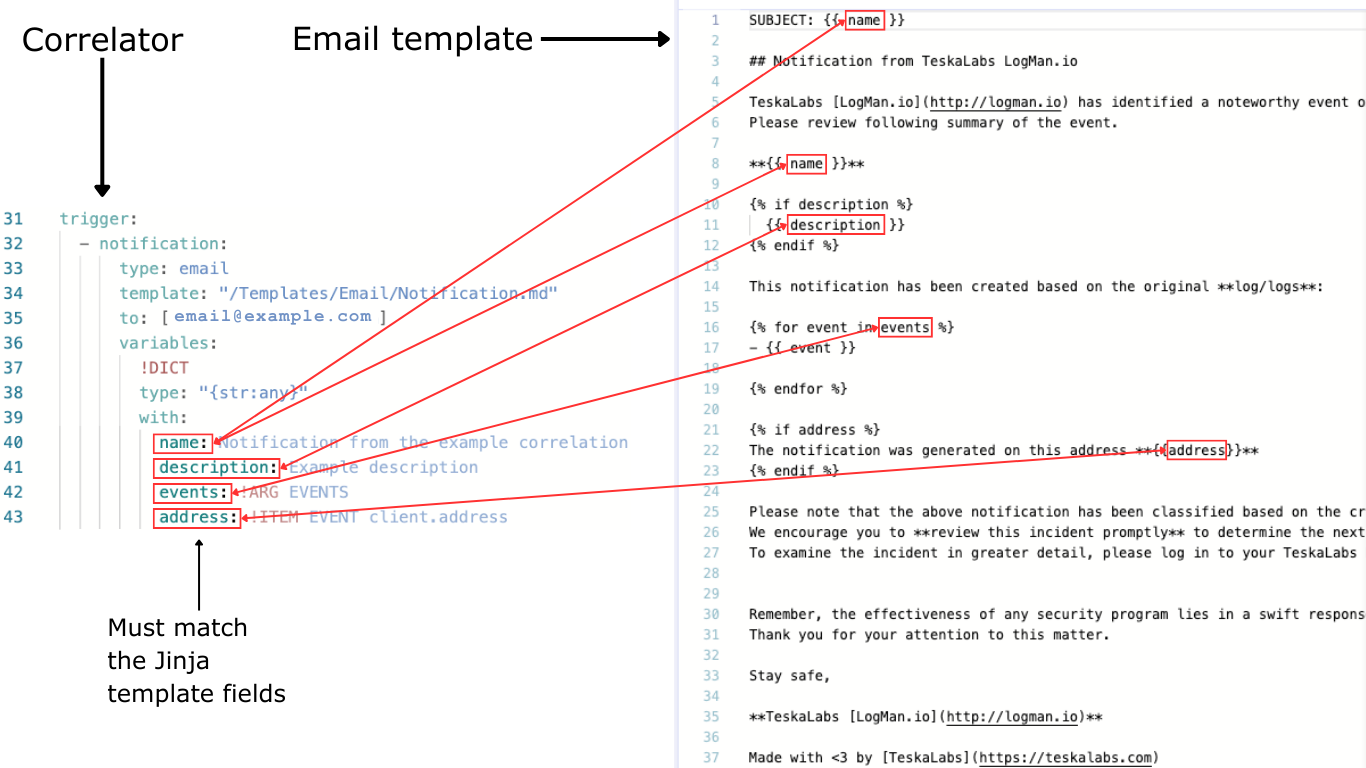
- Notifications: Sending messages via email from detections or alerts
Using Lucene Query Syntax
If you're storing data in Elasticsearch, you need to use Lucene Query Syntax to query data in TeskaLabs LogMan.io.
These are some quick tips for using Lucene Query Syntax, but you can also see the full documentation on the Elasticsearch website, or visit this tutorial.
You might use Lucene Query Syntax when creating dashboards, filtering data in dashboards, and when searching for logs in Discover.
Basic query expressions
Search for the field message with any value:
message:*
Search for the value delivered in the field message:
message:delivered
Search for the phrase not delivered in the field message:
message:"not delivered"
Search for any value in the field message, but NOT the value delivered:
message:* -message:delivered
Search for the text delivered anywhere in the value in the field message:
message:delivered*
message:delivered
message:not delivered
message:delivered with delay
Note
This query would not return the same results if the specified text (delivered in this example) was only part of a word or number, not separated by spaces or periods. Therefore, the query message:eliv, for example, would not return these results.
Search for the range of values 1 to 1000 in the field user.id:
user.id:[1 TO 1000]
Search for the open range of values 1 and higher in the field user.id:
user.id:[1 TO *]
Combining query expressions
Use boolean operators to combine expressions:
AND - combines criteria
OR - at least one of the criteria must be met
Using parentheses
Use parentheses when multiple items need to be grouped together to form an expression.
Examples of grouped expressions:
Search for logs from the dataset security, either with an IP address containing 123.456 and a message of failed login, or with an event action as deny and a delay greater than 10:
event.dataset:security AND (ip.address:123.456* AND message:"failed login") OR
(event.action:deny AND delay:[10 TO *])
Search a library's database for a book written by either Karel Čapek or Lucie Lukačovičová that has been translated to English, or a book in English that is at least 300 pages and in the genre science fiction:
language:English AND (author:"Karel Čapek" OR author:"Lucie Lukačovičová") OR
(page.count:[300 TO *] AND genre:"science fiction")
Dashboards
Dashboards are visualizations of incoming log data. While TeskaLabs LogMan.io comes with a library of preset dashboards, you can also create your own. View preset dashboards in the LogMan.io web app in Dashboards.
In order to create a dashboard, you need to write or copy a dashboard file in the Library.
Creating a dashboard file
Write dashboards in JSON.
Creating a blank dashboard
- In TeskaLabs LogMan.io, go to the Library.
- Click Dashboards.
- Click Create new item in Dashboards.
- Name the item, and click Create. If the new item doesn't appear immediately, refresh the page.
Copying an existing dashboard
- In TeskaLabs LogMan.io, go to the Library.
- Click Dashboards.
- Click on the item you want to duplicate, then click the icon near the top. Click Copy.
- Choose a new name for the item, and click Copy. If the new item doesn't appear immediately, refresh the page.
Dashboard structure
Write dashboards in JSON, and be aware that they're case-sensitive.
Dashboards have two parts:
- The dashboard base: A query bar, time selector, refresh button, and options button
- Widgets: The visualizations (chart, graph, list, etc.)
Dashboard base
Include this section exactly as-is to include the query bar, time selector, refresh button, and options.
{
    "Prompts": {
        "dateRangePicker": true,
        "filterInput": true,
        "submitButton": true
Widgets
Widgets are made of datasource and widget pairs. When you write a widget, need to include both a datasource section and a widget section.
JSON formatting tips:
- Separate every
datasourceandwidgetsection by a brace and a comma},except for the final widget in the dashboard, which does not need a comma (see the full example) - End every line with a comma
,except the final item in a section
Widget positioning
Each widget has layout lines, which dictate the size and position of the widget. If you don't include layout lines when you write the widget, the dashboard generates them automatically.
- Include the layout lines with the suggested values from each widget template, OR don't include any layout lines. (If you don't include any layout lines, make sure the final item in each section does NOT end with a comma.)
- Go to Dashboards in LogMan.io and resize and move the widget.
- When you move the widget on the Dashboards page, the dashboard file in the Library automatically generates or adjusts the layout lines accordingly. If you're working in the dashboard file in the Library and repositioning the widgets in Dashboards at the same time, make sure to save and refresh both pages after making changes on either page.
The order of widgets in your dashboard file does not determine widget position, and the order does not change if you reposition the widgets in Dashboards.
Naming
We recommend agreeing on naming conventions for dashboards and widgets within your organization to avoid confusion.
matchPhrase filter
For Elasticsearch data sources, use Lucene query syntax for the matchPhrase value.
Colors
By default, pie chart and bar chart widgets use a blue color scheme. To change the color scheme, insert "color":"(color scheme)" directly before the layout lines.
- Blue: No extra lines necessary
- Purple:
"color":"sunset" - Yellow:
"color":"warning" - Red:
"color":"danger"
Troubleshooting JSON
If you get an error message about JSON formatting when trying to save the file:
- Follow the recommendation of the error message specifying what the JSON is "expecting" - it might mean that you're missing a required key-value pair, or the punctuation is incorrect.
- If you can't find the error, double-check that your formatting is consistent with other functional dashboards.
If your widget does not display correctly:
- Make sure the value of
datasourcematches in both the data source and widget sections. - Check for spelling errors or query structure issues in any fields referenced and in fields specified in the
matchphrasequery. - Check for any other typos or inconsistencies.
- Check that the log source you are referencing is connected.
Use these examples as guides. Click the icons to learn what each line means.
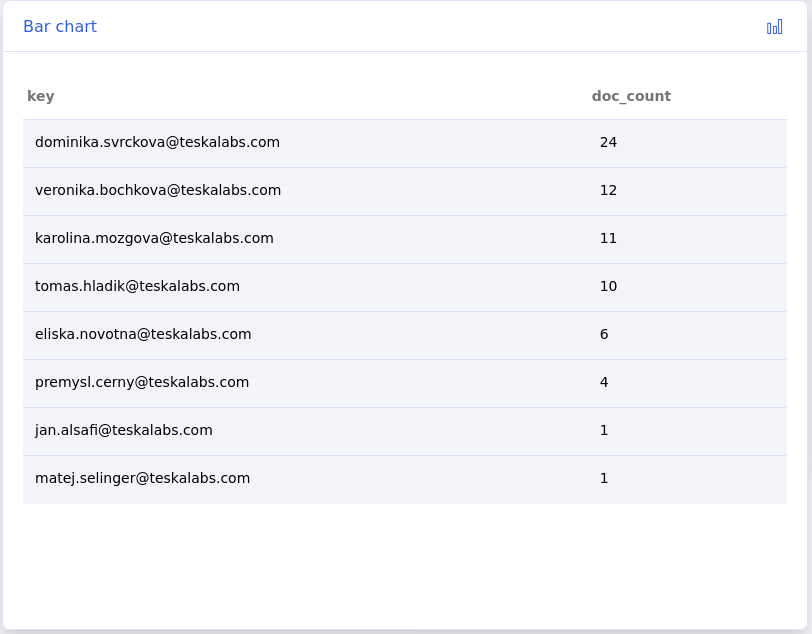
Bar charts
A bar chart displays values with vertical bars on an x and y-axis. The length of each bar is proportional to the data it represents.
Bar chart JSON example:
    "datasource:office365-email-aggregated": { #(1)
        "type": "elasticsearch", #(2)
        "datetimeField": "@timestamp", #(3)
        "specification": "lmio-{{ tenant }}-events*", #(4)
        "aggregateResult": true, #(5)
        "matchPhrase": "event.dataset:microsoft-office-365 AND event.action:MessageTrace" #(6)
    },
    "widget:office365-email-aggregated": { #(7)
        "datasource": "datasource:office365-email-aggregated", #(8)
        "title": "Sent and received emails", #(9)
        "type": "BarChart", #(10)
        "xaxis": "@timestamp", #(11)
        "yaxis": "o365.message.status", #(12)
        "ylabel": "Count", #(13)
        "table": true, #(14)
        "layout:w": 6, #(15)
        "layout:h": 4,
        "layout:x": 0,
        "layout:y": 0,
        "layout:moved": false,
        "layout:static": true,
        "layout:isResizable": false
    },
datasourcemarks the beginning of the data source section as well as the name of the data source. The name doesn't affect the dashboard's function, but you need to refer to the name correctly in the widget section.- The type of data source. If you're using Elasticsearch, the value is
"elasticsearch" - Indicates which field in the logs is the date and time field. For example, in Elasticsearch logs, which are parsed by the Elastic Common Schema (ECS), the date and time field is
@timestamp. - Refers to the index from which to get data in Elasticsearch. The value
lmio-{{ tenant}}-events*fits our index naming conventions in Elasticsearch, and{{ tenant }}is a placeholder for the active tenant. The asterisk*allows unspecified additional characters in the index name followingevents. The result: The widget displays data from the active tenant. aggregateResultset totrueperforms aggregation on the data before displaying it in the dashboard. In this case, the sent and received emails are being counted (sum calculated).- The query that filters for specific logs using Lucene query syntax. In this case, any data displayed in the dashboard must be from the Microsoft Office 365 dataset and have the value
MessageTracein the fieldevent.action. widgetmarks the beginning of the widget section as well as the name of the widget. The name doesn't affect the dashboard's function.- Refers to the data source section above which populates it. Make sure the value here matches the name of the corresponding data source exactly. (This is how the widget knows where to get data from.)
- Title of the widget that will display in the dashboard
- Type of widget
- The field from the logs whose values will be represented on the x axis
- The field from the logs whose values will be represented on the y axis
- Label for y axis that will display in the dashboard
- Setting
tabletotrueenables you to switch between chart view and table view on the widget in the dashboard. Choosingfalsedisables the chart-to-table feature. - See the note above about widget positioning for information about layout lines.
Bar chart widget rendered:
Bar chart template:
To create a bar chart widget, copy and paste this template into a dashboard file in the Library and fill in the values. Recommended layout values, the values specifying an Elasicsearch data source, and the value that organizes the bar chart by time are already filled in.
    "datasource:Name of datasource": {
        "type": "elasticsearch",
        "datetimeField": "@timestamp",
        "specification": "lmio-{{ tenant }}-events*",
        "aggregateResult": true,
        "matchPhrase": " "
    },
    "widget:Name of widget": {
        "datasource": "datasource:office365-email-aggregated",
        "title": "Widget display title",
        "type": "BarChart",
        "xaxis": "@timestamp",
        "yaxis": " ",
        "ylabel": " ",
        "table": true,
        "layout:w": 6,
        "layout:h": 4,
        "layout:x": 0,
        "layout:y": 0,
        "layout:moved": false,
        "layout:static": true,
        "layout:isResizable": false
    },
Pie charts
A pie chart is a circle divided into slices, in which each slice represents a percentage of the whole.
Pie chart JSON example:
    "datasource:office365-email-status": { #(1)
        "datetimeField": "@timestamp", #(2)
        "groupBy": "o365.message.status", #(3)
        "matchPhrase": "event.dataset:microsoft-office-365 AND event.action:MessageTrace", #(4)
        "specification": "lmio-{{ tenant }}-events*", #(5)
        "type": "elasticsearch", #(6)
        "size": 20 #(7)
    },
    "widget:office365-email-status": { #(8)
        "datasource": "datasource:office365-email-status", #(9)
        "title": "Received Emails Status", #(10)
        "type": "PieChart", #(11)
        "tooltip": true, #(12)
        "table": true, #(13)
        "layout:w": 6, #(14)
        "layout:h": 4,
        "layout:x": 6,
        "layout:y": 0,
        "layout:moved": false,
        "layout:static": true,
        "layout:isResizable": false
    },
datasourcemarks the beginning of the data source section, as well as the name of the data source. The name doesn't affect the dashboard's function, but you need to refer to the name correctly in the widget section.- Indicates which field in the logs is the date and time field. For example, in Elasticsearch logs, which are parsed by the Elastic Common Schema (ECS), the date and time field is
@timestamp. - The field whose values will represent each "slice" of the pie chart. In this example, the pie chart will separate logs by their message status. There will be a separate slice for each of Delivered, Expanded, Quarantined, etc. to show the percentage occurrence of each message status.
- The query that filters for specific logs. In this case, only data from logs from the Microsoft Office 365 dataset with the value
MessageTracein the fieldevent.actionwill be displayed. - Refers to the index from which to get data in Elasticsearch. The value
lmio-{{ tenant}}-events*fits our index naming conventions in Elasticsearch, and{{ tenant }}is a placeholder for the active tenant. The asterisk*allows unspecified additional characters in the index name followingevents. The result: The widget displays data from the active tenant. - The type of data source. If you're using Elasticsearch, the value is
"elasticsearch" - How many values you want to display. Since this pie chart is showing the statuses of received emails, a
sizeof 20 displays the top 20 status types. (The pie chart can have a maximum of 20 slices.) widgetmarks the beginning of the widget section as well as the name of the widget. The name doesn't affect the dashboard's function.- Refers to the data source section above which populates it. Make sure the value here matches the name of the corresponding data source exactly. (This is how the widget knows where to get data from.)
- Title of the widget that will display in the dashboard
- Type of widget
- If
tooltipis set totrue: When you hover over each slice of the pie chart in the dashboard, a small informational window with the count of values in the slice pops up at your cursor. Iftooltipis set tofalse: The count window appears in the top left corner of the widget. - Setting
tabletotrueenables you to switch between chart view and table view on the widget in the dashboard. Choosingfalsedisables the chart-to-table feature. - See the note above about widget positioning for information about layout lines.
Pie chart template
To create a pie chart widget, copy and paste this template into a dashboard file in the Library and fill in the values. Recommended values as well as the values specifying an Elasicsearch data source are already filled in.
    "datasource:Name of data source": {
        "datetimeField": "@timestamp",
        "groupBy": " ",
        "matchPhrase": " ",
        "specification": "lmio-{{ tenant }}-events*",
        "type": "elasticsearch",
        "size": 20
    },
    "widget:Name of widget": {
        "datasource": "datasource:Name of data source",
        "title": "Widget display title",
        "type": "PieChart",
        "tooltip": true,
        "table": true,
        "layout:w": 6,
        "layout:h": 4,
        "layout:x": 0,
        "layout:y": 0,
        "layout:moved": false,
        "layout:static": true,
        "layout:isResizable": false
    },
Tables
A table displays text and numeric values from data fields that you specify.
Table widget example
    "datasource:office365-email-failed-or-quarantined": { #(1)
        "type": "elasticsearch", #(2)
        "datetimeField": "@timestamp", #(3)
        "specification": "lmio-{{ tenant }}-events*", #(4)
        "size": 100, #(5)
        "matchPhrase": "event.dataset:microsoft-office-365 AND event.action:MessageTrace AND o365.message.status:(Failed OR Quarantined)" #(6)
    },
    "widget:office365-email-failed-or-quarantined": { #(7)
        "datasource": "datasource:office365-email-failed-or-quarantined", #(8)
        "field:1": "@timestamp", #(9)
        "field:2": "o365.message.status",
        "field:3": "sender.address",
        "field:4": "recipient.address",
        "field:5": "o365.message.subject",
        "title": "Failed or quarantined emails", #(10)
        "type": "Table", #(11)
        "dataPerPage": 9, #(12)
        "layout:w": 12, #(13)
        "layout:h": 4,
        "layout:x": 0,
        "layout:y": 0,
        "layout:moved": false,
        "layout:static": true,
        "layout:isResizable": false
    }
datasourcemarks the beginning of the data source section, as well as the name of the data source. The name doesn't affect the dashboard's function, but you need to refer to the name correctly in the widget section.- The type of data source. If you're using Elasticsearch, the value is
"elasticsearch" - Indicates which field in the logs is the date and time field. For example, in Elasticsearch logs, which are parsed by the Elastic Common Schema (ECS), the date and time field is
@timestamp. - Refers to the index from which to get data in Elasticsearch. The value
lmio-{{ tenant}}-events*fits our index naming conventions in Elasticsearch, and{{ tenant }}is a placeholder for the active tenant. The asterisk*allows unspecified additional characters in the index name followingevents. The result: The widget displays data from the active tenant. - How many values you want to display. This table will have a maximum of 100 rows. You can set rows per page in
dataPerPagebelow. - The query that filters for specific logs using Lucene query syntax. In this case, the widget displays data only from logs from the Microsoft Office 365 dataset with the value
MessageTracein the fieldevent.actionand a message status ofFailedorQuarantined. widgetmarks the beginning of the widget section as well as the name of the widget. The name doesn't affect the dashboard's function.- Refers to the data source section above which populates it. Make sure the value here matches the name of the corresponding data source exactly. (This is how the widget knows where to get data from.)
- Each field is a column that will display in the table in the dashboard. In this example table of failed or quarantied emails, the table would display the timestamp, message status, sender address, recipient address, and the email subject for each log (which represents each email). Use as many fields as you want.
- Title of the widget that will display in the dashboard
- Type of widget
- The number of items displayed per page (at once) in the table
- See the note above about widget positioning for information about layout lines.
Table widget rendered:
Table widget template:
To create a table widget, copy and paste this template into a dashboard file in the Library and fill in the values. Recommended values as well as the values specifying an Elasicsearch data source are already filled in.
    "datasource:Name of datasource": {
        "type": "elasticsearch",
        "datetimeField": "@timestamp",
        "specification": "lmio-{{ tenant }}-events*",
        "size": 100,
        "matchPhrase": " "
    },
    "widget:Name of widget": {
        "datasource": "Name of datasource",
        "field:1": "@timestamp",
        "field:2": " ",
        "field:3": " ",
        "field:4": " ",
        "field:5": " ",
        "title": "Widget title",
        "type": "Table",
        "dataPerPage": 9,
        "layout:w": 12,
        "layout:h": 4,
        "layout:x": 0,
        "layout:y": 0,
        "layout:moved": false,
        "layout:static": true,
        "layout:isResizable": false
    }
Single values
A value widget displays the most recent single value from the data field you specify.
    "datasource:microsoft-exchange1": { #(1)
        "datetimeField": "@timestamp", #(2)
        "matchPhrase": "event.dataset:microsoft-exchange AND email.from.address:* AND email.to.address:*", #(3)
        "specification": "lmio-{{ tenant }}-events*", #(4)
        "type": "elasticsearch", #(5)
        "size": 1 #(6)
    },
    "widget:fortigate1": { #(7)
        "datasource": "datasource:microsoft-exchange1", #(8)
        "field": "email.from.address", #(9)
        "title": "Last Active User", #(10)
        "type": "Value", #(11)
        "layout:w": 4, #(12)
        "layout:h": 1,
        "layout:x": 0,
        "layout:y": 0,
        "layout:moved": false,
        "layout:static": true,
        "layout:isResizable": false
    }
datasourcemarks the beginning of the data source section, as well as the name of the data source. The name doesn't affect the dashboard's function, but you need to refer to the name correctly in the widget section.- Indicates which field in the logs is the date and time field. For example, in Elasticsearch logs, which are parsed by the Elastic Common Schema (ECS), the date and time field is
@timestamp. - The query that filters for specific logs using Lucene query syntax. In this case, the widget displays data only from logs from the Microsoft Exchange dataset with ANY value (
*) in theemail.from.addressandemail.to.addressfields. - Refers to the index from which to get data in Elasticsearch. The value
lmio-{{ tenant}}-events*fits our index naming conventions in Elasticsearch, and{{ tenant }}is a placeholder for the active tenant. The asterisk*allows unspecified additional characters in the index name followingevents. The result: The widget displays data from the active tenant. - The type of data source. If you're using Elasticsearch, the value is
"elasticsearch" - How many values you want to display. Since a value widget only displays a single value, the
sizeis 1. widgetmarks the beginning of the widget section as well as the name of the widget. The name doesn't affect the dashboard's function.- Refers to the data source section above which populates it. Make sure the value here matches the name of the corresponding data source exactly. (This is how the widget knows where to get data from.)
- Refers to the field (from the latest log) from which the value will be displayed.
- Title of the widget that will display in the dashboard
- Type of widget. The value type displays a single value.
- See the note above about widget positioning for information about layout lines.
Value widget rendered:
Value widget template:
To create a value widget, copy and paste this template into a dashboard file in the Library and fill in the values. Recommended values as well as the values specifying an Elasicsearch data source are already filled in.
    "datasource:Name of datasource": {
        "datetimeField": "@timestamp",
        "matchPhrase": " ",
        "specification": "lmio-{{ tenant }}-events*",
        "type": "elasticsearch",
        "size": 1
    },
    "widget:Name of widget": {
        "datasource": "datasource:Name of datasource",
        "field": " ",
        "title": "Widget title",
        "type": "Value",
        "layout:w": 4,
        "layout:h": 1,
        "layout:x": 0,
        "layout:y": 0,
        "layout:moved": false,
        "layout:static": true,
        "layout:isResizable": false
    }
Dashboard example
This example is structured correctly:
{
    "Prompts": {
        "dateRangePicker": true,
        "filterInput": true,
        "submitButton": true
    },
    "datasource:access-log-combined HTTP Response": {
        "type": "elasticsearch",
        "datetimeField": "@timestamp",
        "specification": "lmio-default-events*",
        "size": 20,
        "groupBy": "http.response.status_code",
        "matchPhrase": "event.dataset: access-log-combined AND http.response.status_code:*"
    },
    "widget:access-log-combined HTTP Response": {
        "datasource": "datasource:access-log-combined HTTP Response",
        "title": "HTTP status codes",
        "type": "PieChart",
        "color": "warning",
        "useGradientColors": true,
        "table": true,
        "tooltip": true,
        "layout:w": 6,
        "layout:h": 5,
        "layout:x": 6,
        "layout:y": 0,
        "layout:moved": false,
        "layout:static": true,
        "layout:isResizable": false
    },
    "datasource:access-log-combined Activity": {
        "type": "elasticsearch",
        "datetimeField": "@timestamp",
        "specification": "lmio-default-events*",
        "matchPhrase": "event.dataset:access-log-combined AND http.response.status_code:*",
        "aggregateResult": true
    },
    "widget:access-log-combined Activity": {
        "datasource": "datasource:access-log-combined Activity",
        "title": "Activity",
        "type": "BarChart",
        "table": true,
        "xaxis": "@timestamp",
        "ylabel": "HTTP requests",
        "yaxis": "http.response.status_code",
        "color": "sunset",
        "layout:w": 6,
        "layout:h": 4,
        "layout:x": 0,
        "layout:y": 1,
        "layout:moved": false,
        "layout:static": true,
        "layout:isResizable": false
    },
    "datasource:Access-log-combined Last_http": {
        "datetimeField": "@timestamp",
        "matchPhrase": "event.dataset:access-log-combined AND http.response.status_code:*",
        "specification": "lmio-default-events*",
        "type": "elasticsearch",
        "size": 1000
    },
    "widget:Access-log-combined Last_http": {
        "datasource": "datasource:Access-log-combined Last_http",
        "field": "http.response.status_code",
        "title": "Last HTTP status code",
        "type": "Value",
        "layout:w": 6,
        "layout:h": 1,
        "layout:x": 0,
        "layout:y": 0,
        "layout:moved": false,
        "layout:static": true,
        "layout:isResizable": false
    }
}
Note: The data is arbitrary. This example is meant only to help you format your dashboards correctly.
Dashboard rendered:
Parsing
Parsing
Parsing is the process of analyzing the original log (which is typically in single/multiple-line string, JSON, or XML format) and transforming it into a list of key-value pairs that describe the log data (such as when the original event happened, the priority and severity of the log, information about the process that created the log, etc).
Every log that enters your TeskaLabs LogMan.io system needs to be parsed. The LogMan.io Parsec microservice is responsible for parsing logs. The Parsec needs parsers, which are sets of declarations (YAML files) to know how to parse each type of log. LogMan.io comes with the LogMan.io Common Library, which has many parsers already created for many common log types. However, if you need to create your own parsers, understanding parsing key terms, learning about declarations, and using the parsing tutorial can help.
Basic parsing example
Parsing takes a raw log, such as this:
<30>2023:12:04-15:33:59 hostname3 ulogd[1620]: id="2001" severity="info" sys="SecureNet" sub="packetfilter" name="Packet dropped" action="drop" fwrule="60002" initf="eth2.3009" outitf="eth6" srcmac="e0:63:da:73:bb:3e" dstmac="7c:5a:1c:4c:da:0a" srcip="172.60.91.60" dstip="192.168.99.121" proto="17" length="168" tos="0x00" prec="0x00" ttl="63" srcport="47100" dstport="12017"
@timestamp: 2023-12-04 15:33:59.033
destination.ip: 192.168.99.121
destination.mac: 7c:5a:1c:4c:da:0a
destination.port: 12017
device.model.identifier: SG230
dns.answers.ttl 63
event.action: Packet dropped
event.created: 2023-12-04 15:33:59.033
event.dataset: sophos
event.id: 2001
event.ingested: 2023-12-04 15:39:10.039
event.original: <30>2023:12:04-15:33:59 hostname3 ulogd[1620]: id="2001" severity="info" sys="SecureNet" sub="packetfilter" name="Packet dropped" action="drop" fwrule="60002" initf="eth2.3009" outitf="eth6" srcmac="e0:63:da:73:bb:3e" dstmac="7c:5a:1c:4c:da:0a" srcip="172.60.91.60" dstip="192.168.99.121" proto="17" length="168" tos="0x00" prec="0x00" ttl="63" srcport="47100" dstport="12017"
host.hostname: hostname3
lmio.event.source.id: hostname3
lmio.parsing: parsec
lmio.source: mirage
log.syslog.facility.code: 3
log.syslog.facility.name: daemon
log.syslog.priority: 30
log.syslog.severity.code: 6
log.syslog.severity.name: information
message id="2001" severity="info" sys="SecureNet" sub="packetfilter" name="Packet dropped" action="drop" fwrule="60002" initf="eth2.3009" outitf="eth6" srcmac="e0:63:da:73:bb:3e" dstmac="7c:5a:1c:4c:da:0a" srcip="172.60.91.60" dstip="192.168.99.121" proto="17" length="168" tos="0x00" prec="0x00" ttl="63" srcport="47100" dstport="12017"
observer.egress.interface.name: eth6
observer.ingress.interface.name: eth2.3009
process.name: ulogd
process.pid: 1620
sophos.action: drop
sophos.fw.rule.id: 60002
sophos.prec: 0x00
sophos.protocol: 17
sophos.sub: packetfilter
sophos.sys: SecureNet
sophos.tos: 0x00
source.bytes: 168
source.ip: 172.60.91.60
source.mac: e0:63:da:73:bb:3e
source.port: 47100
tags: lmio-parsec:v23.47
tenant: default
_id: e1a92529bab1f20e43ac8d6caf90aff49c782b3d6585e6f63ea7c9346c85a6f7
_prev_id: 10cc320c9796d024e8a6c7e90fd3ccaf31c661cf893b6633cb2868774c743e69
_s: DKNA
Parsing key terms
Important terms relevant to LogMan.io Parsec and the parsing process.
Event
A unit of data that moves through the parsing process is referred to as an event. An original event comes to LogMan.io Parsec as an input and is then parsed by the processors. If parsing succeeds, it produces a parsed event, and if parsing fails, it produces an error event.
Original event
An original event is the input that LogMan.io Parsec receives - in other words, an unparsed log. It can be represented by a raw (possibly encoded) string or structure in JSON or XML format.
Parsed event
A parsed event is the output from successful parsing, formatted as an unordered list of key-value pairs serialized into JSON structure. A parsed event always contains a unique ID, the original event, and typically the information about when the event was created by the source and received by Apache Kafka.
Error event
An error event is the output from unsuccessful parsing, formatted as an unordered list of key-value pairs serialized into JSON structure. It is produced when parsing, mapping, or enrichment fails, or when another exception occurs in LogMan.io Parsec. It always contains the original event, the information about when the event was unsuccessfully parsed, and the error message describing the reason why the process of parsing failed. Despite unsuccessful parsing, the error event will always be in JSON format, key-value pairs.
Library
Your TeskaLabs LogMan.io Library holds all of your declaration files (as well as many other types of files). You can edit your declaration files in your Library via Zookeeper.
Declarations
Declarations describe how the event will be transformed. Declarations are YAML files that LogMan.io Parsec can interpret to create declarative processors. There are three types of declarations in LogMan.io Parsec: parsers, enrichers, and mappings. See Declarations for more.
Parser
A parser is the type of declaration that takes the original event or a specific field of a partially-parsed event as input, analyzes its individual parts, and then stores them as key-value pairs to the event.
Mapping
A mapping declaration is the type of declaration that takes a partially parsed event as input, renames the field names, and eventually converts the data types. It works together with a schema (ECS, CEF). It also works as a filter to leave out data that is not needed in the final parsed event.
Enricher
An enricher is the type of declaration that supplement a partially parsed event with additional data.
Declarations
Declarations
Declarations describe how the event should be parsed. They are stored as YAML files in the Library. LogMan.io Parsec interprets these declarations and creates parsing processors.
There are three types of declarations:
- Parser declaration: A parser takes an original event or a specific field of a partially parsed event as input, analyzes its individual parts, and stores them as key-value pairs to the event.
- Mapping declaration: Mapping takes a partially parsed event as input, renames the field names, and eventually converts the data types. It works together with a schema (ECS, CEF).
- Enricher declaration: An enricher supplements a partially parsed event with extra data.
Data flow
A typical, recommended parsing sequence is a chain of declarations:
- The first main parser declaration begins the chain, and additional parsers (called sub-parsers) extract more detailed data from the fields created by the previous parser.
- Then, the (single) mapping declaration renames the keys of the parsed fields according to a schema and filters out fields that are not needed.
- Last, the enricher declaration supplements the event with additional data. While it's possible to use multiple enricher files, it's recommended to use just one.
Naming declarations
Important: Naming conventions
LogMan.io Parsec loads declarations alphabetically and creates the corresponding processors in the same order. Therefore, create the list of declaration files according to these rules:
-
Begin all declaration file names with a numbered prefix:
10_parser.yaml,20_parser_message.yaml, ...,90_enricher.yaml.It is recommended to "leave some space" in your numbering for future declarations in case you want to add a new declaration between two existing ones (e.g.,
25_new_parser.yaml). -
Include the type of declaration in file names:
20_parser_message.yamlrather than10_message.yaml. - Include the type of schema used in mapping file names:
40_mapping_ECS.yamlrather than40_mapping.yaml.
Example:
/Parsers/MyParser/:
    - 10_parser.yaml
    - 20_parser_username.yaml
    - 30_parser_message.yaml
    - 40_mapping_ECS.yaml
    - 50_enricher_lookup.yaml
    - 60_enricher.yaml
Parser declarations
A parser declaration takes an original event or a specific field of a partially parsed event as input, analyzes its individual parts, and stores them as key-value pairs to the event.
LogMan.io Parsec currently supports three types of parser declarations:
- JSON parser
- Windows Event parser
- Parsec parser
Declaration structure
In order to determine the type of the declaration, you need to specify a define section.
define:
    type: <declaration_type>
For a parser declaration, specify the type as parser.
JSON parser
A JSON parser is used for parsing events with a JSON structure.
define:
    name: JSON parser
    type: parser/json
This is a complete JSON parser and will parse events from a JSON structure, separating the fields into key-value pairs.
Warning
For now, LogMan.io Parsec does not support parsing of events with nested JSON format. For example, the event below cannot be parsed with JSON parser:
{
    "key": {
        "foo": 1,
        "bar": 2
    }
}
Windows Event parser
Windows Events parser is used for parsing events that are produced from Microsoft Windows. These events are in XML format.
define:
    name: Windows Events Parser
    type: parser/windows-event
This is a complete Windows Event parser and will parse events from Microsoft Windows, separating the fields into key-value pairs.
Parsec parser
A Parsec parser is used for parsing events in plain string format. It is based on SP-Lang Parsec expressions.
For parsing original events, use the following declaration:
define:
    name: My Parser
    type: parser/parsec

parse:
    !PARSE.KVLIST
        - ...
        - ...
        - ...
define:
    name: My Parser
    type: parser/parsec
    field: <custom_field>

parse:
    !PARSE.KVLIST
        - ...
        - ...
        - ...
When field is specified, parsing is applied on that field, otherwise it is applied on the original event. Therefore, it must be present in every sub-parser.
Examples of Parsec parser declarations
Example 1: Simple example
For the purpose of the example, let's say that we want to parse a collection of simple events:
Hello Miroslav from Prague!
Hi Kristýna from Pilsen.
{
    "name": "Miroslav",
    "city": "Prague"
}
{
    "name": "Kristýna",
    "city": "Pilsen"
}
define:
    type: parser/parsec

parse:
    !PARSE.KVLIST
        - !PARSE.UNTIL " "
        - name: !PARSE.UNTIL " "
        - !PARSE.EXACTLY "from "
        - city: !PARSE.LETTERS
Example 2: More complex example
For the purpose of this example, let's say that we want to parse a collection of simple events:
Process cleaning[123] finished with code 0.
Process log-rotation finished with code 1.
Process cleaning[657] started.
And we want the output in the following format:
{
    "process.name": "cleaning",
    "process.pid": 123,
    "event.action": "process-finished",
    "return.code": 0
}
{
    "process.name": "log-rotation",
    "event.action": "process-finished",
    "return.code": 1
}
{
    "process.name": "cleaning",
    "process.pid": 657,
    "event.action": "process-started",
}
Declaration will be the following:
define:
    type: parser/parsec

parse:
    !PARSE.KVLIST
        - !PARSE.UNTIL " "
        - !TRY
            - !PARSE.KVLIST
                - process.name: !PARSE.UNTIL "["
                - process.pid: !PARSE.UNTIL "]"
                - !PARSE.SPACE
            - !PARSE.KVLIST
                - process.name: !PARSE.UNTIL " "
        - !TRY
            - !PARSE.KVLIST
                - !PARSE.EXACTLY "started."
                - event.action: "process-started"
            - !PARSE.KVLIST
                - !PARSE.EXACTLY "finished with code "
                - event.action: "process-finished"
                - return.code: !PARSE.DIGITS
Example 3: Parsing syslog events
For the purpose of the example, let's say that we want to parse a simple event in syslog format:
<189> Sep 22 10:31:39 server-abc server-check[1234]: User "harry potter" logged in from 198.20.65.68
We would like the output in the following format:
{
    "PRI": 189,
    "timestamp": 1695421899,
    "server": "server-abc",
    "process.name": "server-check",
    "process.pid": 1234,
    "user": "harry potter",
    "action": "log-in",
    "ip": "198.20.65.68"
}
We will create two parsers. First parser will parse the syslog header and the second will parse the message.
define:
    name: Syslog parser
    type: parser/parsec

parse:
    !PARSE.KVLIST
        - !PARSE.EXACTLY "<"
        - PRI: !PARSE.DIGITS
        - !PARSE.EXACTLY ">"

        - timestamp: ...
        - server: !PARSE.UNTIL " "
        - process.name: !PARSE.UNTIL "["
        - process.pid: !PARSE.UNTIL "]"
        - !PARSE.EXACTLY ":"
        - message: !PARSE.CHARS
This parser
    define:
        type: parser/parsec
        field: message
        drop: yes

    parse:
        !PARSE.KVLIST
            - !PARSE.UNTIL " "
            - user: !PARSE.BETWEEN { what: '"' }
            - !PARSE.EXACTLY " "
            - !PARSE.UNTIL " "
            - !PARSE.UNTIL " "
            - !PARSE.UNTIL " "
            - ip: !PARSE.CHARS
Mapping declarations
After all declared fields are obtained from parsers, the fields typically have to be renamed according to some schema (ECS, CEF) in a process called mapping.
Why is mapping necessary?
To store event data in Elasticsearch, it's essential that the field names in the logs align with the Elastic Common Schema (ECS), a standardized, open-source collection of field names that are compatible with Elasticsearch. The mapping process renames the fields of the parsed logs according to this schema. Mapping ensures that logs from various sources have unified, consistent field names, which enables Elasticsearch to interpret them accurately.
Important
By default, mapping works as a filter. Make sure to include all fields you want in the parsed output in the mapping declaration. Any field not specified in mapping will be removed from the event.
Writing a mapping declaration
Write mapping delcarations in YAML. (Mapping declarations do not use SP-Lang expressions.)
define:
    type: parser/mapping
    schema: /Schemas/ECS.yaml

mapping:
    <original_key>: <new_key>
    <original_key>: <new_key>
    ...
Specify parser/mapping as the type in the define section. In the schema field, specify the filepath to the schema you're using. If you use Elasticsearch, use the Elastic Common Schema (ECS).
To rename they key and change the data type of the value:
mapping:
    <original_key>:
        field: <new_key>
        type: <new_type>
Find available data types here.
To rename the key without changing the data type of the value:
mapping:
    <original_key>: <new_key>
Example
Example
For the purpose of the example, let's say that we want to parse a simple event in JSON format:
{
    "act": "user login",
    "ip": "178.2.1.20",
    "usr": "harry_potter",
    "id": "6514-abb6-a5f2"
}
and we would like the final output look like this:
{
    "event.action": "user login",
    "source.ip": "178.2.1.20",
    "user.name": "harry_potter"
}
Notice that the key names in the original event differ from the key names in the desired output.
For the initial parser declaration in this case, we can use a simple JSON parser:
define:
type: parser/json
This parser will create a list of key-value pairs that are exactly the same as the original ones.
To change the names of individual fields, we create this mapping delcaration file, 20_mapping_ECS.yaml, in which we describe what fields to map and how:
---
define:
type: parser/mapping  # determine the type of declaration
schema: /Schemas/ECS.yaml  # which schema is applied

mapping:
    act: 'event.action'
    ip: 'source.ip'
    usr: 'user.name'
This declaration will produce the desired output. (Data types have not been changed.)
Enricher declarations
Enrichers supplement the parsed event with extra data.
An enricher can:
- Create a new field in the event.
- Transform a field's values in some way (changing a letter case, performing a calculation, etc).
Enrichers are most commonly used to:
- Specify the dataset where the logs will be stored in ElasticSearch (add the field
event.dataset). - Obtain facility and severity from the syslog priority field.
define:
    type: parsec/enricher

enrich:
    event.dataset: <dataset_name>
    new.field: <expression>
    ...
- Write enrichers in YAML.
- Specify
parsec/enricherin thedefinefield.
Example
The following example is enricher used for events in syslog format. Suppose you have parser for the events of the form:
<14>1 2023-05-03 15:06:12 server pid: Username 'HarryPotter' logged in.
{
    "log.syslog.priority": 14,
    "user.name": "HarryPotter"
}
You want to obtain syslog severity and facility, which are computed in the standard way:
(facility * 8) + severity = priority
You would also like to lower the name HarryPotter to harrypotter in order to unify the users across various log sources.
Therefore, you create an enricher:
define:
type: parsec/enricher

enrich:
    event.dataset: 'dataset_name'
    user.id: !LOWER { what: !GET {from: !ARG EVENT, what: user.name} }

    # facility and severity are computed from 'syslog.pri' in the standard way
    log.syslog.facility.code: !SHR
            what: !GET { from: !ARG EVENT, what: log.syslog.priority }
            by: 3
    log.syslog.severity.code: !AND [ !GET {from: !ARG EVENT, what: log.syslog.priority}, 7 ]
Parsing tutorial
The complete parsing process requires parser, mapping, and enricher declarations. This tutorial breaks down creating declarations step-by-step. Visit the LogMan.io Parsec documentation for more on the Parsec microservice.
Before you start
SP-Lang
Parsing declarations are written in TeskaLabs SP-Lang. For more details about parsing expressions, visit the SP-Lang documentation.
Declarations
For more information on specific types of declarations, see:
Sample logs
This example uses this set of logs collected from various Sophos SG230 devices:
<181>2023:01:12-13:08:45 asgmtx httpd: 212.158.149.81 - - [12/Jan/2023:13:08:45 +0100] "POST /webadmin.plx HTTP/1.1" 200 2000

<38>2023:01:12-13:09:09 asgmtx sshd[17112]: Failed password for root from 218.92.0.190 port 56745 ssh2

<38>2023:01:12-13:09:20 asgmtx sshd[16281]: Did not receive identification string from 218.92.0.190

<38>2023:01:12-13:09:20 asgmtx aua[2350]: id="3005" severity="warn" sys="System" sub="auth" name="Authentication failed" srcip="43.139.111.88" host="" user="login" caller="sshd" reason="DENIED"
These logs are using the syslog format described in RFC 5424.
Logs can be typically separated into two parts: the header and the body. The header is anything preceding the first colon after the timestamp. The body is the rest of the log.
Parsing strategy
The Parsec interprets each declaration alphabetically by name, so naming order matters. Within each declaration, the parsing process follows the order that you write the expressions in like steps.
A parsing sequence can include multiple parser declarations, and also needs a mapping declaration and an enricher declaration. In this case, create these declarations:
- First parser declaration: Parse the syslog headers
- Second parser declaration: Parse the body of the logs as the message.
- Mapping declaration: Rename fields
- Enricher declaration: Add metadata (such as the dataset name) and compute syslog facility and severity from priority
As per naming conventions, name these files:
- 10_parser_header.yaml
- 20_parser_message.yaml
- 30_mapping_ECS.yaml
- 40_enricher.yaml
Remember that declarations are interpreted in alphabetical order, in this case by the increasing numeric prefix. Use prefixes such as 10, 20, 30, etc. so you can add a new declaration between existing ones later without renaming all of files.
1. Parsing the header
This is the first parser declaration. The subsequent sections break down and explain each part of the declaration.
---
define:
    type: parser/parsec

parse:
    !PARSE.KVLIST

    # PRI part
    - '<'
    - PRI: !PARSE.DIGITS
    - '>'

    # Timestamp
    - TIMESTAMP: !PARSE.DATETIME
            - year: !PARSE.DIGITS  # year: 2023
            - ':'
            - month: !PARSE.MONTH { what: 'number' }  # month: 01
            - ':'
            - day: !PARSE.DIGITS # day: 12
            - '-'
            - hour: !PARSE.DIGITS # hour: 13
            - ':'
            - minute: !PARSE.DIGITS # minute: 08
            - ':'
            - second: !PARSE.DIGITS # second: 45
    - !PARSE.UNTIL ' '

    # Hostname and process
    - HOSTNAME: !PARSE.UNTIL ' '  # asgmtx
    - PROCESS: !PARSE.UNTIL ':'

    # Message
    - !PARSE.SPACES
    - MESSAGE: !PARSE.CHARS
Log headers
The syslog headers are in the format:
<PRI>TIMESTAMP HOSTNAME PROCESS.NAME[PROCESS.PID]:


Important: Log variance
Notice that PROCESS.PID in the square brackets is not present in the first log's header. To accomodate the discrepancy, the parser will need a way to handle the possibility of PROCESS.PID being either present or absent. This is addressed later in the tutorial.
Parsing the PRI
First, parse the PRI, which is enclosed by < and > characters, with no space in between.
How to parse <PRI>, as seen in the first parser declaration:
!PARSE.KVLIST
- !PARSE.EXACTLY { what: '<' }
- PRI: !PARSE.DIGITS
- !PARSE.EXACTLY { what: '>' }
Expressions used:
!PARSE.EXACTLY: Parsing the characters<and>!PARSE.DIGITS: Parsing the numbers (digits) of the PRI
!PARSE.EXACTLY shortcut
The !PARSE.EXACTLY expression has a syntactic shortcut because it is so commonly used. Instead of including the whole expression, PARSE.EXACTLY { what: '(character)' } can be shortened to '(character').
So, the above parser declaration can be shortened to:
!PARSE.KVLIST
- '<'
- PRI: !PARSE.DIGITS
- '>'
Parsing the timestamp
The unparsed timestamp format is:
yyyy:mm:dd-HH:MM:SS
2023:01:12-13:08:45
Parse the timestamp with the !PARSE.DATETIME expression.
As seen in the first parser declaration:
# 2023:01:12-13:08:45
- TIMESTAMP: !PARSE.DATETIME
        - year: !PARSE.DIGITS  # year: 2023
        - ':'
        - month: !PARSE.MONTH { what: 'number' }  # month: 01
        - ':'
        - day: !PARSE.DIGITS # day: 12
        - '-'
        - hour: !PARSE.DIGITS # hour: 13
        - ':'
        - minute: !PARSE.DIGITS # minute: 08
        - ':'
        - second: !PARSE.DIGITS # second: 45
- !PARSE.UNTIL { what: ' ', stop: after }
Parsing the month:
The !PARSE.MONTH expression requires you to specify the format of the month in the what parameter. The options are:
'number'(used in this case) which accepts numbers 01-12'short'for shortened month names (JAN, FEB, etc.)'full'for full month names (JANUARY, FEBRUARY, etc.)
Parsing the space:
The space at the end of the timestamp also needs to be parsed. Using the !PARSE.UNTIL expression parses everything until the space character (' '), stopping after the space, as defined (stop: after).
!PARSE.UNTIL shortcuts and alternatives
!PARSE.UNTIL has the syntactic shortcut:
- !PARSE.UNTIL ' '
- !PARSE.UNTIL { what: ' ', stop: after }
Alternatively, you can choose an expression that specifically parses one or multiple spaces, respectively:
- !PARSE.SPACE
or
- !PARSE.SPACES
At this point, the sequence of characters <181>2023:01:12-13:08:45 (including the space at the end) is parsed.
Parsing the hostname and process
Next, parse the hostname and process: asgmtx sshd[17112]:.
Remember, the first log's header is different than the rest. For a solution that accommodates this difference, create a parser declaration and a subparser declaration.
As seen in the first parser declaration:
    # Hostname and process
    - HOSTNAME: !PARSE.UNTIL ' '  # asgmtx
    - PROCESS: !PARSE.UNTIL ':'

    # Message
    - !PARSE.SPACES
    - MESSAGE: !PARSE.CHARS
- Parse the hostname: To parse the hostname, use the
!PARSE.UNTILexpression to parse everything until the single character specified inside' ', which in this case is a space, and stops after that character, without including the character in the output. - Parse the process: Use
!PARSE.UNTILagain for parsing until:. After the colon ('), the header is parsed. - Parse the message: In this declaration, use
!PARSE.SPACESto parse all spaces between the header and the message. Then, store the rest of the event in theMESSAGEfield using the!PARSE.CHARSexpression, which in this case parses all of the rest of the characters in the log. You will use additional declarations to parse the parts of the message.
1.5. Parsing for log variance
To address the issue of the first log not having a process PID, you need a second parser declaration, a subparser. In the other logs, the process PID is enclosed in square brackets ([ ]).
Create a declaration called 15_parser_process.yaml. To accommodate the differences in the logs, create two "paths" or "branches" that the parser can use. The first branch will parse PROCESS.NAME, PROCESS.PID and :. The second branch will parse only PROCESS.NAME.
Why do I need two branches?
For three of the logs, the process PID is enclosed in square brackets ([ ]). Thus, the expression that isolates the PID begins parsing at a square bracket [. However, in the first log, the PID field is not present. If you try to parse the first log using the same expression, the parser will try to find a square bracket in that log and will keep searching regardless of the character [ not being present in the header.
The result would be that whatever is inside the square brackets is parsed as PID, which in this case would be nonsensical, and would disrupt the rest of the parsing process for that log.
The second declaration:
---
define:
    type: parser/parsec
    field: PROCESS
    error: continue

parse:
    !PARSE.KVLIST
    - !TRY
        - !PARSE.KVLIST
            - PROCESS.NAME: !PARSE.UNTIL '['
            - PROCESS.PID: !PARSE.UNTIL ']'
        - !PARSE.KVLIST
            - PROCESS.NAME: !PARSE.CHARS
To achieve this, construct two little parsers under the combinator !PARSE.KVLIST using the !TRY expression.
The !TRY expression
The !TRY expression allows you to nest a list of expressions under it. !TRY begins by attempting to use the first expression, and if that first expression is unusable for the log, the process continues with the second nested expression, and so on, until an expression succeeds.
Under the !TRY expression:
The first branch:
1. The expression parses PROCESS.NAME and PROCESS.PID, expecting the square brackets [ and ] to be present in the event. After these are parsed, it also parses the : character.
2. If the log does not contain a [ character, the expression !PARSE.UNTIL '[' fails, and in that case the whole !PARSE.KVLIST expression in the first branch fails.
The second branch:
3. The !TRY expression will continue with the next parser, which does not require the character [ to be present in the event. It simply parses everything before : and stops after it.
4. If this second expression fails, the log goes to OTHERS.
2. Parsing the message
Consider again the events:
<181>2023:01:12-13:08:45 asgmtx httpd: 212.158.149.81 - - [12/Jan/2023:13:08:45 +0100] "POST /webadmin.plx HTTP/1.1" 200 2000
<38>2023:01:12-13:09:09 asgmtx sshd[17112]: Failed password for root from 218.92.0.190 port 56745 ssh2
<38>2023:01:12-13:09:20 asgmtx sshd[16281]: Did not receive identification string from 218.92.0.190
<38>2023:01:12-13:09:20 asgmtx aua[2350]: id="3005" severity="warn" sys="System" sub="auth" name="Authentication failed" srcip="43.139.111.88" host="" user="login" caller="sshd" reason="DENIED"
There are three different types of messages, dependent on the process name.
httpd: Message is in a structured format. We can extract the data such as IPs and HTTP requests easily by using the standard parsing expressions.sshd: Message is a human-readable string. To extract the data such as host IPs and ports, hardcode these messages in the parser and skip the words that are relevant to humans but not relevant for automatic parsing.aua: Message consists of structured data in the form of key-value pairs. Extract them as they are and rename them in the mapping according to the Elasticsearch Common Schema.
For clarity, put each declaration into a separate YAML file and use the !INCLUDE expression for including them into one parser.
---
define:
  type: parser/parsec
  field: MESSAGE
  error: continue

parse:
    !MATCH
        what: !GET { from: !ARG EVENT, what: process.name, type: str }
        with:
            'httpd': !INCLUDE httpd.yaml
            'sshd': !INCLUDE sshd.yaml
            'aua': !INCLUDE aua.yaml
        else: !PARSE.KVLIST []
The !MATCH expression has three parameters. The what parameter specifies the field name, the value is matched with one of the cases specified in with dictionary. If match is successful, the corresponding expression will be executed, in this case one of !INCLUDE expressions. If none of the listed cases matches, the expression in else is executed. In this case, !PARSE.KVLIST is used with an empty list, which means nothing will be parsed from the message.
Parsing the structured message
First, look at the message from 'httpd' process.
212.158.149.81 - - [12/Jan/2023:13:08:45 +0100] "POST /webadmin.plx HTTP/1.1" 200 2000
Parse the IP address, the HTTP request method, the response status and the number of bytes requested to yield the output:
host.ip: '212.158.149.81'
http.request.method: 'POST'
http.response.status_code: '200'
http.response.body.bytes: '2000'
This is straightforward, assuming all the events will satisfy the same format as the one from the example:
!PARSE.KVLIST
  - host.ip: !PARSE.UNTIL ' '
  - !PARSE.UNTIL '"'
  - http.request.method: !PARSE.UNTIL ' '
  - !PARSE.UNTIL '"'
  - !PARSE.SPACE
  - http.response.status_code: !PARSE.DIGITS
  - !PARSE.SPACE
  - http.request.body.bytes: !PARSE.DIGITS
This case uses the ECS for naming. Alternatively, you can rename fields according to your needs in the mapping declaration.
Parsing the human-readable string
Let us continue with 'sshd' messages.
Failed password for root from 218.92.0.190 port 56745 ssh2
Did not receive identification string from 218.92.0.190
You can extract IP addresses from both events and the port from the first one. Additionally, you can store the condensed information about the event type in event.action field.
event.action: 'password-failed'
user.name: 'root'
source.ip: '218.92.0.190'
source.port: '56745'
event.action: 'id-string-not-received'
source.ip: '218.92.0.190'
To differentiate between these two messages, notice that each of them starts with a different prefix. You can take advantage of this and use !PARSE.TRIE expression.
!PARSE.TRIE
- 'Failed password for ': !PARSE.KVLIST
    - event.action: 'password-failed'
    - user.name: !PARSE.UNTIL ' '
    - 'from '
    - source.ip: !PARSE.UNTIL ' '
    - 'port '
    - source.port: !PARSE.DIGITS

- 'Did not receive identification string from ': !PARSE.KVLIST
    - event.action: 'id-string-not-received'
    - source.ip: !PARSE.CHARS
- '': !PARSE.KVLIST []
!PARSE.TRIE expression tries to match the incoming string with the listed prefixes and performs the corresponding expressions. The empty prefix '' is a fallback: if none of the listed prefixes match, the empty one is used.
Parsing key-value pairs
Finally, aua events have key-value pairs.
id="3005" severity="warn" sys="System" sub="auth" name="Authentication failed" srcip="43.139.111.88" host="" user="login" caller="sshd" reason="DENIED"
Desired output:
id: '3005'
severity: 'warn'
sys: 'System'
sub: 'auth'
name: 'Authentication failed'
srcip: '43.139.111.88'
host: ''
user: 'login'
caller: 'sshd'
reason: 'DENIED'
When encountering structured messages, you can use !PARSE.REPEAT together with !PARSE.KV.
The !PARSE.REPEAT expression performs the expression specified in what parameter multiple times. In this case, you want to repeat the steps until it is no longer possible:
- Parse everything until '=' character and use it as a key.
- Parse everything between '"' characters and assign that value to the key.
- Optionally, omit spaces before the next key begins.
For that, we create the following expression:
!PARSE.KVLIST
  - !PARSE.REPEAT
    what: !PARSE.KV
          - !PARSE.OPTIONAL { what: !PARSE.SPACE }
          - key: !PARSE.UNTIL '='
          - value: !PARSE.BETWEEN '"'
KV in !PARSE.KV stands for key-value. This expression takes a list of parsing expressions, including the keywords key and value.
3. Mapping declaration
Mapping renames the keys so that they correspond to the ECS (Elastic Common Schema).
---
define:
  type: parser/mapping
  schema: /Schemas/ECS.yaml

mapping:

  # 10_parser_header.yaml and 15_parser_process.yaml
  'PRI': 'log.syslog.priority'
  'TIMESTAMP': '@timestamp'
  'HOSTNAME': 'host.hostname'
  'PROCESS.NAME': 'process.name'
  'PROCESS.PID': 'process.pid'
  'MESSAGE': 'message'

  # 20_parser_message.yaml

  # httpd.yaml
  - 'host.ip': 'host.ip'
  - 'http.request.method': 'http.request.method'
  - 'http.response.status_code': 'http.response.status_code'
  - 'http.request.body.bytes': 'http.request.body.bytes'

  # sshd.yaml
  'event.action': 'event.action'
  'user.name': 'user.name'
  'source.ip': 'source.ip'
  'source.port': 'source.port'

  # aua.yaml
  'sys': 'sophos.sys'
  'host': 'sophos.host'
  'user': 'sophos.user'
  'caller': 'log.syslog.appname'
  'reason': 'event.reason'
Mapping as a filter
Note that we must map fields from httpd.yaml and sshd.yaml files, although they are already in ECS format. The mapping processor also work as a filter. Any key you do not include in the mapping declaration is dropped from the event. This is the case of aua.yaml, where some fields are not included in mapping and therefore skipped.
4. Enricher declaration
The enricher will have this structure:
---
define:
  type: parsec/enricher

enrich:
  ...
For the purpose of this example, the enricher will
- Add the fields
event.datasetanddevice.model.identifier, which will be "static" fields, always with the same value. - Transform the field
HOST.HOSTNAMEto lowercase,host.hostname. - Compute the syslog facility and severity from syslog priority, both with numeric and readable value.
Note that enrichers do not modify or delete the already existing fields, unless you explicitly specify it in the declaration. This is done by creating a field that is already existing in the event. In that case, the field is simply replaced by the new value.
Enriching simple fields
To enrich the event with event.dataset supplemented by device.model.identifier:
event.dataset: "sophos"
device.model.identifier: "SG230"
For that, specify these fields in the enricher, and the fields will be added to the event every time.
---
define:
  type: parsec/enricher

enrich:
  event.dataset: "sophos"
  device.model.identifier: "SG230"
Editing existing fields
You can perform some operations with already existing fields. In this case, the goal is to change HOST.HOSTNAME to lowercase, host.hostname. For that, use the following expression:
host.hostname: !LOWER
    what: !GET {from: !ARG EVENT, what: host.hostname}
You can also change the field name. If you do it like this,
host.id: !LOWER
    what: !GET {from: !ARG EVENT, what: host.hostname}
the output would include the original field host.hostname as well as a new lowercase field host.id.
Computing facility and severity from priority
Syslog severity and facility are computed from syslog priority by the formula:
PRIORITY = FACILITY * 8 + SEVERITY
There is a shortcut for faster computation that uses the fact that numbers are represented in binary format.
The shortcut allows the use of low level operations such as !SHR (right shift) and !AND.
8 = 2^3, therefore obtaining an integer quotient after dividing by 8 is done by performing the right shift by 3.
Integer 7 in binary representation is 111, therefore applying !AND operation gives the remainder after dividing by 8.
The expression is the following:
log.syslog.facility.code: !SHR { what: !GET { from: !ARG EVENT, what: log.syslog.priority }, by: 3 }
log.syslog.severity.code: !AND [ !GET { from: !ARG EVENT, what: log.syslog.priority }, 7 ]
You can consider the number 38 to illustrate this concept. 38 is 100 110 in binary representation. Dividing it by 8 is the same as right shift by 3 places, which is 11 in binary representation.
shr(100 110, 11) = 000 100
which is 4. So the value of FACILITY is 4, which corresponds to AUTH. Performing !AND operation gives
and(100 100, 111) = 000 100
which is again 4. So the value of SEVERITY is 4, which corresponds to WARNING.
You can also match the numeric values of severity and facility with human-readable names using the !MATCH expression. The complete declaration is the following:
---
define:
  type: parsec/enricher

enrich:
  # New fields
  event.dataset: "sophos"
  device.model.identifier: "SG230"

  # Lowercasing the existing field
  host.hostname: !LOWER
                  what: !GET {from: !ARG EVENT, what: host.hostname}

  # SYSLOG FACILITY
  log.syslog.facility.code: !SHR { what: !GET { from: !ARG EVENT, what: log.syslog.priority }, by: 3 }
  log.syslog.facility.name: !MATCH
                            what: !GET { from: !ARG EVENT, what: log.syslog.facility.code }
                            with:
                              0: 'kern'
                              1: 'user'
                              2: 'mail'
                              3: 'daemon'
                              4: 'auth'
                              5: 'syslog'
                              6: 'lpr'
                              7: 'news'
                              8: 'uucp'
                              9: 'cron'
                              10: 'authpriv'
                              11: 'ftp'
                              16: 'local0'
                              17: 'local1'
                              18: 'local2'
                              19: 'local3'
                              20: 'local4'
                              21: 'local5'
                              22: 'local6'
                              23: 'local7'
  # SYSLOG SEVERITY
  log.syslog.severity.code: !AND [ !GET { from: !ARG EVENT, what: log.syslog.priority }, 7 ]
  log.syslog.severity.name: !MATCH
                            what: !GET { from: !ARG EVENT, what: log.syslog.severity.code }
                            with:
                              0: 'emergency'
                              1: 'alert'
                              2: 'critical'
                              3: 'error'
                              4: 'warning'
                              5: 'notice'
                              6: 'information'
                              7: 'debug'
Detections
LogMan.io Correlator
TeskaLabs LogMan.io Correlator is a powerful, fast, scalable component of LogMan.io and TeskaLabs SIEM. As the Correlator makes detections possible, it is essential to effective cybersecurity.
The Correlator identifies specified activity, patterns, anomalies, and threats in real time as defined by detection rules. The Correlator works in your system's data stream, rather than on disk storage, making it a fast and uniquely scalable security mechanism.
What does the Correlator do?
The Correlator keeps track of events and when they happen in relation to a larger pattern or activity.
- First, you identify the pattern, threat, or anomaly you want the Correlator to monitor for. You write a detection that defines the activity, including which types of events (logs) are relevant and how many times an event needs to occur in a defined timeframe in order to trigger a response.
-
The Correlator identifies the relevant incoming events, and organizes the events first by a specific attribute in the event (dimension), such as source IP address or user ID, then sorts the events into short time intervals so the number of events can be analyzed. The time intervals are also defined by the detection rule.
Note: It's most common to use the Correlator's sum function to count events that occur in a specified timeframe. However, the Correlator can also analyze using other mathematical functions.
-
The Correlator analyzes these dimensions and time intervals to see if the relevant events have happened in the desired timeframe. When the Correlator detects the activity, it triggers the response specified in the detection.
In other words, this microservice shares event statuses over time intervals and uses a sliding, or rolling, analysis window.
What is a sliding analysis window?
Using a sliding analysis window means that the Correlator can analyze multiple time intervals continuously. For example, when analyzing a period of 30 seconds, the Correlator shifts its analysis, which is a window of 30 seconds, to overlap previous analyses as time progresses.
This picture represents a single dimension, for example the analysis of events with the same source IP address. In a real detection rule, you'd have several rows of this table, one row for each IP address. More in the example below.
The sliding window makes it possible to analyze the overlapping 30-second timeframes 0:00-0:30, 0:10-0:40, 0:20-0:50, and 0:30-0:60, rather than just 0:00-0:30 and 0:30-0:60.
Example
Example scenario: You create a detection to alert you when 20 login attempts are made to the same user account within 30 seconds. Since this password entry rate is higher than most people could achieve on their own, this activity could indicate a brute force attack.
In order to detect this security threat, the Correlator needs to know two things:
- Which events are relevant. In this case, that means failed login attempts to the same user account.
- When the events (login attempts) happen in relation to each other.
Note: The following logs and images are heavily simplified to better illustrate the ideas.
1. These logs occur in the system:
What do these logs mean?
Each table you see above is a log for the event of a user having a single failed login attempt.
log.ID: The unique log identifier, as seen in the table belowtimestamp: The time the event occurredusername: The Correlator will analyze groups of logs from the same users, because it wouldn't be effective in this case to analyze login attempts across all users combined.event.message: The Correlator is only looking for failed logins, as would be defined by the detection rule.
2. The Correlator begins tracking the events in rows and columns:
- Username is the dimension, as defined by the detection rule, so each user has their own row.
- Log ID (A, B, C, etc.) is here in the table so you can see which logs are being counted.
- The number in each cell is how many events occurred in that time interval per username (dimension).
3. The Correlator continues keeping track of events:
You can see that one account is experiencing a higher volume of failed login attempts now.
4. At the same time, the Correlator is analyzing 30-second time periods with an analysis window:
The analysis window moves across the time intervals to count the total number of events in 30-second timeframes. You can see that when the analysis window reaches the 01:20-01:50 timeframe for the username anna.s.ample, it will count more than 20 events. This would trigger a response from the Correlator, as defined by the detection (more on triggers here).
A gif to illustrate the analysis window moving
The 30-second analysis window "slides" or "rolls" along the time intervals, counting how many events occurred. When it finds 20 or more events in a single analysis, an action from the detection rule is triggered.
Memory and storage
The Correlator operates in the data stream, not in a database. This means that the Correlator is tracking events and performing analysis in real time as events occur, rather than pulling past collected events from a database to perform analysis.
In order to work in the data stream, the Correlator uses memory mapping, which allows it to function in the system's quickly accessible memory (RAM) rather than relying on disk storage.
Memory mapping provides significant benefits:
- Real-time detection: Data in RAM is more quickly accessible than data from a storage disk. This makes the Correlator very fast, allowing you to detect threats immediately.
- Simultaneous processing: Greater processing capacity allows for the Correlator to run many parallel detections at once.
- Scalability: The volume of data in your log collection system will likely increase as your organization grows. The Correlator can keep up. Allocating additional RAM is faster and simpler than increasing disk storage.
- Persistence: If the system shuts down unexpectedly, the Correlator does not lose data. The Correlator's history is backed up to disk (SSD) often, so the data is available when the system restarts.
For more technical information, visit our Correlator reference documentation.
What is a detection?
A detection (sometimes called a correlation rule) defines and finds patterns and specific events in your data. A huge volume of event logs moves through your system, and detections help identify events and combinations of events that might be the result of a security breach or system error.
Important
- The possibilities for your detections depend on your Correlator configuration.
- All detections are written in TeskaLabs SP-Lang. There is a quick guide for SP-Lang in the window correlation example and additional detection guidelines.
What can detections do?
You can write detections to describe and find an endless combination of events and patterns, but these are common activities to monitor:
- Multiple failed login attempts: Numerous unsuccessful login attempts within a short period, often from the same IP address, to catch brute-force or password-spraying attacks.
- Unusual data transfer or exfiltration: Abnormal or large data transfers from inside the network to external locations.
- Port scanning: Attempts to identify open ports on network devices, which may be the precursor to an attack.
- Unusual hours of activity: User or system activities during non-business hours, which could indicate a compromised account or insider threat.
- Geographical anomalies: Logins or activities originating from unexpected geographical locations based on the user's typical behavior.
- Access to sensitive resources: Unauthorized or unusual attempts to access critical or sensitive files, databases, or services.
- Changes to critical system files: Unexpected changes to system and configuration files
- Suspicious email activity: Phishing emails, attachments with malware, or other types of malicious email content.
- Privilege escalation: Attempts to escalate privileges, such as a regular user trying to gain admin-level access.
Getting started
Plan your correlation rule carefully to avoid missing important events or drawing attention to irrelevant events. Answer the questions:
- What activity (events or patterns) do you want to detect?
- Which logs are relevant to this activity?
- What do you want to happen if the activity is detected?
To get started writing a detection, see this example of a window correlation and follow these additional guidelines.
Writing a window correlation-type detection rule
A window correlation rule is a highly versatile type of detection that can identify combinations of events over time. This example shows some of the techniques you can use when writing window correlations, but there are many more options, so this page gives you additional guidance.
Before you can write a new detection rule, you need to:
- Decide what activity you are looking for, and decide the timeframe in which this activity happening is notable.
- Identify which data source produces the logs that could trigger a positive detection, and identify what information those logs contain.
- Decide what you want to happen when the activity is detected.
Use TeskaLabs SP-Lang to write correlation rules.
Sections of a correlation rule
Include each of these sections in your rule:
- Define: Information that describes your rule.
- Predicate: The
predicatesection is a filter that identifies which logs to evaluate, and which logs to ignore. - Evaluate: The
evaluatesection sorts or organizes data to be analyzed. - Analyze: The
analyzesection defines and searches for the desired pattern in the data sorted byevaluate. - Trigger: The
triggersection defines what happens if there is a positive detection.
To better understand the structure of a window correlation rule, consult this example.
Comments
Include comments in your detection rules so that you and others can understand what each item in the detection rule does. Add comments on separate lines from code, and begin comments with hashtags #.
Parentheses
Words in parentheses () are placeholders to show that there would normally be a value in this space. Correlation rules don't use parentheses.
Define
Always include in define:
| Item in the rule | How to include |
|---|---|
|
Name the rule. While the name has no impact on the rule's functionality, it should still be a name that's clear and easy for you and others to understand. |
|
Describe the rule briefly and accurately. The description also has no impact on the rule's functionality, but it can help you and others understand what the rule is for. |
|
Include this line as-is. The type does impact the rule's functionality. The rule uses correlator/window to function as a window correlator.
|
Predicate
The predicate section is a filter. When you write the predicate, you use SP-Lang expressions to structure conditions for the filter "allow in" only logs that are relevant to the activity or pattern that the rule is detecting.
If a log meets the predicate's conditions, it gets analyzed in the next steps of the detection rule, alongside other related logs. If a log doesn't meet the predicate's conditions, the detection rule ignores the log.
See this guide to learn more about writing predicates.
Evaluate
Any log that passes through the filter in predicate gets evaluated in evaluate. The evaluate section organizes the data so it can by analyzed. Usually, you can't spot a security threat (or other noteworthy patterns) based on just one event (for example, one failed login attempt), so you need to write detection rules to group events together to find patterns that point to security or operational issues.
The evaluate section creates an invisible evaluation window - you can think of the window as a table. The table is what the analyze section uses to detect the activity the detection rule is seeking.
You can see an example of the evaluate and analyze sections working together here.
Item in evaluate |
How to include |
|---|---|
|
dimension creates the rows in the table. In the table, the values of the specified fields are grouped into one row (see the table below).
|
|
by creates the columns in the table. In most cases, @timestamp is the right choice because window correlation rules are based around time. So, each column in the table is an interval of time, which the resolution specifies.
|
|
The resolution unit is seconds. Each time interval will be the number of seconds you specify.
|
|
The saturation field sets how many times the trigger can be activated before the rule stops counting events in a single cell that caused the trigger (see the table below). With a recommended saturation of 1, relevant events that happen within the same specified timeframe (resolution) will stop being counted after one trigger. Setting the saturation to 1 prevents additional triggers for identical behavior in the same timeframe.
|
Analyze
analyze uses the table created by the evaluate section to find out if the activity the detection rule is seeking has happened.
You can see an example of the evaluate and analyze sections working together here.
Item in analyze |
How to include |
|---|---|
|
The window analyzes a specified number of cells in the table created by evaluate section, each of which represents logs in a specified timeframe. Hopping window: The window will count the values in cells, testing all adjacent combinations of cells to cover the specified time period, with overlap. A hopping window is recommended. Tumbling window: The window counts the values in cells, testing all adjacent combinations of cells to cover the specified time period, WITHOUT overlap. See the note below to learn more about hopping and tumbling windows. |
|
The aggregate depends on the dimension. Use unique count to ensure that the rule won't count the same value of your specified field in dimension more than once.
|
|
A span sets the number of cells in the table that will be analyzed at once. span multiplied by resolution is the timeframe in which the correlation rule looks for a pattern or behavior. (For example, 2*60 is a 2-minute timeframe.)
|
|
The !GE expression means "greater than or equal to," and !ARG VALUE refers to the output value of the aggregate function. The value listed under !ARG VALUE is the number of unique occurances of a value in a single analysis window that will trigger the correlation rule.
|
Hopping vs. tumbling windows
This page about tumbling and hopping windows can help you understand the different types of analysis windows.
Trigger
After identifying the suspicious activity you specified, the rule can:
- Send the detection to Elasicsearch as a document. Then, you can see the detection as a log in TeskaLabs LogMan.io. You can create your own dashboard to display correlation rule detections, or find the logs in Discover.
- Send a notification via email
Visit the triggers page to learn about setting up triggers to create events, and go to the notifications page to learn about sending messages from detections.
Example of a window correlation detection rule
A window correlation rule is a type of detection that can identify combinations of events over time. Before using this example to write your own rule, visit these guidelines to better understand each part of the rule.
Like all detections, write window correlation rules in TeskaLabs SP-Lang.
Jump to: Define | Predicate | Evaluate | Analyze | Trigger
This detection rule is looking for a single external IP trying to access 25 or more unique internal IP addresses in 2 minutes. This activity could indicate an attacker trying search the network infrastructure for vulnerability.
Note
Any line beginning with a hashtag (#) is a comment, not part of the detection rule. Add notes to your detection rules to help others understand the rules' purpose and function.
The complete detection rule using a window correlation:
define:
  name: "Network T1046 Network Service Discovery"
  description: "External IP accessing 25+ internal IPs in 2 minutes"
  type: correlator/window

predicate:
  !AND
  - !OR
    - !EQ
      - !ITEM EVENT event.dataset
      - "fortigate"
    - !EQ
      - !ITEM EVENT event.dataset
      - "sophos"
  - !OR
    - !EQ
      - !ITEM EVENT event.action
      - "deny"
    - !EQ
      - !ITEM EVENT event.action
      - "drop"
  - !IN
    what: source.ip
    where: !EVENT
  - !NOT
    what:
      !STARTSWITH
      what: !ITEM EVENT source.ip
      prefix: "193.145"
  - !NE
    - !ITEM EVENT source.ip
    - "8.8.8.8"
  - !IN
    what: destination.ip
    where: !EVENT

evaluate:
  dimension: [tenant, source.ip]
  by: "@timestamp"
  resolution: 60
  saturation: 1

analyze:
  window: hopping
  aggregate: unique count
  dimension: destination.ip
  span: 2
  test:
    !GE
    - !ARG VALUE
    - 25

trigger:
  - event:
      !DICT
      type: "{str:any}"
      with:
        ecs.version: "1.10.0"
        lmio.correlation.depth: 1
        lmio.correlation.name: "Network T1046 Network Service Discovery"

        # Events
        events: !ARG EVENTS

        # Threat description
        # https://www.elastic.co/guide/en/ecs/master/ecs-threat.html
        threat.framework: "MITRE ATT&CK"
        threat.software.platforms: "Network"
        threat.indicator.sightings: !ARG ANALYZE_RESULT

        threat.indicator.confidence: "Medium"
        threat.indicator.ip: !ITEM EVENT source.ip
        threat.indicator.port: !ITEM EVENT source.port
        threat.indicator.type: "ipv4-addr"

        threat.tactic.id: "TA0007"
        threat.tactic.name: "Discovery"
        threat.tactic.reference: "https://attack.mitre.org/tactics/TA0007/"

        threat.technique.id: "T1046"
        threat.technique.name: "Network Service Discovery"
        threat.technique.reference: "https://attack.mitre.org/techniques/T1046/"

        # Identification
        event.kind: "alert"
        event.dataset: "correlation"
        source.ip: !ITEM EVENT source.ip
Define
define:
  name: "Network T1046 Network Service Discovery"
  description: "External IP accessing 25+ internal IPs in 2 minutes"
  type: correlator/window
| Item in the rule | What does it mean? |
|---|---|
|
This is the name of the rule. The name is for the users and has no impact on the rule itself. |
|
The description is also for the users. It describes what the rule does, but it has no impact on the rule itself. |
|
The type does impact the rule. The rule uses correlator/window to function as a window correlator.
|
Predicate
predicate is the filter that checks if an incoming log might be related to the event that the detection rule is searching for.
The predicate is made of SP-Lang expressions. The expressions create conditions. If the expression is "true," the condition is met. The filter checks the incoming log to see if the log makes the predicate's expressions "true" and therefore meets the conditions.
If a log meets the predicate's conditions, it gets analyzed in the next steps of the detection rule, alongside other related logs. If a log doesn't meet the predicate's conditions, the detection rule ignores the log.
You can find the full SP-Lang documentation here.
SP-Lang terms, in the order they appear in the predicate
| Expression | Meaning |
|---|---|
!AND |
ALL of the criteria nested under !AND must be met for the !AND to be true |
!OR |
At least ONE of the criteria nested under !OR must be met for the !OR to be true |
!EQ |
"Equal" to. Must be equal to, or match the value, to be true |
!ITEM EVENT |
Gets information from the content of the incoming logs (accesses the fields and values in the incoming logs) |
!IN |
Looks for a value in a set of values (what in where) |
!NOT |
Seeks the opposite of the expression nested under the !NOT (following what) |
!STARTSWITH |
The value of the field (what) must start with the specified text (prefix) to be true |
!NE |
"Not equal" to, or doesn't equal. Must NOT equal (must not match the value) to be true |
You can see that there are several expressions nested under !AND. A log must meet ALL of the conditions nested under !AND to pass through the filter.
| As seen in rule | What does it mean? |
|---|---|
|
This is the first !OR expression, and it has two !EQ expressions nested under it, so at least ONE !EQ condition nested under this !OR must be true. Remember, !ITEM EVENT gets the value of the field it specifies. If the incoming log has "fortigate" OR "sophos" in the field event.dataset, then the log meets the !OR condition.
This filter accepts events only from the FortiGate and Sophos data sources. FortiGate and Sophos provide security tools such as firewalls, so this rule is looking for events generated by security tools that might already be intercepting suspicious activity. |
|
This condition is structured the same way as the previous one. If the incoming log has the value "deny" OR "drop" in the field event.action, then the log meets this !OR condition.
The values "deny" and "drop" in a log both signal that a security device, such as a firewall, blocked attempted access based on authorization or security policies. |
|
If the field source.ip exists in the incoming log (!EVENT), then the log meets this !IN condition.
The field source.ip is the IP address that is trying to gain access to another IP address. Since this rule is specifically about IP addresses, the log needs to have the source IP address in it to be relevant.
|
|
If the value of the field source.ip DOES NOT begin with "193.145," then this !NOT expression is true. 193.145 is the beginning of this network's internal IP addresses, so the !NOT expression filters out internal IP addresses. This is because internal IPs accessing many other internal IPs in a short timeframe would not be suspicious. If internal IPs were not filtered out, the rule would return false positives.
|
|
If the incoming log DOES NOT have the value "8.8.8.8" in the field source.ip, then the log meets this !NE condition.
The rule filters out 8.8.8.8 as a source IP address because it is a well-known and trusted DNS resolver operated by Google. 8.8.8.8 is not generally associated with malicious activity, so not excluding it would trigger false positives in the rule. |
|
If the field destination.ip exists in the incoming log, then the log meets this !IN condition.
The field destination.ip is the IP address that is being accessed. Since this rule is specifically about IP addresses, the log needs to have the destination IP address in it to be relevant.
|
If an incoming log meets EVERY condition shown above (nested under !AND), then the log gets evaluated and analyzed in the next sections of the detection rule.
Evaluate
Any log that passes through the filter in predicate gets evaluated in evaluate. The evaluate section organizes the data so it can by analyzed. Usually, you can't spot a security threat (or other noteworthy patterns) based on just one event (for example, one failed login attempt), so the detection rule groups events together to find patterns that point to security or operational issues.
The evaluate section creates an invisible evaluation window - you can think of the window as a table. The table is what the analyze section uses to detect the event the detection rule is seeking.
evaluate:
dimension: [tenant, source.ip]
by: "@timestamp"
resolution: 60
saturation: 1
| As seen in rule | What does it mean? |
|---|---|
|
dimension creates the rows in the table. The rows are tenant and source.ip. In the final table, the values of tenant and source.ip are grouped into one row (see the table below).
|
|
by creates the columns in the table. It refers to the field @timestamp because the values from that field enable the rule to compare the events over time. So, each column is an interval of time, which the resolution specifies.
|
|
The resolution unit is seconds, so the value here is 60 seconds. Each time interval will be 60 seconds long.
|
|
The saturation field sets how many times the trigger can be activated before the rule stops counting events in a single cell that caused the trigger (see the table below). Since the saturation is 1, this means that relevant events that happen within one minute of each other will stop being counted after one trigger. Setting the saturation to 1 prevents additional triggers for identical behavior in the same timeframe. In this example, the trigger would be activated only once if an external IP address tried to access any number of unique internal IPs above 25.
|
This is an example of how the evaluate section sorts logs that pass through the predicate filter. (Click the table to enlarge.) The log data is heavily simplified for the sake of readability (for example, log IDs in the field _id are letters rather than real log IDs, and the timestamps are shortened).
As specified by the dimension field, the logs are grouped by tenant and source IP address, as you can see in cells A2-A5.
Since by has the value timestamp, and the resolution is set to 60 seconds, the cells B1-E1 are time intervals, and the logs are sorted into the columns by their timestamp value.
The number beside the list of log IDs in each cell (for example, 14 in cell C4) is the count of how many logs with the same source IP address passed through the filter in that timeframe. This becomes essential information in the analyze section of the rule, since we're counting access attempts by external IPs.
Analyze
analyze uses the table created by the evaluate section to find out if the event the detection rule is seeking has happened.
analyze:
window: hopping
aggregate: unique count
dimension: destination.ip
span: 2
test:
!GE
- !ARG VALUE
- 25
| As seen in rule | What does it mean? |
|---|---|
|
The window type is hopping. The window analyzes a specified number of cells in the table created by evaluate section, each of which represents logs in a timeframe of 60 seconds. Since the type is hopping, the window will count some cells twice to test any adjacent combination of a two-minute time period. Since the span is set to 2, the rule will analyze two minutes (cells) at a time, with overlap.
|
|
The aggregate depends on the dimension. Here, unique count applies to destination.ip. This ensures that the rule won't count the same desination IP address more than once.
|
|
A span of 2 means that the cells in the table will be analyzed 2 at a time. |
|
The !GE expression means "greater than or equal to," and !ARG VALUE refers to the output value of the aggregate function. The value 25 is listed under !ARG VALUE, so this whole test expression is testing for 25 or more unique destination IP addresses in a single analysis window.
|
The red window around cells C4 and D4 shows that the rule has detected what it's looking for - attempted connection to 25 unique IP addresses.
Analysis with a hopping window explained in a gif
This illustrates how the window analyzes the data two cells at a time. When the window gets to cells C4 and D4, it detects 25 unique destination IP addresses.
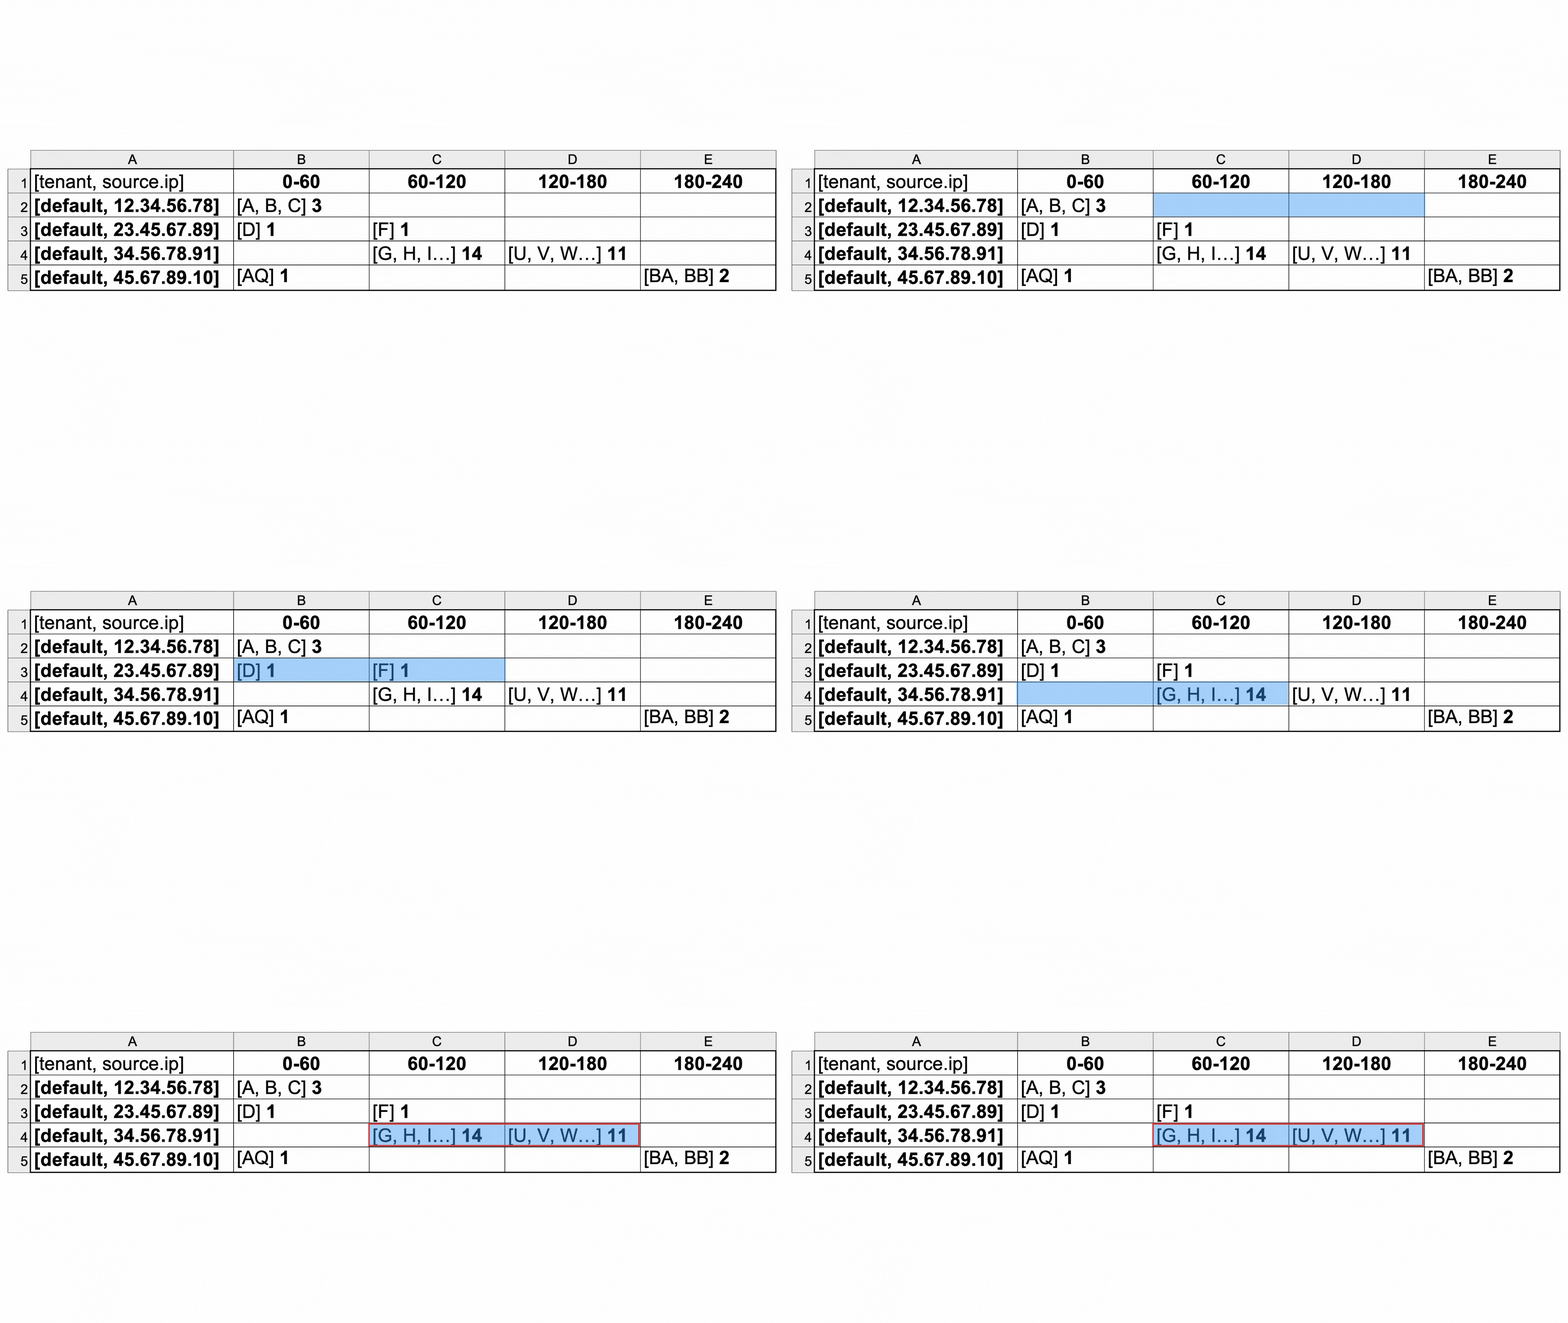
Trigger
The trigger section defines what happens if the analyze section detects the event that the detection rule is looking for. In this case, the trigger is activated when a single external IP address attempts to connect to 25 or more different interal IP addresses.
| As seen in rule | What does it mean? |
|---|---|
|
In the trigger, event means that the rule will create an event based on this positive detection and send it into the data pipeline via Elasticsearch, where it is stored as a document. Then, the event comes through to TeskaLabs LogMan.io, where you can see this event in Discover and in dashboards.
|
|
!DICT creates a dictionary of keys (fields) and values. type has "st:any" (meaning string) so that any type of value (numbers, words, etc) can be a value in a key-value pair. with begins the list of key-value pairs, which you define. These are the fields and values that the event will be made of.
|
To learn more about each field, click the icons. Since TeskaLabs LogMan.io uses Elasticsearch and the Elastic Common Schema (ECS), you can get more details about many of these fields in the ECS reference guide.
trigger:
- event:
!DICT
type: "{str:any}"
with:
ecs.version: "1.10.0" #(1)
lmio.correlation.depth: 1 #(2)
lmio.correlation.name: "Network T1046 Network Service Discovery" #(3)
# Events
events: !ARG EVENTS #(4)
# Threat description
# https://www.elastic.co/guide/en/ecs/master/ecs-threat.html
threat.framework: "MITRE ATT&CK" #(5)
threat.software.platforms: "Network" #(6)
threat.indicator.sightings: !ARG ANALYZE_RESULT #(7)
threat.indicator.confidence: "Medium" #(8)
threat.indicator.ip: !ITEM EVENT source.ip #(9)
threat.indicator.port: !ITEM EVENT source.port #(10)
threat.indicator.type: "ipv4-addr" #(11)
threat.tactic.id: "TA0007" #(12)
threat.tactic.name: "Discovery" #(13)
threat.tactic.reference: "https://attack.mitre.org/tactics/TA0007/" #(14)
threat.technique.id: "T1046" #(15)
threat.technique.name: "Network Service Discovery" #(16)
threat.technique.reference: "https://attack.mitre.org/techniques/T1046/" #(17)
# Identification
event.kind: "alert" #(18)
event.dataset: "correlation" #(19)
source.ip: !ITEM EVENT source.ip #(20)
- The version of the Elastic Common Schema that this event conforms to - required field that must exist in all events going to Elasticsearch.
- The correlation depth indicates if this rule depends on any other rules or is in a chain of rules. The value 1 means that it is either the first in a chain, or the only rule involved - it doesn't depend on any other rules.
- The name of the rule
- In SP-Lang,
!ARG EVENTSaccesses original logs. So, this will list the IDs all of the events that make up this positive detection, so that you can investigate each log individually. - Name of the threat framework used to further categorize and classify the tactic and technique of the reported threat. See ECS reference.
- The platforms of the software used by this threat to conduct behavior commonly modeled using MITRE ATT&CK®. See ECS reference.
- Number of times this indicator was observed conducting threat activity. See ECS reference.
- Identifies the vendor-neutral confidence rating using the None/Low/Medium/High scale defined in Appendix A of the STIX 2.1 framework. See ECS reference.
- Identifies a threat indicator as an IP address (irrespective of direction). See ECS reference.
- Identifies a threat indicator as a port number (irrespective of direction). See ECS reference.
- Type of indicator as represented by Cyber Observable in STIX 2.0. See ECS reference.
- The id of tactic used by this threat. See ECS reference.
- The name of the type of the tactic used by this threat. See ECS reference.
- The reference url of tactic used by this threat. See ECS reference.
- The id of technique used by this threat. See ECS reference.
- The name of technique used by this threat. See ECS reference.
- The reference url of technique used by this threat. See ECS reference.
- The type of event
- The dataset that this event will be grouped in.
- The source IP address associated with this event (the one that tried to access 25 internal IPs in two minutes)
Predicates
A predicate is a filter made of conditions formed by SP-Lang expressions.
How to write predicates
Before you can create a filter, you need to know the possible fields and values of the logs you are looking for. To see what fields and values your logs have, go to Discover in the TeskaLabs LogMan.io web app.
SP-Lang expressions
Construct conditions for the filter using SP-Lang expressions. The filter checks the incoming log to see if the log makes the expressions "true" and therefore meets the conditions.
You can find the full SP-Lang documentation here.
Common SP-Lang expressions:
| Expression | Meaning |
|---|---|
!AND |
ALL of the criteria nested under !AND must be met for the !AND to be true |
!OR |
At least ONE of the criteria nested under !OR must be met for the !OR to be true |
!EQ |
"Equal" to. Must be equal to, or match the value, to be true |
!NE |
"Not equal" to, or doesn't equal. Must NOT equal (must not match the value) to be true |
!IN |
Looks for a value in a set of values (what in where) |
!STARTSWITH |
The value of the field (what) must start with the specified text (prefix) to be true |
!ENDSWITH |
The value of the field (what) must end with the specified text (postfix) to be true |
!ITEM EVENT |
Gets information from the content of the incoming logs (allows the filter to access the fields and values in the incoming logs) |
!NOT |
Seeks the opposite of the expression nested under the !NOT (following what) |
Conditions
Use this guide to structure your individual conditions correctly.
Parentheses
Words in parentheses () are placeholders to show where values go. SP-Lang does not use parentheses.
| Filter for a log that: | SP-Lang |
|---|---|
| Has a specified value in a specified field |
|
| Has a specified field |
|
| Does NOT have a specified value in a specified field |
|
| Has one of multiple possible values in a field |
|
| Has a specified value that begins with a specified number or text (prefix), in a specified field |
|
| Has a specified value that ends with a specified number or text (postfix), in a specified field |
|
| Does NOT satisfy a condition or set of conditions |
|
Example
To learn what each expression means in the context of this example, click the icons.
!AND #(1)
- !OR #(2)
- !EQ
- !ITEM EVENT event.dataset
- "sophos"
- !EQ
- !ITEM EVENT event.dataset
- "vmware-vcenter"
- !OR #(3)
- !EQ
- !ITEM EVENT event.action
- "Authentication failed"
- !EQ
- !ITEM EVENT event.action
- "failed password"
- !EQ
- !ITEM EVENT event.action
- "unsuccessful login"
- !OR #(4)
  - !IN
    what: source.ip
    where: !EVENT
- !IN
what: user.id
where: !EVENT
- !NOT #(5)
what:
!STARTSWITH
what: !ITEM EVENT user.id
prefix: "harry"
- Every expression nested under
!ANDmust be true for a log to pass through this filter. - In the log, in the field
event.dataset, the value must besophosorvmware-vcenterfor this!ORto be true. - In the log, in the field
event.action, the value must beAuthentication failed,failed password, orunsuccessful loginfor this!ORto be true. - The log must contain the field
source.ipor the fielduser.idfor this!ORto be true. - In the log, the field
user.idmust not begin withharryfor this!NOTto be true.
This filters for logs that:
- Have the value
sophosorvmware-vcenterin the fieldevent.datasetAND - Have the value
Authentication failed,failed password, orunsuccessful loginin the fieldevent.actionAND - Include at least one of the fields
source.iporuser.idAND - Do not have a value that begins with
harryin the fielduser.id
For more ideas and formatting tips, see this example in the context of a detection rule, including details about the predicate section.
Triggers
A trigger, in an alert or detection, executes an action. For example, in a detection, the trigger section can send an email when the specified activity is detected.
A trigger can:
- Trigger an event: Send an event to Elasicsearch where it is stored as a document. Then, you can see the event as a log in the TeskaLabs LogMan.io app. You can create your own dashboard to display correlation rule detections, or find the logs in Discover.
- Trigger a notification: Send a message via email
Trigger an event
You can trigger an event. The end result is that the trigger creates a log of the event, which you can see in TeskaLabs LogMan.io.
Item in trigger |
How to include |
|---|---|
|
In the trigger, event means that the rule will create an event based on this positive detection and send it into the data pipeline via Elasticsearch, where it is stored as a document. Then, the event comes through to TeskaLabs LogMan.io, where you can see this event in Discover and Dashboards.
|
|
!DICT creates a dictionary of keys (fields) and values. type has "st:any" (meaning string) so that any type of value (numbers, words, etc) can be a value in a key-value pair. with begins the list of key-value pairs, which you define. These are the fields and values that the event will be made of.
|
Following with, make a list of the key-value pairs, or fields and values, that you want in the event.
!DICT
type: "{str:any}"
with:
key.1: "value"
key.2: "value"
key.3: "value"
key.4: "value"
If you're using Elasticsearch and therefore the Elastic Common Schema (ECS), you can read about standard fields in the ECS reference guide.
Trigger a notification
Notifications send messages. Currently, you can use notifications to send emails.
Learn more about writing notifications and creating email templates.
Notifications
Notifications
Notifications send messages. You can add a notification section anywhere that you want the output of a trigger to be a message, such as in an alert or detection. In a detection, the notification section can send a message when the specified activity (such as a potential threat) is detected.
TeskaLabs LogMan.io uses TeskaLabs ASAB Iris, a TeskaLabs microservice, to send messages.
Warning
To avoid notification spam, only use notifications for highly urgent and well-tested detection rules. Some detections are better suited to be sent as events through Elasticsearch and viewed in the LogMan.io web app.
Notification types
Currently, you can send messages via email.
Sending notifications via email
Write notifications in TeskaLabs SP-Lang. If you're writing a notification for a detection, write the email notification in the trigger section.
Important
For notifications that send emails, you need to create an email template in the Library to connect with. This template includes the actual text that the recipient will see, with blank fields that change based on what the detected activity is (using Jinja templates), including which logs are involved in the detection, and any other information you choose. The notification section in the detection rule is what populates the blank fields in the email template. You can use a single email template for multiple detection rules.
Example:
Use this example as a guide. Click the icons to learn what each line means.
trigger: #(1)
- notification: #(2)
type: email #(3)
template: "/Templates/Email/Notification.md" #(4)
to: [email@example.com] #(5)
variables: #(6)
!DICT #(7)
type: "{str:any}" #(8)
with: #(9)
name: Notification from the detection X #(10)
events: !ARG EVENTS #(11)
address: !ITEM EVENT client.address #(12)
description: Detection of X by TeskaLabs LogMan.io #(13)
-
Indicates the beginning of the
triggersection. -
Indicates the beginning of the
notificationsection. -
To send an email, write email for
type. -
This tells the notification where to get the email template from. You need to specify the filepath (or location) of the email template in the Library. In this example, the template is in the Library, in the Templates folder, in the Email subfolder, and it’s called Notification.md.
-
Write the email address where you want the email to go.
-
Begins the section that gives directions for how to fill the blank fields from the email template.
-
An SP-Lang expression that creates a dictionary so you can use key-value pairs in the notification. (The key is the first word, and the value is what follows.) Always include
!DICT. -
Always make type "{str:any}" so that the values in the key-value pairs can be in any format (numbers, words, arrays, etc.).
-
Always include
with, because it begins the list of fields from the email template. Everything nested underwithis a field from the email template. -
The name of the detection rule, which should be understandable to the recipient
-
eventsis the key, or field name, and!ARG EVENTSis an SP-Lang expression that lists the logs that caused a positive detection from the detection rule. -
addressis the key, or field name, and!ITEM EVENT client.addressgets the value of the fieldclient.addressfrom each log that caused a positive detection from the detection rule. -
Your description of the event, which needs to be very clear and accurate
Populating the email template
name, events, address, and description are fields in the email template in this example. Always make sure that the keys you write in the with section match the fields in your email template.
The fields name and description are static text values - they stay the same in every notification.
The fields events and address are dynamic values - they change based on which logs caused a positive detection from the detection rule. You can write dynamic fields using TeskaLabs SP-Lang.
Refer to our directions for creating email templates to write templates that work correctly as notifications.
Creating email templates
An email template is a document that works with a notification to send an email, for example as a result of a positive detection in a detection rule. Jinja template fields allow the email template to have dynamic values that change based on variables such as events involved in a positive detection. (After you learn about creating email templates, learn how to use Jinja template fields.)
The email template provides the text that the recipient sees when they get an email from the notification. You can find email templates in your Library in the Templates folder.
When you write an email template to go with a notification, make sure that the template fields in each item match.
How do the notification and email template work together?
TeskaLabs ASAB Iris is a message-sending microservice that pairs the notification and the email template to send emails with populated placeholder fields.
Creating an email template
Create a new blank email template
- In the Library, click Templates, then click Email.
- To the right, click Create new item in Email.
- Name your template, choose the file type, and click Create. If the new item doesn't appear immediately, refresh the page.
- Now, you can write the template.
Copy an existing email template
- In the Library, click Templates, then click Email.
- Click on the existing template you'd like to copy. The copy you create will be placed in the same folder as the original.
- Click the icon at the top of the screen, and click Copy.
- Rename the file, choose the file type, and click Copy. If the new item doesn't appear immediately, refresh the page.
- Click Edit to make changes, and click Save to save your changes.
To exit editing mode, save by clicking Save or cancel by clicking Cancel.
Writing an email template
You can write email templates in Markdown or in HTML. Markdown is less complex, but HTML gives you more formatting options.
When you write the text, make sure to tell the recipient:
- Who the email is from
- Why they are receiving this email
- What the email/alert means
- How to investigate or follow up on the problem - include all of the relevant and useful information, such as log IDs or direct links to view selected logs
Simple template example using Markdown:
SUBJECT: {{ name }}
TeskaLabs LogMan.io has identified a noteworthy event in your IT infrastructure which might require your immediate attention.
Please review following summary of the event:
Event: {{name}}
Event description: {{description}}
This notification has been created based on the original log/logs:
{% for event in events %}
- {{event}}
{% endfor %}
The notification was generated for this address: {{address}}
We encourage you to review this incident promptly to determine the next appropriate course of action.
Remember, the effectiveness of any security program lies in a swift response.
Thank you for your attention to this matter.
Stay safe,
TeskaLabs LogMan.io
Made with <3 by [TeskaLabs](https://teskalabs.com)
The words in double braces (such as {{address}}) are template fields, or placeholders. These are the Jinja template fields that pull information from the notification section in a detection rule. Learn about Jinja templates here.
Testing an email template
You can test an email template using the Test template feature. Testing an email template means sending a real email to see if the format and fields are displaying correctly. This test does not interact with the detection rule at all.
Fill out the From, To, CC, BCC, and Subject fields the same way you would for any email (but it's best practice to send the email to yourself). You must always fill in, at minimum, the From and To fields.
Test parameters
You can populate the Jinja template fields for testing purposes using the Parameters tool. Write the parameters in JSON. JSON uses keys-value pairs. Keys are the fields in the template, and values are what populate the fields.
In this example, the keys and values are highlighted to show that the keys in Parameters need to match the fields in the template, and the values will populate the fields in the resulting email:
Parameters has two editing modes: the text editor and the clickable JSON editor. To switch between modes, click the <···> or icon beside Parameters. You can switch between modes without losing your work.
Clickable editor
To switch to the clickable JSON editor, click the <···> icon beside Parameters. The clickable editor formats your parameters for you and tells you the value type for each item.
How to use the clickable editor:
In the clickable editor, edit, delete, and add icons appear when you hover over lines and items.
1. Add a key: When you hover over the top line (it says the number of keys you have, for example 0 items), a icon appears. To add a parameter, click the icon. It prompts you for the key name. Type the key name (the field name you want to test) and click the to save. Don't use quotation marks - the editor adds the quotation marks for you. The key name appears with the value NULL beside it.
2. Add a value: To edit the value, click the icon that appears when you hover beside NULL. Type the value (what you want to appear in place of the field/placeholder in the email you send), and save by clicking the icon.
3. To add more key-value pairs, click on the that appears when you hover over the top line.
4. To delete an item, click the that appears when you hover over the item. To edit an item, click the that appears when you hover over the item.
Text editor
To switch to the text editor, click the icon beside Parameters.
Example of parameter formatting:
{
"name":"Detection rule 1",
"description":"Description of Detection rule 1",
"events":["log-ID-1", "log-ID-2", "log-ID-3"],
"address":"Example address"
}
Quick JSON tips
- Begin and end the parameters with braces (curly brackets)
{} - Write every item, both keys and values, in quotation marks
"" - Link keys to their values with a colon
:(for example:"key":"value") - Separate key-value pairs with commas
,. You can also use spaces and line breaks for your own readability - they'll be ignored in terms of function. - Type arrays in brackets
[]and separate items with commas (the keyeventsmight have multiple values, as the Jinjaforexpression allows for, so here it's written as an array)
The testing box tells you if the parameters are not in a valid JSON format.
Switching modes
You can switch modes and continue editing your parameters. The Parameters tool will automatically convert your work for the new mode.
Note about arrays
An array is a list of multiple values. To edit an array value in the clickable editor, you need to type at least two values manually in the text editor in the correct array format (see Quick JSON tips above). Then, you can switch to the clickable editor and add more items to the array.
Sending the test email
When you're ready to test the email, click Send. You should receive the email in the inbox of addressee in the To: field, where you can check the formatting of the template. If you don't see the email, check your spam folder.
Jinja templating
The notification section of a detection rule works with an email template to send a message when the detection rule is triggered. The email template has placeholder fields, and the notification determines what fills those placeholder fields in the actual email that the recipient gets. This is possible because of Jinja templating. (Learn about writing email templates before you learn about Jinja fields.)
Format
Format all Jinja template fields with two braces (curly brackets) on each side of the field name in both Markdown and HTML email templates. You can use or not use a space on either side of the field name.
{{fieldname}} OR {{ fieldname }}
For a more in-depth explanation of Jinja templating, visit this tutorial.
if expression
You might want to use the same email template for multiple detection rules. Since different detection rules might have different data included, some parts of your email might only be relevant for some detection rules. You can use if to include a section only if a certain key in the notification template has a value. This helps you avoid unpopulated template fields or nonsensical text in an email.
In this example, anything between if and endif is only included in the email if the key sender has a value in the notification section of the detection rule. (If there is no value for sender, this section won't appear in the email.)
{% if sender %}
The email address {{ sender }} has sent a suspicious number of emails.
{% endif %}
For more details, visit this tutorial.
for expression
Use for when you might have multiple values from the same category that you want to appear as a list in your email.
In this example, events is the actual template field that you'd see in the notification, and it might contain multiple values (in this case, multiple log IDs). Here, log is just a temporary variable used only in this for expression to represent one value that the notification sends from the field events. (This temporary variable could be any word, as it refers only to itself in the email template.) The for expression allows the template to display these multiple values as a bulleted list (mutliple instances).
{% for log in events %}
- {{ log }}
{% endfor %}
For more details, visit this tutorial.
Link templating
Thanks to TeskaLabs ASAB Iris, you can include links in your emails that change based on tenant or events detected by the rule.
Link to a tenant's home page:
{{lmio_url}}/?tenant={{tenant}}#/
tenant in your detection rule notification section for the link to work.
Link to a specific log:
[{{event}}]({{lmio_url}}/?tenant={{tenant}}#/discover/lmio-{{tenant}}-events?aggby=minute&filter={{event}}&ts=now-2d&te=now&refresh=off&size=40)
tenant or lmio_url in your detection rule notification section for the link to work.Using Base64 images in HTML email templates
To hardcode an image into an email template written in HTML, use Base64. Converting an image to Base64 makes the image into a long string of text.
- Use an image converting tool (such as this one by Atatus) to convert your image to Base64.
- Using image
<img>and alt textalttags, copy and paste the Base64 string into your template like this:
<img alt="ALT TEXT HERE" src="PASTE HERE"/>
Note
The alt text is optional, but it is recommended in case your image doesn't load for any reason.
Administration Manual
TeskaLabs LogMan.io Administration Manual
Welcome to the Administration Manual. Use this guide to set up and configure LogMan.io for yourself or clients.
Installation
Installation
TeskaLabs LogMan.io can be installed on physical servers ("bare metal"), virtual servers, private and public cloud compute instances. It can run both as a single-node installation or in a cluster to provide high availability.
Cluster requirements
All nodes of the cluster MUST fullfill all the prerequisites. The number of the cluster core nodes must be odd (3, 5, etc.) to prevent split-brain.
Prerequisites
- Physical or virtual server, specification is here
- OS Linux: Ubuntu 22.04 LTS, RedHat 9, CentOS 9 (for others, kindly contact our support)
- Network connectivity with enabled outgoing access to the Internet (could be restricted after the installation); details are descibed here
- Credentials to SMTP server for outgoing emails
- DNS domain, even internal (needed for HTTPS setup)
- Credentials to TeskaLabs Docker registry
docker.teskalabs.com(contact our support if you don't have one)
Implementation plan
For a larger or important installation, we provide a template of the implementation plan. The implementation plan helps to collect prerequisites from the end user. Please contact our support to get a copy.
Installation
Make sure to fullfill all prerequisites for each step.
- Phase 1: From bare metal to operating system
- Phase 2: From operating system to Docker
- Phase 3: TeskaLabs LogMan.io installation
- Phase 4: Initial Setup of TeskaLabs LogMan.io
Danger
TeskaLabs LogMan.io CANNOT BE operated under root user (superuser). Violation of this rule may lead to a significant cybersecurity risks.
From bare metal server to operating system
Note
Skip this phase if you are installing on the virtual machine, respective on the host with the operating system installed already.
Prerequisites
- The server that conforms to prescribed data storage organisation.
- Bootable USB stick with Ubuntu Server 22.04 LTS; the most recent release.
- Access to the server equipped with a monitor and a keyboard; alternatively over IPMI or equivalent Out-of-band management.
- Network connectivity with enabled outgoing access to the Internet.
Note
These are additional prerequisites on top of the general prerequisites.
Steps
1) Boot the server using a bootable USB stick with Ubuntu Server.
Insert the bootable USB stick into the USB port of the server, then power on the server.
Use UEFI partition on the USB stick as a boot device.
Select "Try or Install Ubuntu Server" in a boot menu.
2) Select "English" as the language
3) Update to the new installer if needed
4) Select the english keyboard layout
5) Select the "Ubuntu Server" installation type
6) Configure the network connection
This is the network configuration for the installation purposes, the final network configuration can be different.
If you are using DHCP server, the network configuration is automatic.
IMPORTANT: The Internet connectivity must be available.
Note the IP address of the server for a future use.
7) Skip or configure the proxy server
Skip (press "Done") the proxy server configuration.
8) Confirm selected mirror address
Confirm the selected mirror address by pressing "Done".
9) Select "Custom storage layout"
The custom storage layout of the system storage is as follows:
| Mount | Size | FS | Part. | RAID / Part. | VG / LV |
|---|---|---|---|---|---|
/boot/efi |
1G | fat32 | 1 | ||
| SWAP | 64G | 2 | |||
/boot |
2G | ext4 | 3 | md0 / 1 |
|
/ |
50G | etx4 | 3 | md0 / 2 |
systemvg / rootlv |
/var/log |
50G | etx4 | 3 | md0 / 2 |
systemvg / loglv |
| Unused | >100G | 3 | md0 / 2 |
systemvg |
Legend:
- FS: Filesystem
- Part.: GUID Partition
- RAID / Part.: MD RAID volume and a partition on the given RAID volume
- VG: LVM Volume Group
- LV: LVM Logical Volume
Note
Unused space will be used later in the installation for i.e. Docker containers.
10) Identify two system storage drives
The two system storage drives are structured symmetrically to provided redundancy in case of one system drive failure.
Note
The fast and slow storage is NOT configured here during the OS installation but later from the installed OS.
11) Set the first system storage as a primary boot device
This step will create a first GPT partition with UEFI, that is mounted at /boot/efi.
The size of this partition is approximately 1GB.
12) Set the second system storage as a secondary boot device
Another UEFI partition is created on the second system storage.
13) Create SWAP partitions on both system storage drives
On each of two drives, add a GPT partition with size 64G and format swap.
Select "free space" on respective system storage drive and then "Add GPT Partition"
Resulting layout is as follows:
14) Create the GPT partition for RAID1 on both system storage drives
On each of two drives, add GPT partition with the all remaining free space. The format is "Leave unformatted" because this partition will be added to the RAID1 array. You can leave “Size” blank to use all the remaining space on the device.
The result is "partition" entry instead of the "free space" on respective drives.
15) Create software RAID1
Select "Create software RAID (md)".
The name of the array is md0 (default).
RAID level is "1 (mirrored)".
Select two partitions from the above step, keep them marked as "active", and press "Create".
The layout of system storage drives is following:
16) Create a BOOT partition of the RAID1
Add a GPT partition onto the md0 RAID1 from the step above.
The size is 2G, format is ext4 and the mount is /boot.
17) Setup LVM partition on the RAID1
The remaining space on the RAID1 will be managed by LVM.
Add a GPT partition onto the md0 RAID1, using "free space" entry under md0 device.
Use the maximum available space and set the format to "Leave unformatted". You can leave “Size” blank to use all the remaining space on the device.
18) Setup LVM system volume group
Select "Create volume group (LVM)".
The name of the volume group is systemvg.
Select the available partition on the md0 that has been created above.
19) Create a root logical volume
Add a logical volume named rootlv on the systemvg (in "free space" entry), the size is 50G, format is ext4 and mount is /.
20) Add a dedicated logical volume for system logs
Add a logical volume named loglv on the systemvg, the size is 50G, format is ext4 and mount is "Other" and /var/log.
21) Confirm the layout of the system storage drives
Press "Done" on the bottom of the screen and eventually "Continue" to confirm application of actions on the system storage drives.
22) Profile setup
Your name: TeskaLabs Admin
Your server's name: lm01 (for example)
Pick a username: tladmin
Select a temporary password, it will be removed at the end of the installation.
23) SSH Setup
Select "Install OpenSSH server"
24) Skip the server snaps
Press "Done", no server snaps will be installed from this screen.
25) Wait till the server is installed
It takes approximately 10 minutes.
When the installation is finished, including security updated, select "Reboot Now".
26) When prompted, remove USB stick from the server
Press "Enter" to continue reboot process.
Note
You can skip this step if you are installing over IPMI.
27) Boot the server into the installed OS
Select "Ubuntu" in the GRUB screen or just wait 30 seconds.
28) Login as tladmin
29) Update the operating system
sudo apt update
sudo apt upgrade
sudo apt autoremove
30) Configure the slow data storage
Slow data storage (HDD) is mounted at /data/hdd.
Assuming the server provides following disk devices /dev/sdc, /dev/sdd, /dev/sde, /dev/sdf, /dev/sdg and /dev/sdh.
Create software RAID5 array at /dev/md1 with ext4 filesystem, mounted at /data/hdd.
sudo mdadm --create /dev/md1 --level=5 --raid-devices=6 /dev/sdc /dev/sdd /dev/sde /dev/sdf /dev/sdg /dev/sdh
Note
For the RAID6 array, use --level=6.
Create a EXT4 filesystem and the mount point:
sudo mkfs.ext4 -L data-hdd /dev/md1
sudo mkdir -p /data/hdd
Enter the following line to /etc/fstab:
/dev/disk/by-label/data-hdd /data/hdd ext4 defaults,noatime 0 1
Danger
The noatime flag is important for a optimal storage performance.
Mount the drive:
sudo mount /data/hdd
Note
The RAID array construction can take substantial amount of time. You can monitor progress by cat /proc/mdstat. Server reboots are safe during RAID array construction.
You can speed up the construction by increasing speed limits:
sudo sysctl -w dev.raid.speed_limit_min=5000000
sudo sysctl -w dev.raid.speed_limit_max=50000000
These speed limit settings will last till the next reboot.
31) Configure the fast data storage
Fast data storage (SSD) is mounted at /data/ssd.
Assuming the server provides following disk devices /dev/nvme0n1 and /dev/nvme1n1.
Create software RAID1 array at /dev/md2 with ext4 filesystem, mounted at /data/ssd.
sudo mdadm --create /dev/md2 --level=1 --raid-devices=2 /dev/nvme0n1 /dev/nvme1n1
sudo mkfs.ext4 -L data-ssd /dev/md2
sudo mkdir -p /data/ssd
Enter the following line to /etc/fstab:
/dev/disk/by-label/data-ssd /data/ssd ext4 defaults,noatime 0 1
Danger
The noatime flag is important for a optimal storage performance.
Mount the drive:
sudo mount /data/ssd
32) Persist the RAID array configuration
Run:
sudo mdadm --detail --scan > /etc/mdadm/mdadm.conf
sudo echo "MAILADDR root" >> /etc/mdadm/mdadm.conf
Update the init ramdisk:
sudo update-initramfs -u
33) Disable periodic check of RAID
sudo systemctl disable mdcheck_continue
sudo systemctl disable mdcheck_start
34) Install an essential tooling
sudo apt install cron dnsutils iputils-ping
sudo apt autoremove
35) Installation of the OS is completed
Reboot the server to verify the correctness of the OS installation.
sudo reboot
Here is a video, that recapitulates the installation process:
From operating system to Docker
In this phase, you'll not only install Docker but overall prepare the machine for the TeskaLabs LogMan.io installation.
If you've skipped the bare metal installation and run the installation in a virtual server, pay attention to the prerequisites.
Prerequisites
- Running server with installed operating system.
- Access to the server over SSH, the user is
tladminwith an permission to executesudo. - Slow storage mounted at
/data/hdd. - Fast storage mounted at
/data/ssd.
Timezone UTC
The timezone of the Operating System for TeskaLabs LogMan.io MUST be set to UTC.
Steps
1) Login into the server over SSH as an user tladmin
ssh tladmin@<ip-of-the-server>
2) Configure SSH access
Install public SSH key(s) for tladmin user:
cat > /home/tladmin/.ssh/authorized_keys
Restrict the access:
sudo vi /etc/ssh/sshd_config
Changes in the /etc/ssh/sshd_config:
PermitRootLogintonoPubkeyAuthenticationtoyesPasswordAuthenticationtono
3) Configure Linux kernel parameters
Write this contents into file /etc/sysctl.d/01-logman-io.conf
vm.max_map_count=262144
net.ipv4.ip_unprivileged_port_start=80
fs.inotify.max_user_instances=1024
fs.inotify.max_user_watches=1048576
fs.inotify.max_queued_events=16384
The parameter vm.max_map_count increase the maximum number of mmaps in Virtual Memory subsystem of Linux.
It is needed for the Elasticsearch.
The parameter net.ipv4.ip_unprivileged_port_start enabled unpriviledged processes to listen on port 80 (and more).
This is to enable NGINX to listen on this port and not require elevated priviledges.
4) Install Docker
Docker is necessary for deployment of all LogMan.io microservices in containers, namely Apache Kafka, Elasticsearch, NGINX and individual streaming pumps etc.
Create dockerlv logical volume with EXT4 filesystem:
sudo lvcreate -L100G -n dockerlv systemvg
sudo mkfs.ext4 -L docker-ssd /dev/systemvg/dockerlv
sudo mkdir /var/lib/docker
Enter the following line to /etc/fstab:
/dev/disk/by-label/docker-ssd /var/lib/docker ext4 defaults,noatime 0 1
Mount the volume:
sudo mount /var/lib/docker
Install the Docker package:
sudo apt-get install ca-certificates curl gnupg lsb-release
sudo mkdir -p /etc/apt/keyrings
curl -fsSL https://download.docker.com/linux/ubuntu/gpg | sudo gpg --dearmor -o /etc/apt/keyrings/docker.gpg
sudo chmod a+r /etc/apt/keyrings/docker.gpg
echo "deb [arch=$(dpkg --print-architecture) signed-by=/etc/apt/keyrings/docker.gpg] https://download.docker.com/linux/ubuntu $(lsb_release -cs) stable" | sudo tee /etc/apt/sources.list.d/docker.list > /dev/null
sudo apt-get update
sudo apt-get install docker-ce docker-ce-cli containerd.io docker-compose-plugin
sudo usermod -aG docker tladmin
Re-login to the server to apply the group change.
5) Disable Docker bridge network
The Docker creates an bridge network (docker0) by default, which is not needed for the TeskaLabs LogMan.io.
This is how to disable a default bridge network of the Docker.
Create file /etc/docker/daemon.json with a following content:
{
"bridge": "none"
}
6) Install Wireguard
Wireguard is a fast and the most secure VPN technology. TeskaLabs LogMan.io utilizes Wireguard for an internal communication within the cluster.
Wireguard network IP range is 172.17.10.0/24.
Each cluster node gets one IP address from this range, the first node gets 172.17.10.1, the second 172.17.10.2 and so on.
sudo apt install wireguard
sudo su -
cd /etc/wireguard/
umask 077
wg genkey > wg0.key
wg pubkey < wg0.key > wg0.pub
Create /etc/wireguard/wg0.conf with a following content.
Adjust [Peer] sections to reflect your cluster layout.
If you are installing a single-node variant, only one [Peer] section will be present.
[Interface]
PrivateKey = <content of the wg0.key file>
ListenPort = 41194
Address = 172.17.10.1/24
MTU = 1412
[Peer]
# The first node
PublicKey = <content of the wg0.pub file>
Endpoint = <IP address of the first node>:41194
AllowedIPs = 172.17.10.1/32
PersistentKeepalive = 60
[Peer]
# The second node
PublicKey = <content of the wg0.pub file from lmb2 node>
Endpoint = <IP address of the second node>:41194
AllowedIPs = 172.17.10.2/32
PersistentKeepalive = 60
sudo wg-quick up wg0
sudo systemctl enable wg-quick@wg0.service
7) Configure hostnames' resolution (optionally)
TeskaLabs LogMan.io cluster requires that each node can resolve IP address of any other cluster node from its hostname.
If the configured DNS server doesn't provide this ability, node names and their IP addresses have to be inserted into /etc/hosts.
sudo vi /etc/hosts
Example of /etc/hosts
172.17.10.1 lma1
172.17.10.2 lmb1
172.17.10.3 lmx1
Note, that IP addresses are taken from the Wireguard range.
8) Reboot the server
sudo reboot
This is important to apply all above parametrization.
TeskaLabs LogMan.io installation
Prerequisites
- Proper setup of disks and logical volumes as prescribed in previous phases.
- Configuration in
/etc/sysctl.d/01-logman-io.confis applied. - Docker is running and
tladminuser is in thedockergroup. - Make sure
/opt/sitedirectory is empty.
Info
Data will be stored in /data/hdd and /data/ssd directories.
Make sure these folders do not contain any content that might interfere with the installation.
Note
You can use the prerequisites script for a quick check of your system.
# Download the script
curl -O https://libsreg.z6.web.core.windows.net/prerequisites/prerequisites.sh -o /tmp/prerequisites.sh
# Download the corresponding SHA-256 checksum
curl -O https://libsreg.z6.web.core.windows.net/prerequisites/prerequisites.sh.sha256 -o /tmp/prerequisites.sh.sha256
# Verify the script’s integrity
(cd /tmp && sha256sum -c prerequisites.sh.sha256)
# Make the script executable and run it
chmod +x /tmp/prerequisites.sh
(cd /tmp && ./prerequisites.sh)
rm /tmp/prerequisites.sh /tmp/prerequisites.sh.sha256
First node or single node
1) Download installation script
curl -s https://lmio.blob.core.windows.net/library/lmio/install-ubuntu2204.sh -o /tmp/install-lmio.sh
2) Launch the installation
sudo bash /tmp/install-lmio.sh
Select "First core node"
Press < Continue >
Enter TeskaLabs Docker registry credentials
Press < Login > to proceed.
Note
The credentials are provided by TeskaLabs support. Please contact us, if you don't have yours.
Fill in the node id and IP address
The Node id is a hostname and it MUST be resolvable.
The IP address must be reachable from other nodes of the cluster, over Internal network. For a single node installation, use the IP address of the machine on the Froting network.
After you enter all necessary information and confirm by pressing the button, the installation proceeds. This might take from couples of minutes to half an hour. Be patient and do not stop the process.
Monitoring the installation
To monitor the Docker containers being enrolled, open second terminal and type watch docker ps -a.
3) Open the Web User Interface
TeskaLabs LogMan.io web application will be accessible on port 443 using the hostname as domain name.
In the example, https://lmio-test/.
4) The first node is installed
LogMan.io can run both as a single-node installation or in a cluster. If you run LogMan.io on a single machine only, your installation is finished. Continue to setup the your TeskaLabs LogMan.io installation to collect logs.
Second and third node
Make sure that the second respective third core node of the cluster conforms to prerequisites prescribed on the top of this page. Also ensure you can reach first node of the cluster over the network.
If ready, use this command to start the installation. Make sure you specify the ASAB Maestro version. Use the same version as on the first cluster node.
docker run -it --rm --pull always \
-v /var/run/docker.sock:/var/run/docker.sock \
-v /opt/site:/opt/site \
-v /opt/site/docker/conf:/root/.docker/ \
-v /data:/data \
-e NODE_ID=`hostname -s` \
-e ASAB_MAESTRO_VERSION=<specify version> \ #(1)
--network=host \
pcr.teskalabs.com/asab/asab-governator:stable \
python3 -m governator.bootstrap
- Make sure you specify the ASAB Maestro version. Use the same version as on the first cluster node.
When the GUI opens, select to install second/third core node.
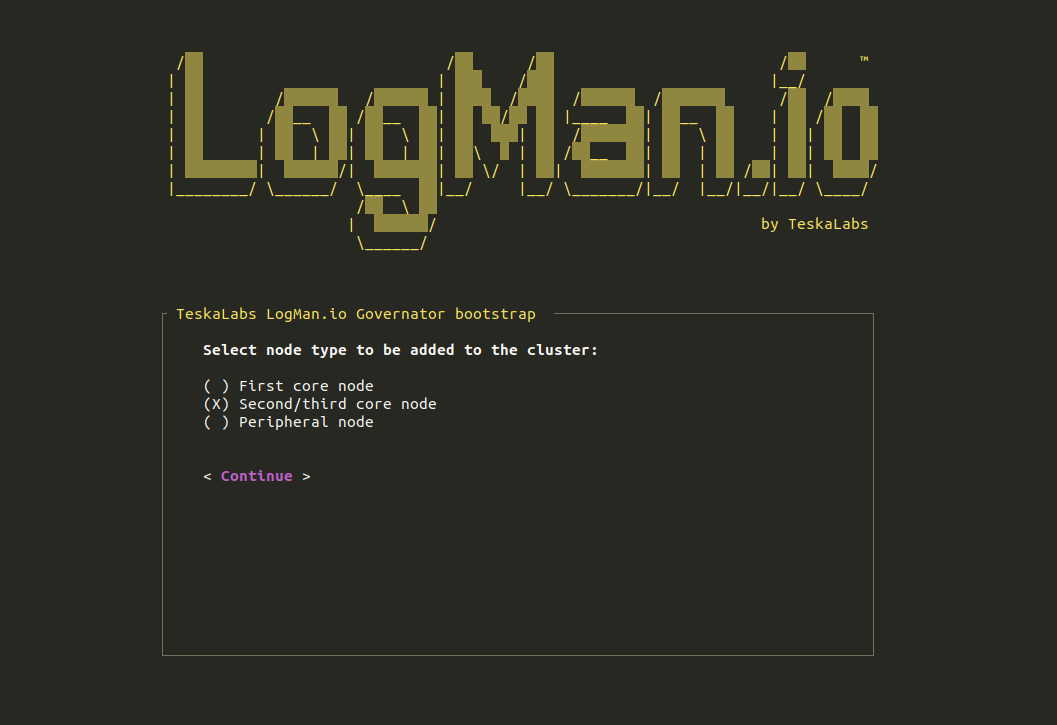
In the next screen, enter the IP address of the first cluster node to connect to.
Next screen shows current state of the Zookeeper cluster and lets you revise the hostname and ip address.
Check or correct the hostname and IP address and press Build new cluster node
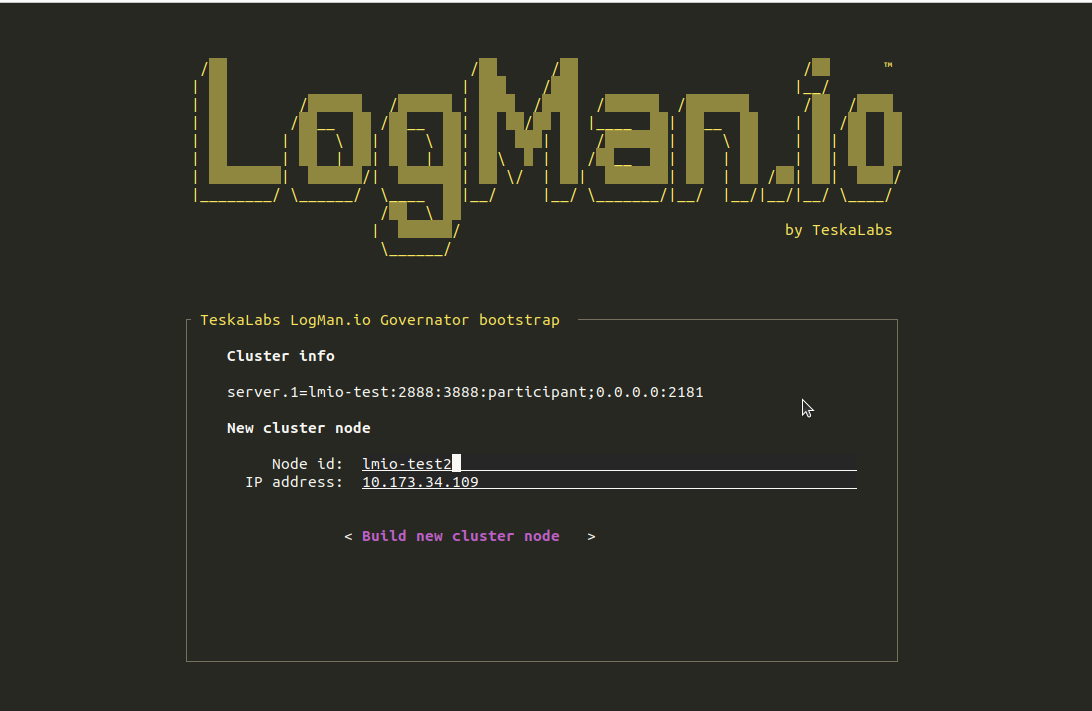
Wait for the process to finish.
The rest can be set up from the LogMan.io web application. So, log in.
There are new instances on the new cluster node (lmio-test2) running. Check it in the Services screen.
Installing arbiter/quorum node
Proceed with this settings only if you do not plan to process data on the cluster node.
Adjust the record of the node in the Zookeeper. Give it the "arbiter" role manually.
Through Tools menu, open Zoonavigator and navigate to /asab/nodes directory. Find node you want to label as arbiter and add it a role:
ip:
- XX.XX.XX.XX
roles:
- arbiter
Save the file.
Setting up the cluster
Ensure the cluster technologies are installed. Zookeeper is already installed.
Add to the new node a instance for each service:
- mongo
- elasticsearch-master
- telegraf
- lmio-collector-system
Go to the Library and open model.yaml located in the Site folder.
Search for the above listed services in the model and add instance of each on the newly installed node.
In this screenshot, you can see model.yaml file inside the Library being modified on line 9. Add node id of the newly installed node (lmio-test2) into a instances list of mongo service. Continue similarly for all above listed services. Specify elasticsearch master instance explicitely, similarly to master-1. When ready, hit Save and apply changes to the affected node.
Select the new node (lmio-test2) and hit the Apply button.
When installation is done, select one by one the remaining nodes and hit Apply. The current changes must be applied to all cluster nodes.
Install data node
If this node is meant for log collection and data processing, install instances of following services in a similar way:
- nginx
- kafka
- lmio-receiver
- lmio-depositor
- elasticsearch-hot
- elasticsearch-warm
- elasticsearch-cold
- lmio-lookupbuilder
- lmio-ipaddrproc
Round-Robin DNS balancing
Balancing of log collection is done through DNS balancing. Make sure that your DNS server can resolve to all nodes where you expect log collection.
Installation without ASAB Maestro
Installation without the Maestro orchestration requires following steps:
1) Create a folder structure
sudo apt install git
2) Create a folder structure
sudo mkdir -p \
/data/ssd/zookeeper/data \
/data/ssd/zookeeper/log \
/data/ssd/kafka/kafka-1/data \
/data/ssd/elasticsearch/es-master/data \
/data/ssd/elasticsearch/es-hot01/data \
/data/ssd/elasticsearch/es-warm01/data \
/data/hdd/elasticsearch/es-cold01/data \
/data/ssd/influxdb/data \
/data/hdd/nginx/log
Change ownership to elasticsearch data folder:
sudo chown -R 1000:0 /data/ssd/elasticsearch
sudo chown -R 1000:0 /data/hdd/elasticsearch
3) Clone the site configuration files into the /opt folder:
cd /opt
git clone https://gitlab.com/TeskaLabs/<PARTNER_GROUP>/<MY_CONFIG_REPO_PATH>
4) Login to docker.teskalabs.com.
cd <MY_CONFIG_REPO_PATH>
docker login docker.teskalabs.com
5) Enter the repository and deploy the server specific Docker Compose file
docker compose -f docker-compose-<SERVER_ID>.yml pull
docker compose -f docker-compose-<SERVER_ID>.yml build
docker compose -f docker-compose-<SERVER_ID>.yml up -d
6) Check that all containers are running
docker ps
Setting up TeskaLabs LogMan.io
Your TeskaLabs LogMan.io is freshly install and ready. Let's set it up to collect logs!
Web User Interface
The TeskaLabs LogMan.io is accessible over HTTPS on the first node of the cluster.
In this example, the URL is https://lmio-test/, type it into your web browser.
Self-signed SSL certificates
By default, TeskaLabs LogMan.io is provided with self-signed SSL certificates. Your browser will warn you about the potential security risk. It cannot verify the SSL certificate. However, it is your installation you are entering. So, accept the risk without fear and continue to the website.
You can always replace the self-signed certificates by custom certificates.
You'll be redirected to the Login screen. Contact TeskaLabs support for default credentials.
Create your credentials and suspend default admin
Initial setup of LogMan.io comes with system tenant, used for administration and system logs analysis, and default admin credentials.
To provide secure login, create new credentials with superuser role.
If you haven't configured SMTP server yet, pick up the reset password instructions from logs of seacat auth service on the server.
Make sure you can successfully log in TeskaLabs LogMan.io with new credentials.
Then, suspend default admin credentials.
Provision system collectors to system tenant
To start log collection from system collectors, provision each available system collector into the system tenant.
Customize the installation
SMTP
Domain name
Set the PUBLIC_URL parameter in the model and hit Apply.
SSL certificates
How to add custom SSL certificate
Create a first tenant
The system tenant is meant for collection of logs from LogMan.io itself only.
To start collecting logs from your IT infrastructure, create a new tenant.
In the Auth & Roles section, select Tenants and hit New tenant in the top right corner.
Create configuration for the new tenant. Name of the configuration MUST be the same as of the tenant. Select schema (ECS is default) and timezone (e.g. Europe/Prague)
Provision collector
To enable log collection, TeskaLabs LogMan.io Collector must be installed.
There are several ways how to install the Collector, choose the one that best fits your infrastructure requirements.
Continue to Log Collector to learn more.
Once the Collector installed and configured to connect to your LogMan.io instance, you will see it in the Collectors screen. Provision the Collector to the newly established tenant.
Follow the documentation on how to configure the Collector to collect logs from common sources.
How to
How to do things in LogMan.io
This is a set of quick guides on common topics for every administrator.
These guides are valid only in automated "Maestro" installations. Please, contact TeskaLabs support in other cases.
How to configure SMTP server
To allow email notifications, SMTP server connection is required.
Follow the Maintenance >> Configuration navigation in the the LogMan.io web application. Select SMTP section, provide the configuration and hit Save button.
The SMTP configuration is saved, but not active. It has to be applied to all components.
Hit Apply button accessible in the /Site folder of the Library or use commandline option.
On the host server, in the /opt/site directory, use command:
./gov.sh up
Apply the changes to all components, i.e. to all cluster nodes.
How to update Nginx certificate
compatibility note: (available in Maestro installation from version v24.38)
TeskaLabs LogMan.io installation comes with self-signed SSL certificates by default. You may want to change these to custom SSL certificates which also need to be renewed from time to time.
See how to generate CSR to your certificate authority.
Nginx certificate is stored in the Vault as nginx_certificate. Private key is stored in the Vault as nginx_private_key.
Set SSL certificate
To replace default self-signed certificates, provide both private key and certificate. First, place both files to the server. Then, send it through API to the Vault. Use these commands on any of the cluster nodes with ASAB Remote Control running:
curl -X PUT localhost:8891/vault/nginx_private_key --data-binary '@/absolute/path/to/private_key.pem'
curl -X PUT localhost:8891/vault/nginx_certificate --data-binary '@/absolute/path/to/certificate.pem'
To apply the new certificate, hit "Apply" button (or run ./gov.sh up in /opt/site) for each node with nginx service.
Renew SSL certificate
Having the certificate stored, run this command on any of the cluster nodes with ASAB Remote Control running:
curl -X PUT localhost:8891/vault/nginx_certificate --data-binary '@/absolute/path/to/certificate.pem'
To apply the new certificate, hit "Apply" button (or run ./gov.sh up in /opt/site) for each node with nginx service.
Troubleshooting
My certificate doesn't work. I want the default one back.
It may happen that after you upload custom SSL certificate, Nginx does not start due to some issues with the certificates and you lose access to the GUI. You can always let Maestro regenerate the self-signed certificate.
First, delete your custom certificate and key from the Vault:
curl -X DELETE localhost:8891/vault/nginx_private_key
curl -X DELETE localhost:8891/vault/nginx_certificate
Hit "Apply" button (or run ./gov.sh up in /opt/site) for each node with nginx service.
When Maestro cannot find these items in the Vault, it generates them and you can start Nginx again.
How to set version
How to set version of LogMan.io
TeskaLabs LogMan.io product consists of two applications, LogMan.io and ASAB Maestro.
To run LogMan.io, you need to specify both the applications and their versions in the model.
define:
type: rc/model
services:
...
applications:
- name: "ASAB Maestro"
version: v24.30.01
- name: "LogMan.io"
version: v24.30.01
Versions and version files
The version refers to a specific version file in the Library.
Version v24.30.01 of ASAB Maestro application refers to /Site/ASAB Maestro/Versions/v24.30.01.yaml version file.
Version v24.30.01 of LogMan.io application refers to /Site/LogMan.io/Versions/v24.30.01.yaml version file.
define:
type: rc/version
product: LogMan.io
version: v24.30.01
asab_maestro_library: v24.29
versions:
lmio-collector: v24.25
lmio-receiver: v24.19.01
lmio-parsec: v24.30
lmio-depositor: v24.30
lmio-alerts: v24.24
lmio-elman: v24.22-beta3
lmio-lookupbuilder: v24.30
lmio-ipaddrproc: v24.30
lmio-watcher: v24.22
system-collector: v24.25
lmio-baseliner: v24.30
lmio-correlator: v24.30.01
library lmio-common-library: v24.30.01
To change the version of LogMan.io, simply rewrite versions of the applications in the model, save model and apply changes.
Choose existing versions and ensure compatibility
Select only version files that really exist in the Library.
Make sure that versions of ASAB Maestro and LogMan.io applications are compatible.
Custom versions
Avoid custom versions
LogMan.io consists of multiple services and we test their compatibility before every release. Versions distributed by TeskaLabs are tested and strongly recommended.
We cannot guarantee compatibility of services if combinations OTHER than those in the official version files are used.
For power users who skipped the warning, here are tips on how to customize versions:
Create new version file
In the Library, create new YAML file in /Site/<application>/Versions/ folder. Keep the required version file structure and specify versions of services. If no version specified for a service, latest version will be used by default. Set the name of the new file as a version of the application in the model.
Custom Version
Suppose that a new custom version file of LogMan.io application is named custom.yaml and it is placed in /Site/LogMan.io/Versions/custom.yaml in the Library.
To apply new version file, link it in the model and hit the "Apply" button.
define:
type: rc/model
services:
...
applications:
- name: "ASAB Maestro"
version: v24.30.01
- name: "LogMan.io"
version: custom
Override version in the model
To override version file from the model, use "version" key in the declaration of a service.
In this example, the version of instance asab-iris-1 will be set to v24.36. The version in the version file /Site/ASAB Maestro/Versions/v24.30.01.yaml will be ignored.
define:
type: rc/model
services:
...
asab-iris:
instances:
- node1
version: v24.36
applications:
- name: "ASAB Maestro"
version: v24.30.01
- name: "LogMan.io"
version: v24.30.01
Setting version per instance is not recommended
It is possible to set distinct version for each instance. We do not recommend this approach, though. Running multiple instances with distinct versions leads to serious errors in most of the services.
define:
type: rc/model
services:
...
asab-iris:
instances:
1:
node: node1
version: v24.36
2:
node: node1
version: v24.25
applications:
- name: "ASAB Maestro"
version: v24.30.01
- name: "LogMan.io"
version: v24.30.01
How to connect to LDAP server
LDAP server or Active Directory can be used to enable users to log in to TeskaLabs LogMan.io seamlessly.
Specify LDAP connection by configuration of TeskaLabs SeaCat Auth (authorization server within TeskaLabs LogMan.io) in the model.
Find seacat-auth service in the model and follow this example.
Before you apply changes in the model, upload the secret (in this case LDAP_USER_PASSWORD) securely to the Vault. Only then, the secret is available when changes are being applied to the SeaCat Auth configuration.
model.yaml
define:
type: rc/model
services:
...
seacat-auth:
instances:
- node1 # List of nodes with seacat-auth instance
asab:
config:
"seacatauth:credentials:ldap:external":
uri: ldap://ad.company.cz # URI to you LDAP server
username: "CN=user,OU=Users_System,DC=company,DC=cz" # Full user name in the Active Directory
attrusername: sAMAccountName
password: "{{LDAP_USER_PASSWORD}}"
base: DC=company,DC=cz
filter: "(&(objectClass=user)(|(sAMAccountName=novakjan)(sAMAccountName=novotnypavel)))"
attributes: "mail mobile"
secrets:
LDAP_USER_PASSWORD: {}
To save the secret to the Vault, use this command on the LogMan.io host server. Make sure you replace the key and the password value according to your needs.
curl -X PUT localhost:8891/vault/LDAP_USER_PASSWORD --data 'supersecret'
Hit Apply button accessible in the /Site folder of the Library or use commandline option.
On the host server, in the /opt/site directory, use command:
./gov.sh up
Troubleshooting ASAB Maestro
Apply changes from command line
There is ./gov.sh script in the /opt/site folder on each node.
Use it to apply changes on any node.
This command applies changes in the model to the current node:
$ cd /opt/site
$ ./gov.sh up
Apply newest changes on a different node. (Replace <node_id> with the actual node ID.)
$ ./gov.sh up <node_id>
Interacting with the Docker or Podman manually
The ./gov.sh script also works exactly the same as a docker command but in the correct cluster setup.
This includes the docker compose bit.
This is useful when ASAB Maestro components are not working as expected and their UI or API is not available.
Example:
$ cd /opt/site
$ ./gov.sh compose up -d
[+] Running 6/6
✔ Container asab-config-1 Started 0.1s
✔ Container asab-remote-control-1 Started 0.1s
✔ Container zookeeper-1 Started 0.1s
✔ Container zoonavigator-1 Started 0.1s
✔ Container asab-library-1 Started 0.1s
✔ Container asab-governator-1 Started 0.1s
$
Manual update to the recent ASAB Governator
If you need to manually update the asab-governator on the particular node, this is a proper procedure:
$ cd /opt/site
$ ./gov.sh image pull docker.teskalabs.com/asab/asab-governator:stable
$ ./gov.sh compose up -d asab-governator-1
Replace asab-governator-1 with a proper instance_id on the asab-governator on the given node.
Use ./gov.sh ps -a to identify the instance_id.
Nginx can't bind to port 80
Nginx log
nginx: [emerg] bind() to 0.0.0.0:80 failed (13: Permission denied)
Solution
$ sudo sysctl -w net.ipv4.ip_unprivileged_port_start=80
Elasticsearch does not start due to virtual memory allocation
Solution
$ sudo sysctl vm.max_map_count=262144
Hardware for TeskaLabs LogMan.io
This is a hardware specification designed for vertical scalability. It is optimised for those who plan to built an initial TeskaLabs LogMan.io cluster with the lower possible cost yet with the possibility to add more hardware gradually as the cluster grows. This specification is also fully compatible with the horizontal scalability strategy, which means adding one or more new server node to the cluster.
Specifications
- Chasis: 2U
- Front HDD trays: 12 drive bays, 3.5", SATA/SAS, for Data HDDs, hot-swap
- Rear HDD trays: 2 drive bays, 2.5", SATA, for OS HDDs, hot-swap
- CPU: 1x AMD EPYC 32 Cores
- RAM: 256GB DDR4 3200, using 64GB modules
- Data SSD: 2x 4TB SSD NVMe, M.2, PCIe 3.0+
- Data SSD controller: NVMe PCIe 3.0+ riser card, no RAID; or use motherboard NVMe slots
- Data HDD: 3x 20TB SATA 2/3+ or SAS 1/2/3+, 6+ Gb/s, 7200 rpm
- Data HDD controller: HBA or IT mode card, SATA or SAS, JBOD, no RAID, hot-swap
- OS HDD: 2x 256GB+ SSD SATA 2/3+, HBA, no RAID, directly attached to motherboard SATA
- Network card: 2x (dual) 1Gbps Ethernet NIC; or 1x dual port
- Power supply: Redundant 920W
- IPMI or equivalent
Note
RAID is implemented in software, respective in Operating System.
Vertical scalability
- Add one more CPU (2 CPUs in total), a motherboard with 2 CPU slots is required for this option
- Add RAM up to 512GB
- Add up to 9 additional Data HDDs, maximum 220 TB space using 12x 20 TB HDDs in RAID5
- Replace the network card with dual 10Gbps Ethernet NIC (or better)
Note
3U and 4U variants are also available with 16 respective 24 drive bays.
Last update: Aug 2024
Data Storage
TeskaLabs LogMan.io operates with several different storage tiers in order to deliver optimal data isolation, performance and the cost.
Data storage structure
Schema: Recommended structure of the data storage.
Fast data storage
Fast data storage (also known as 'hot' tier) contains the most fresh logs and other events received into the TeskaLabs LogMan.io. We recommend to use the fastest possible storage class for the best throughput and search performance. The real-time component (Apache Kafka) also uses fast data storage for the stream persistency.
- Recommended time span: a one day to one week
- Recommended size: 2TB - 4TB
- Recommended redundancy: RAID 1, additional redundancy is provided by the application layer
- Recommended hardware: NVMe SSD PCIe 4.0 and better
- Fast data storage physical devices MUST BE managed by mdadm
- Mount point:
/data/ssd - Filesystem: EXT4,
noatimeflag is recommended to be set for an optimum performance
Backup strategy
Incoming events (logs) are copied into the archive storage once they enter TeskaLabs LogMan.io. It means that there is always the way how to "replay" events into the TeskaLabs LogMan.in in case of need. Also, data are replicated to other nodes of the cluster immediately after arrival to the cluster. For this reason, traditional backup is not recommended but possible.
The restoration is handled by the cluster components by replicating the data from other nodes of the cluster.
Example
/data/ssd/kafka-1
/data/ssd/elasticsearch/es-master
/data/ssd/elasticsearch/es-hot1
/data/ssd/zookeeper-1
/data/ssd/influxdb-2
...
Slow data storage
The slow storage contains data, that does not have to be quickly accessed, and usually contain older logs and events, such as warm and cold indices for Elasticsearch.
- Recommended redundancy: software RAID 6 or RAID 5; RAID 0 for virtualized/cloud instances with underlying storage redundancy
- Recommended hardware: Cost-effective hard drives, SATA 2/3+, SAS 1/2/3+
- Typical size: tens of TB, e.g. 18TB
- Controller card: SATA or HBA SAS (IT Mode)
- Slow data storage physical devices MUST BE managed by software RAID (mdadm)
- Mount point:
/data/hdd - Filesystem: EXT4,
noatimeflag is recommended to be set for an optimum performance
Calculation of the cluster capacity
This is a formula how to calculate total available cluster capacity on the slow data storage.
total = (disks-raid) * capacity * servers / replica
disksis a number of slow data storage disk per serverraidis a RAID overhead, 1 for RAID5 and 2 for RAID6capacityis a capacity of the slow data storage diskserversis a number of serversreplicais a replication factor in Elasticsearch
Example
(6[disks]-2[raid6]) * 18TB[capacity] * 3[servers] / 2[replica] = 108TB
Backup strategy
The data stored on the slow data storage are ALWAYS replicated to other nodes of the cluster and also stored in the archive. For this reason, traditional backup is not recommended but possible (consider the huge size of the slow storage).
The restoration is handled by the cluster components by replicating the data from other nodes of the cluster.
Example
/data/hdd/elasticsearch/es-warm01
/data/hdd/elasticsearch/es-warm02
/data/hdd/elasticsearch/es-cold01
/data/hdd/mongo-2
/data/hdd/nginx-1
...
Large slow data storage strategy
If your slow data storage will be larger than >50 TB, we recommend to employ HBA SAS Controllers, SAS Expanders and JBOD as the optimal strategy for scaling slow data storage. SAS storage connectivity can be daisy-chained to enable large number of drives to be connected. External JBOD chassis can be also connected using SAS to provide housing for additional drives.
RAID 6 vs RAID 5
RAID 6 and RAID 5 are both types of RAID (redundant array of independent disks) that use data striping and parity to provide data redundancy and increased performance.
RAID 5 uses striping across multiple disks, with a single parity block calculated across all the disks. If one disk fails, the data can still be reconstructed using the parity information. However, the data is lost if a second disk fails before the first one has been replaced.
RAID 6, on the other hand, uses striping and two independent parity blocks, which are stored on separate disks. If two disks fail, the data can still be reconstructed using the parity information. RAID 6 provides an additional level of data protection compared to RAID 5. However, RAID 6 also increases the overhead and reduces the storage capacity because of the two parity blocks.
Regarding slow data storage, RAID 5 is generally considered less secure than RAID 6 because the log data is usually vital, and two disk failures could cause data loss. RAID 6 is best in this scenario as it can survive two disk failures and provide more data protection.
In RAID 5, the number of disks required is (N-1) disks, where N is the number of disks in the array. This is because one of the disks is used for parity information, which is used to reconstruct the data in case of a single disk failure. For example, if you want to create a RAID 5 array with 54 TB of storage, you would need at least four (4) disks with a capacity of at least 18 TB each.
In RAID 6, the number of disks required is (N-2) disks. This is because it uses two sets of parity information stored on separate disks. As a result, RAID 6 can survive the failure of up to two disks before data is lost. For example, if you want to create a RAID 6 array with 54 TB of storage, you would need at least five (5) disks with a capacity of at least 18 TB each.
It's important to note that RAID 6 requires more disk space as it uses two parity blocks, while RAID5 uses only one. That's why RAID 6 requires additional disks as compared to RAID 5. However, RAID 6 provides extra protection and can survive two disk failures.
It is worth mentioning that the data in slow data storage are replicated across the cluster (if applicable) to provide additional data redundancy.
Tip
Use Online RAID Calulator to calculate storage requirements.
System storage
The system storage is dedicated for an operation system, software installations and configurations. No operational data are stored on the system storage. Installations on virtualization platforms uses commonly available locally redundant disk space.
- Recommended size: 250 GB and more
- Recommend hardware: two (2) local SSD disks in software RAID 1 (mirror), SATA 2/3+, SAS 1/2/3+
If applicable, following storage parititioning is recommended:
- EFI partition, mounted at
/boot/efi, size 1 GB - Swap partition, 64 GB
- Software RAID1 (mdadm) over rest of the space
- Boot partition on RAID1, mounted at
/boot, size 512 MB, ext4 filesystem - LVM partition on RAID1, rest of the available space with volume group
systemvg - LVM logical volume
rootlv, mounted at/, size 50 GB, ext4 filesystem - LVM logical volume
loglv, mounted at/var/log, size 50 GB, ext4 filesystem - LVM logical volume
dockerlv, mounted at/var/lib/docker, size 100 GB, ext4 filesystem (if applicable)
Backup strategy for the system storage
It is recommended to periodically backup all filesystems on the system storage so that they could be used for restoring the installation when needed. The backup strategy is compatible with most common backup technologies in the market.
- Recovery Point Objective (RPO): full backup once per week or after major maintenance work, incremental backup one per day.
- Recovery Time Objective (RTO): 12 hours.
Note
RPO and RTO are recommended, assuming highly available setup of the LogMan.io cluster. It means three and more nodes so that the complete downtime of the single node don't impact service availability.
Archive data storage
Data archive storage is recommended but optional. It serves for a very long data retention periods and redundancy purposes. It also represents economical way of long-term data storage. Data are not available online in the cluster, they has to be restored back when needed, which is connected with a certain "time-to-data" interval.
Data are compressed when copied into the archive, the typical compression ratio is in range from 1:10 to 1:2, depending on the nature of the logs.
Data are replicated into the storage after initial consolidation on the fast data storage, practically immediately after ingesting into a cluster.
- Recommended technologies: SAN / NAS / Cloud cold storage (AWS S3, MS Azure Storage)
- Mount point:
/data/archive(if applicable)
Note
Public clouds can be used as a data archive storage. Data encryption has to be enabled in such a case to protect data from unauthorised access.
Dedicated archive nodes
For large archives, dedicated archive nodes (servers) are recommended. These nodes should use HBA SAS drive connectivity and storage-oriented OS distributions such as Unraid or TrueNAS.
Data Storage DON'Ts
- We DON'T recommend use of NAS / SAN storage for data storages
- We DON'T recommend use of hardware RAID controllers etc. for data storages
The storage administration
This chapter provides a practical example of the configuration of the storage for TeskaLabs LogMan.io. You don't need to configure or manage the LogMan.io storage unless you have a specific reason for it, the LogMan.io is delivered in fully configured state.
Assuming following hardware configuration:
- SSD drives for a fast data storage:
/dev/nvme0n1,/dev/nvme1n1 - HDD drives for a slow data storage:
/dev/sde,/dev/sdf,/dev/sdg
Tip
Use lsblk command to monitor the actual status of the storage devices.
Create a software RAID1 for a fast data storage
mdadm --create /dev/md2 --level=1 --raid-devices=2 /dev/nvme0n1 /dev/nvme1n1
mkfs.ext4 /dev/md2
mkdir -p /data/ssd
Add mount points into /etc/fstab:
/dev/md2 /data/ssd ext4 defaults,noatime 0 2
Mount data storage filesystems:
mount /data/ssd
Tip
Use cat /proc/mdstat to check the state of the software RAID.
Create a software RAID5 for a slow data storage
mdadm --create /dev/md1 --level=5 --raid-devices=3 /dev/sde /dev/sdf /dev/sdg
mkfs.ext4 /dev/md1
mkdir -p /data/hdd
Note
For RAID6 use --level=6.
Add mount points into /etc/fstab:
/dev/md1 /data/hdd ext4 defaults,noatime 0 2
Mount data storage filesystems:
mount /data/hdd
Grow the size of a data storage
With ever increasing data volumes, it is highly likely that you need to grow (aka extend) the data storage, either on fast or slow data storage. It is done by adding a new data volume (eg. physical disk or virtual volume) to the machine - or on some virtualized solutions - by growing an existing volume.
Note
The data storage could be extended without any downtime.
Slow data storage grow example
Assuming that you want to add a new disk /dev/sdh to a slow data storage /dev/md1:
mdadm --add /dev/md1 /dev/sdh
The new disk is added as a spare device.
You can check the state of the RAID array by:
cat /proc/mdstat
The (S) behind the device means spare device.
The grow the RAID to the spare devices:
mdadm --grow --raid-devices=4 /dev/md1
Number 4 needs to be adjusted to reflect the actual RAID setup.
Grow the filesystem:
resize2fs /dev/md1
Networking
This documentation section is designed to guide you through the process of setting up and managing the networking of TeskaLabs LogMan.io. To ensure seamless functionality, it is important to follow the prescribed network configuration described below.
Schema: Network overview of the LogMan.io cluster.
Fronting network
The fronting network is a private L2 or L3 segment that serves for log collection. For that reason, it has to be accessible from all log sources.
Each node (server) has a dedicated IPv4 address on a fronting network. IPv6 is also supported.
Fronting network must be available at all locations of the LogMan.io cluster.
User network
The user network is a private L2 or L3 segment that serves for a user access to Web User Interface. For that reason, it has to be accessible for all users.
Each node (server) has a dedicated IPv4 address on a user network. IPv6 is also supported.
User network must be available at all locations of the LogMan.io cluster.
Internal network
The internal network is a private L2 or L3 segment that is used for private cluster communication. It MUST BE dedicated to the TeskaLabs LogMan.io to maintain the security envelope of the cluster. The internal network must provide the encryption if it is operated in the shared environment (ie as VLAN). This is critical requirement for a security of the cluster.
Each node (server) has a dedicated IPv4 address on an internal network. IPv6 is also supported.
Additionally, IPMI of hardware nodes can be exposed to this network, on the additional IP address (both IPv4 and IPv6).
Internal network must be available at all locations of the LogMan.io cluster.
Containers running on the node use "network mode" set to "host" on the internal network. It means that container’s network stack is not isolated from the node (host), and the container does not get its own IP address.
Administrators MAY access the internal network using VPN.
Connectivity
Each node (aka server) has following connectivity requirement:
Fronting network
- Minimal: 1Gbit NIC
- Recommended: 2x bonded 10Gbit NIC
User network
- Minimal: shared with the fronting network
- Recommended: 1Gbit NIC
Internal network
- Minimal: No NIC, internal only for a single node installations, 1Gbit
- Recommended: 2x bonded 10Gbit NIC
- IPMI if available at the server level
Internet connectivity (NAT, Firewalled, behind proxy server) using Fronting network OR Internal network.
Communication
Fronting network
| Source | Destination | Protocol | Port | Note |
|---|---|---|---|---|
| LogMan.io node | DNS servers | udp | 53 | Based on the configuration |
| LogMan.io node | DNS servers | tcp | 53 | Based on the configuration |
| LogMan.io node | NTP servers | udp | 123 | Based on the configuration |
| LogMan.io node | SMTP server | tcp | 25 | Plain text (non-encrypted) traffic, not recommended |
| LogMan.io node | SMTP server | tcp | 465 | Encrypted using STARTTLS |
| LogMan.io node | SMTP server | tcp | 587 | Encrypted using SMTPS |
| LogMan.io node | LDAP server | tcp | 389 | Plain text (non-encrypted) traffic, not recommended |
| LogMan.io node | LDAP server | tcp | 686 | Encrypted using LDAPS |
| LogMan.io node | LDAP server | tcp | 3268 | Plain text (non-encrypted) traffic, not recommended |
| LogMan.io node | LDAP server | tcp | 3269 | Encrypted using LDAPS |
| Log collector | LogMan.io node | tcp | 443 | Encrypted using Mutual TLS 1.2 |
| Log collector | LogMan.io node | udp | 41194 | VPN (optional) |
| LogMan.io node | Slack servers | tcp | 443 | Notifications (optional) |
| LogMan.io node | MS Teams servers | tcp | 443 | Notifications (optional) |
| LogMan.io node | Sentry.io | tcp | 443 | System telemetry (optional) |
| LogMan.io node | Uptime Robot | tcp | 443 | System availability (optional) |
| LogMan.io node | Update of software | tcp | 443 | docker.teskalabs.com, pcr.teskalabs.com, rcr.teskalabs.com, registry-1.docker.io, auth.docker.io, production.cloudflare.docker.com, asabwebui.z16.web.core.windows.net, webappsreg.z6.web.core.windows.net, webappsreg-secondary.z6.web.core.windows.net |
| LogMan.io node | Update of content | tcp | 443 | libsreg.z6.web.core.windows.net, libsreg-secondary.z6.web.core.windows.net (optional) |
| LogMan.io node | Update of OS | tcp | 443, 80 | archive.ubuntu.com, security.ubuntu.com, cz.archive.ubuntu.com |
Tip
Every outgoing HTTPS communication can use a proxy server. Configure your proxy server to allow traffic to specified domain names.
User network
| Source | Destination | Protocol | Port | Note |
|---|---|---|---|---|
| Users | LogMan.io node | tcp | 443 | |
| Users | LogMan.io node | tcp | 80 | Only for forwarding to HTTPS (optional) |
Tip
The user access is ballanced using Round-robin DNS.
Internal network
| Source | Destination | Protocol | Port | Note |
|---|---|---|---|---|
| LogMan.io node | LogMan.io node | udp | 41194 | VPN |
| Administrators | LogMan.io node | tcp | 22 | SSH (optional) |
| Administrators | IPMI | tcp | 443 | On dedicated ethernet port / IP address (optional) |
Log collector
| Source | Destination | Protocol | Port | Note |
|---|---|---|---|---|
| Log collector | DNS servers | udp | 53 | |
| Log collector | DNS servers | tcp | 53 | |
| Log collector | NTP servers | udp | 123 | |
| Log collector | LogMan.io node | tcp | 443 | Encrypted using Mutual TLS 1.2 |
| Log collector | LogMan.io node | udp | 41194 | VPN (optional) |
| Administrators | Log collector | tcp | 22 | SSH přístup administrátorů (volitelně) |
| Log collector | Update of software | tcp | 443 | docker.teskalabs.com, pcr.teskalabs.com, rcr.teskalabs.com, registry-1.docker.io, auth.docker.io, production.cloudflare.docker.com (optional) |
| Log collector | Update of OS | tcp | 443 | archive.ubuntu.com, security.ubuntu.com (optional) |
Syslog
| Source | Destination | Protocol | Port | Note |
|---|---|---|---|---|
| Log sources | Log collector | tcp | 514 | Syslog |
| Log sources | Log collector | udp | 514 | Syslog |
| Log sources | Log collector | tcp | 1514 | Syslog |
| Log sources | Log collector | udp | 1514 | Syslog |
| Log sources | Log collector | tcp | 6514 | Syslog with SSL / TLS (autodetection, can be used as plain TCP too) |
| Log sources | Log collector | udp | 6514 | Syslog with DTLS |
| Log sources | Log collector | udp | 20514 | REPL |
| Log sources | Log collector | tcp | 10000…14099 | Custom log source port range (optional) |
| Log sources | Log collector | udp | 10000…14099 | Custom log source port range (optional) |
Microsoft
| Source | Destination | Protocol | Port | Note |
|---|---|---|---|---|
| MS Windows | Log collector | tcp | 5986 | Log collection from Microsoft Windows using WEF, HTTPS (optional) |
| MS Windows | Log collector | tcp | 5985 | Log collection from Microsoft Windows using WEF, Kerberos (optional) |
| MS Windows | Log collector | tcp | 88 | Kerberos authorization version 5 for WEF (optional) |
| MS Windows | Log collector | udp | 88 | Kerberos authorization version 5 for WEF (optional) |
| Log collector | KDC, MS AD | tcp | 88 | Kerberos authorization version 5 for WEF (optional) |
| Log collector | KDC, MS AD | udp | 88 | Kerberos authorization version 5 for WEF (optional) |
| Log collector | Microsoft 365 | tcp | 443 | Log collection from Microsoft 365 (optional) |
ODBC
For log collection from database systems, ODBC is employed.
| Source | Destination | Protocol | Port | Note |
|---|---|---|---|---|
| Log collector | Oracle Database | tcp | 1521 | |
| Log collector | Microsoft SQL | tcp | 1433 | |
| Log collector | Microsoft SQL | udp | 1434 | |
| Log collector | MySQL | tcp | 3306 | |
| Log collector | PostgreSQL | tcp | 5432 |
SNMP
| Source | Destination | Protocol | Port | Note |
|---|---|---|---|---|
| SNMP trap sources | Log collector | udp | 161 | SNMP |
SSL Server Certificate
The fronting network and the user network exposes web interfaces over HTTPS on the port TCP/443. For this reason, the LogMan.io needs an SSL Server certificate.
It could be either:
- self-signed SSL server certificate
- SSL server certificate issued by the Certificate Authority operated internally by the user
- SSL server certificate issued by a public (commercial) Certificate Authority
Tip
You can use XCA tool to generate or verify your SSL certificates.
Self-signed certificate
This option is suitable for very small deployments.
Users will get warnings from thier browsers when accessing LogMan.io Web interface.
Also insecure flags needs to be used in collectors.
Create a self-signed SSL certificate using OpenSSL command-line
openssl req -x509 -newkey ec -pkeyopt ec_paramgen_curve:secp384p1 \
-keyout key.pem -out cert.pem -sha256 -days 3650 -nodes \
-subj "/CN=logman.int"
This command will create key.pem (a private key) and cert.pem (a certificate), for internal domain name logman.int.
Certificate from Certificate Authority
Parameters for the SSL Server certificate:
- Private key: EC 384 bit, curve secp384p1 (minimum), alternatively RSA 2048 (minimum)
- Subject Common name
CN: Fully Qualified Domain Name of the LogMan.io user Web UI - X509v3 Subject Alternative Name: Fully Qualified Domain Name of the LogMan.io user Web UI set to "DNS"
- Type: End Entity, critical
- X509v3 Subject Key Identifier set
- X509v3 Authority Key Identifier set
- X509v3 Key Usage: Digital Signature, Non Repudiation, Key Encipherment, Key Agreement
- X509v3 Extended Key Usage: TLS Web Server Authentication
Example of SSL Server certificate for http://logman.example.com/
Certificate:
Data:
Version: 3 (0x2)
Serial Number: 6227131463912672678 (0x566b3712dc2c4da6)
Signature Algorithm: ecdsa-with-SHA256
Issuer: CN = logman.example.com
Validity
Not Before: Nov 16 11:17:00 2023 GMT
Not After : Nov 15 11:17:00 2024 GMT
Subject: CN = logman.example.com
Subject Public Key Info:
Public Key Algorithm: id-ecPublicKey
Public-Key: (384 bit)
pub:
04:79:e2:9f:69:cb:ac:f5:3f:93:43:56:a5:ac:d7:
cf:97:f9:ba:44:ee:9b:53:89:19:fd:91:02:0d:bd:
59:41:d6:ec:c6:2b:01:33:03:b6:3e:4a:1d:f4:e9:
2c:3f:af:49:92:79:9c:00:0b:0b:e3:28:7b:13:33:
b4:ac:88:d7:9c:0a:7b:95:90:09:a2:f7:aa:ce:7c:
51:3e:3a:94:af:a8:4b:65:4f:82:90:6a:2f:a9:57:
25:6f:5f:80:09:4c:cb
ASN1 OID: secp384r1
NIST CURVE: P-384
X509v3 extensions:
X509v3 Basic Constraints: critical
CA:FALSE
X509v3 Subject Key Identifier:
49:7A:34:F8:A6:EB:6D:8E:92:42:57:BB:EB:2D:B3:82:F4:98:9D:17
X509v3 Authority Key Identifier:
49:7A:34:F8:A6:EB:6D:8E:92:42:57:BB:EB:2D:B3:82:F4:98:9D:17
X509v3 Key Usage:
Digital Signature, Non Repudiation, Key Encipherment, Key Agreement
X509v3 Extended Key Usage:
TLS Web Server Authentication
X509v3 Subject Alternative Name:
DNS:logman.example.com
Signature Algorithm: ecdsa-with-SHA256
Signature Value:
30:64:02:30:16:09:95:f4:04:1b:99:f4:06:ef:1e:63:4e:aa:
1d:21:b0:b1:31:c1:84:9a:a9:55:c6:14:bd:a1:62:c5:14:14:
35:73:da:8b:a8:7b:f2:f6:4c:8c:b0:6b:72:79:5f:4c:02:30:
49:6f:ef:05:0f:dd:28:fb:26:f8:76:71:01:f3:e4:da:63:72:
17:db:96:fb:5c:09:43:f8:7b:3b:a1:b6:dc:23:31:66:5d:23:
18:94:0b:e4:af:8b:57:1e:c3:3d:93:6f
Generate a CSR
If the Certificate Authority requires CSR to be submitted to receive a SSL certificate, follow this procedure:
1. Generate a private key:
openssl genpkey -algorithm EC -pkeyopt ec_paramgen_curve:secp384p1 -out key.pem
This command will create key.pem with the private key.
2. Create CSR using generated private key:
openssl req -new -key key.pem -out csr.pem -subj "/CN=logman.example.com"
This command will produce csr.pem file with that Certificate Signing Request.
Replace logman.example.com with the FQDN (domain name) of the LogMan.io deployment.
3. Submit the CSR to a Certificate Authority
The Certificate Authority will generate a certificate, store it in a cert.pem in a PEM format.
Cluster
TeskaLabs LogMan.io can be deployed into a single server (aka "node") or in a cluster setup. TeskaLabs LogMan.io supports also geo-clustering.
Geo-clustering
Geo-clustering is a technique used to provide redundancy against failures by replicating data, and services across multiple geographic locations. This approach aims to minimize the impact of any unforeseen failures, disasters, or disruptions that may occur in one location, by ensuring that the system can continue to operate without interruption from another location.
Geo-clustering involves deploying multiple instances of the LogMan.io across different geographic regions or data centers, and configuring them to work together as a single logical entity. These instances are linked together using a dedicated network connection, which enables them to communicate and coordinate their actions in real-time.
One of the main benefits of geo-clustering is that it provides a high level of redundancy against failures. In the event of a failure in one location, the remaining instances of the system take over and continue to operate without disruption. This not only helps to ensure high availability (HA) and uptime, but also reduces the risk of data loss and downtime.
Another advantage of geo-clustering is that it can provide better performance and scalability by enabling load balancing and resource sharing across multiple locations. This means that resources can be dynamically allocated and adjusted to meet changing demands, ensuring that the system is always optimized for performance and efficiency.
Overall, geo-clustering is a powerful technique that helps to ensure high availability, resilience, and scalability for their critical applications and services. By replicating resources across multiple geographic locations, organizations can minimize the impact of failures and disruptions, while also improving performance and efficiency.
Locations
Location "A"
Location "A" is the first location to be build. In the single node setup, it is also the only location.
Node lma1 is the first server to built of the cluster.
Nodes in this location are named "Node lmaX". X is a sequence number of the server (eg 1, 2, 3, 4 and so on).
If you run out of numbers, continue with small letters (eg. a, b, c and so on).
Please refer to the recommended hardware specification for details about nodes.
Location B, C, D and so on
Location B (and C, D and so on) are next locations of the cluster.
Nodes in these locations are named "Node lmLX".
L is a small letter that represents location in the alphabetical order (eg a, b, c).
X is a sequence number of the server( eg 1, 2, 3, 4 and so on).
If you run out of numbers, continue with small letters (eg. a, b, c and so on).
Please refer to the recommended hardware specification for details about nodes.
Coordinating location "X"
The cluster MUST have odd number of locations to avoid Split-brain problem.
For that reason, we recommend to build a small, coordinating location with one node (Node lmx1).
We recommend to use virtualization platform for "Node x1", not a physical hardware.
No data (logs, events) are stored at this location.
Types of nodes
Core node
First three nodes in the cluster are called code nodes. Core nodes form the consensus within the cluster, ensuring consistency, and coordinating activities across the cluster.
Peripheral nodes
Peripheral nodes are these nodes that don't participate in the consensus of the cluster.
Cluster layouts
Schema: Example of the cluster layout.
Single node "cluster"
Node: lma1 (Location a, Server 1).
Two big and one small node
Nodes: lma1, lmb1 and lmx1.
Thee nodes, three locations
Nodes: lma1, lmb1 and lmc1.
Four big and one small node
Nodes: lma1, lma2, lmb1, lmb2 and lmx1.
Six nodes, three locations
Nodes: lma1, lma2, lmb1, lmb2, lmc1 and lmc2.
Bigger clusters
Bigger clusters typically introduce a specialization of nodes.
Log Collector
TeskaLabs LogMan.io Collector
This is the administration manual for the TeskaLabs LogMan.io Collector. It describes how to install and administer the collector.
For more details about how to collect logs continue to the reference manual.
Installation of TeskaLabs LogMan.io Collector
This short tutorial explains how to connect a new log collector running as a virtual machine.
Tip
If you are using a hardware TeskaLabs LogMan.io Collector, connect the monitor via HDMI and go straight to step 5.
-
Download the virtual machine image.
Select download link based on your virtualization technology:
-
Import the downloaded image to your virtualization platform.
-
Configure network settings of a new virtual machine
Requirements:
- The virtual machine must be able to reach the TeskaLabs LogMan.io installation.
- The virtual machine must be reachable from devices that will ship logs into TeskaLabs LogMan.io.
-
Launch the virtual machine.
-
Determine the identity of TeskaLabs LogMan.io Collector.
The identity consists of 16 letters and digits. Please save this for the following steps.
-
Open the LogMan.io web application in your browser.
Follow this link or navigate to "Collectors" and click on the "Provisioning" button.
-
Enter the collector identity from step 4 in the box.
Then, click Provision to connect the collector and start collecting logs.
-
TeskaLabs LogMan.io Collector is successfully connected and collects logs.
Tip
The green circle on the left indicates that the log collector is online. The blue line indicates how many logs the collector has received in the last 24 hours.
Administration inside the VM
Administrative actions in the Virtual Machine of TeskaLabs LogMan.io Collector are available in the menu. Press "M" to access it. Use arrow keys and Enter to navigate and select actions.
Available options are:
- Power down
- Reboot
- Network configuration
Tip
We recommend to use Power down feature to safely turn off the collector's virtual machine.
Additional notes
You can connect unlimited amount of log collectors, e.g. to collect from different sources or to collect different types of logs.
Supported virtualization technologies
The TeskaLabs LogMan.io Collector supports the following virtualization technologies:
- VMWare
- Oracle VirtualBox
- Microsoft Hyper-V
- Qemu
Virtual Machine
TeskaLabs LogMan.io collector is provided as an pre-installed virtual machine image (OVA file).
Minimal specifications
- 2 vCPU
- RAM: 2 GB
- OS data storage: 16 GB, thick provisioning
- Buffer data storage: 20 - 500 GB (depends on incoming EPS), thin provisioning
- 1x NIC, preferably 1Gbps
- OS: Linux
Note
For environments with higher loads, the virtual machine should be scaled up accordingly.
Network
The collector must be able to connect to a TeskaLabs LogMan.io installation over HTTPS (WebSocket) using its URL.
We recommend to assign static IP address to the collector virtual machine because it will be used in the many configurations of log sources.
Custom installation
TeskaLabs LogMan.io collector can be also installed into a new virtual machine using an installation script.
Supported OS:
- Ubuntu Server 22.04.4 LTS
- RedHat/CentOS 7
Advanced administration
This section describes an administration of the pre-installed virtual machine of TeskaLabs LogMan.io collector, done from the command line.
Starting and stopping the collector
To start a stopped collector, type:
# service lmio-collector start
To stop a collector, type:
# service lmio-collector stop
Upgrade to a new stable release
# docker pull pcr.teskalabs.com/lmio/lmio-collector:stable
# service lmio-collector restart
# docker stop lmio-collector-cntrl
Note
Upgrade of the collector is triggered automatically every night.
Enble SSH access
service ssh start
Access: ssh tladmin@<collector-ip>
Tip
Make sure that the password is set to tladmin user.
Run a collector in the foreground
# service lmio-collector stop
# docker run \
--rm \
--name lmio-collector \
-v /conf:/conf \
-v /data:/data \
--net=host\
pcr.teskalabs.com/lmio/lmio-collector:stable
Press Ctrl-C to terminate the collector.
To launch collector in the background execute:
# service lmio-collector start
Event Lanes
Introduction to event lanes
Event lanes define the data flow in TeskaLabs LogMan.io, from log collection to storage in the Elasticsearch database. They specify the parsing rules, enabled content, and classification for the data.
Data flow through TeskaLabs LogMan.io
The following example illustrates the standard flow of logs (or events) through TeskaLabs LogMan.io.
- Collecting the raw events: Logs (events) are collected by LogMan.io Collector and sent to the central LogMan.io cluster.
- Archiving the raw events: LogMan.io Receiver stores raw events in Archive. Archive is an immutable database for long-term storage of the incoming logs. Raw logs can be retrieved from there and used for further analysis.
- Parsing the events: Raw logs are consumed from Archive and sent for parsing. First, they arrive in the Kafka
receivedtopic. LogMan.io Parsec consumes raw logs from thereceivedKafka topic and applies selected parsing rules.- Successfully parsed events continue to the Kafka
eventstopic. LogMan.io Depositor consumes parsed events from Kafka and stores them in the Elasticsearcheventsindex. - When parsing fails, events become unparsed and continue to the Kafka
otherstopic. LogMan.io Depositor consumes unparsed events from Kafka and stores them in the Elasticsearchothersindex.
- Successfully parsed events continue to the Kafka
Event lanes
When a new log source is connected and a new data stream is assigned to it, TeskaLabs LogMan.io automatically creates a new event lane for it. An event lane describes:
- what parsing rules will be applied to the data stream
- what dashboards, reports, and other content in the Library will be enabled for the tenant that owns the data stream
- classification of the data stream (vendor, product, category, etc.)
- a data source used in the Discover screen
- what Kafka topics and Elasticsearch indices will be used for that data stream
Every event lane belongs to a single tenant only. Two tenants cannot share the same event lane.
Creating new event lanes
Here you can learn how to create a new event lane and select the proper parsing rules for it.
An event lane and its properties (parsing rules, content, log categorization, etc.) are based on data streams. TeskaLabs LogMan.io automatically assigns an event lane based on the name of the data stream and event lane templates.
There are two cases for connecting a new log source:
-
When you connect a log source for which the content is already provided in the Library, an event lane is created based on the relevant event lane template and the data stream name you provide.
-
When you connect a log source for which the content is not provided, an event lane is created, but it does not provide any content, categorization, or parsing rules. These have to be created and specified in the event lane declaration.
Data streams
Data in TeskaLabs LogMan.io is organized into data streams. A data stream is a collection of logs (events) from a log source that share the same type and structure.
Logs in a single data stream are not necessarily connected to a single log device. There can be many log devices that produce logs of the same type.
For example, you can have five different log devices that produce data in the same (or similar) format (e.g., Linux servers):
<123> Dec 12 12:20:00 host-1 process: ...
<123> Dec 12 12:20:00 host-2 process: ...
<123> Dec 12 12:20:00 host-3 process: ...
<123> Dec 12 12:20:00 host-4 process: ...
<123> Dec 12 12:20:00 host-5 process: ...
In this case, you can select a single data stream for these log devices and consider all log devices a single log source. However, when one of the log devices produces logs of a different type:
<123>1 2024-12-12T12:20:00.000001 host-x process tag: ...
you should consider it a different log source and create a separate data stream for it, so that different parsing rules can be applied.
How to name a data stream? (1/2)
Stream names are used as a reference for LogMan.io to choose the correct event lane. Therefore, selecting a proper stream name is crucial!
A stream name is typically composed of a vendor name, technology, and numeric identification. Here are some examples of stream names:
cisco-asa-1
cisco-asa-2
linux-rsyslog-1
microsoft-365-1
synology-nas-1
Read more about how to select a proper stream name below.
Generic data stream
After you install LogMan.io Collector and connect log sources, all data is collected into a single generic stream. They are stored in Archive and Elasticsearch. No specific parsing rules are applied to events in the generic stream.
To apply specific parsing rules and categorization of the events, create new data streams.
How to create a new data stream
In this example, we will guide you on how to create a new data stream.
Suppose you want to create a data stream for logs incoming from IP address 127.0.0.1.
-
Open the TeskaLabs LogMan.io web application. Navigate to Archive.
-
Select the generic stream. You will see a list of raw logs from various IP addresses.
- Collected: The time when the log was collected by LogMan.io Collector
- Received: The time when the log was received by LogMan.io Receiver.
- Source: Information about the log origin, composed of IP address, port, and protocol.
The values of protocol can be the following:
- S: Stream / TCP protocol
- D: Datagram / UDP protocol
- T: TLS / SSL protocol
-
Open Log sources >> Collectors. Find the collector by its label or identity.
-
Open the Custom tab. Here you can select data streams based on IP addresses, ports, and protocols. Follow this link for details of LogMan.io Collector configuration. Note that the name of the stream is important.
Example configuration of LogMan.io Collectorclassification: syslog-1514: &syslog-1514 # Stream names my-stream-1: - { ip: 127.0.0.1 } input:SmartDatagram:smart-udp-1514: address: '1514' output: smart smart: *syslog-1514 input:SmartStream:smart-tcp-1514: address: '1514' output: smart smart: *syslog-1514 output:CommLink:smart: {}Click on Apply.
-
From now on, the logs incoming from IP address
127.0.0.1are sent to the data streammy-stream-1. Open Archive. Find the streammy-stream-1. You will see incoming logs from the stream.Info
Once a log is stored in Archive, it cannot be moved to a different data stream (Archive is an immutable database).
How to create an event lane
Event lanes are created from event lane templates. An event lane template describes the properties of a data stream that will be applied to the event lane. It has its declaration in the Library:
---
define:
type: lmio/event-lane-template
name: Linux Rsyslog # Human-readable name of the data stream
stream: linux-rsyslog-* # Reference to the stream name
# Categorization of the log source
logsource:
product:
- linux
service:
- syslog
# Parsing rules to apply for the event lane
parsec:
name: /Parsers/Linux/Common/
# Content to enable when the event lane is created
content:
dashboards: /Dashboards/Linux/Common/
After a new data stream is found, it is matched with one of the event lane templates. A new event lane will be created, and it will inherit the properties of that template. A new declaration for the event lane will be created in the Library:
---
define:
type: lmio/event-lane-template
name: Linux Rsyslog (1)
template: /Templates/EventLanes/Linux/linux-rsyslog.yaml
logsource:
product:
- linux
service:
- syslog
parsec:
name: /Parsers/Linux/Common/
instances: 2
content:
dashboards: /Dashboards/Linux/Common/
kafka:
received:
topic: received.company.linux-rsyslog-1
events:
topic: events.company.linux-rsyslog-1
others:
topic: others.company.linux-rsyslog-1
elasticsearch:
events:
index: lmio-company-events-linux-rsyslog-1
others:
index: lmio-company-others
The event lane declaration copies the properties of the data stream from its template and adds information about:
- what Kafka topics and Elasticsearch indices will be used
- how many instances of the LogMan.io Parsec microservice will run inside the LogMan.io cluster
How to name a data stream? (2/2)
When you select a stream name that matches one of the event lane templates, the corresponding event lane will inherit its properties (parsing rules, Library content, categorization, etc.).
Suppose you want to connect a log source of type Linux Rsyslog. You can find the suitable technology in the event lane templates:
---
define:
type: lmio/event-lane-template
name: Linux Rsyslog # Human-readable name of the data stream
stream: linux-rsyslog-* # Reference to the stream name
The star * at the end of the stream option matches any number. Therefore, you can name your data stream linux-rsyslog-1, linux-rsyslog-2, etc.
The corresponding event lane will then inherit the name of the stream:
---
define:
type: lmio/event-lane
name: Linux Rsyslog (1)
template: /Templates/EventLanes/Linux/linux-rsyslog.yaml
Parsing rules and other event lane properties can be changed manually, so there is no risk in choosing an incorrect stream name on the first try.
Generic templates
When no event lane template is found for a given data stream name, an event lane for the corresponding data stream is created from the Generic event lane template. The generic template applies only the most basic parsing rules to the data stream and provides no particular information about a log source.
When you connect a log source of unknown type or a type that does not exist in the event lane templates, the event lane will be derived from the generic template. You can modify the properties of that event lane later.
Management of event lanes
Event lanes can be modified and deleted by a user.
Modifying event lanes
Event lanes can be modified in the Library declaration /EventLanes/tenant/eventlane.yaml. For example, different parsing rules can be selected for that data stream, or it can be provided with a new set of dashboards.
Read more about event lane declarations here.
Deactivating and deleting event lanes
Event lanes can be deactivated and deleted.
Deactivating an event lane
To deactivate an event lane, follow these steps:
-
Stop all instances of LogMan.io Parsec by setting the number of instances in the event lane declaration to zero:
parsec: instances: 0 -
Ensure all LogMan.io Parsec instances are stopped and removed in the Maintenance > Services section.
-
Inactivate the event lane by changing the
define/typeoption in the event lane declaration:define: type: lmio/event-lane-inactive -
Stop the LogMan.io Elman instance to prevent it from creating a new event lane. Stop all instances of LogMan.io Receiver as well.
docker stop lmio-receiver-1 docker stop lmio-elman-1 -
Enter the Kafka Docker container. Manually delete the
receivedandeventstopics of the event lane you want to remove.docker exec -it kafka-1 bash /bin/kafka-topics --bootstrap-server localhost:9092 --delete --topic received.tenant.stream /bin/kafka-topics --bootstrap-server localhost:9092 --delete --topic events.tenant.stream -
Restart LogMan.io Elman.
docker restart lmio-elman-1 -
Perform a rollover in Elasticsearch for the event lane index.
POST /lmio-tenant-events-stream/_rollover -
Delete the Discover data source for the event lane in Configuration >> Discover >> lmio-tenant-events-stream.
-
If you want to only inactivate the event lane but keep its data, restart all instances of LogMan.io Receiver. If you want to delete the event lane and its data, continue further.
(node-1) $ docker restart lmio-receiver-1 (node-2) $ docker restart lmio-receiver-2 (node-3) $ docker restart lmio-receiver-3
Deleting an inactive event lane
-
Stop all instances of LogMan.io Receiver. Go to Zoonavigator, open
lmio/receiver/db, and delete the record of the data stream. -
Ensure that the Kafka topics
receivedandeventsare deleted. Delete the event lane declaration in the Library/EventLanes/tenant/stream.yaml. -
If you want to delete the event lane data, read further. If not, restart all instances of LogMan.io Receiver.
Warning
After an event lane is deleted, no data is deleted from the Archive or Elasticsearch database, but it cannot be accessed from the TeskaLabs LogMan.io web application.
Deleting event lane data
Danger
Deleting data from TeskaLabs LogMan.io is possible, but strongly not recommended.
-
Open Kibana >> Stack Management >> Index Management. Delete all indices starting with
lmio-tenant-events-stream. -
Open Kibana >> Stack Management >> Index Management >> Index Templates. Delete the index template starting with
lmio-tenant-events-stream. -
Open Kibana >> Stack Management >> Index Lifecycle Policies. Delete the ILM starting with
lmio-tenant-events-stream. -
Ensure all instances of LogMan.io Receiver are stopped. Delete all stream data from the hot, cold, and warm phases on all cluster nodes.
rm -rfv /data/ssd/lmio-receiver-x/hot/<stream> rm -rfv /data/hdd/lmio-receiver-x/warm/<stream> rm -rfv /data/hdd/lmio-receiver-x/cold/<stream> -
Restart all instances of LogMan.io Receiver.
Data Life Cycle
The data lifecycle within TeskaLabs LogMan.io encompasses multiple stages designed to manage log data efficiently across its journey. From initial ingestion, archive and parsing, indexing, and eventual deletion, each stage is carefully configured to optimize performance, data retention, and compliance needs. While our default configurations provide sensible settings for most use cases, allowing smooth operation from day one, understanding the lifecycle stages can help refine and tailor the system as your requirements evolve. This chapter offers an overview of these stages and the databases involved, laying the groundwork for advanced data management.
Data (e.g. logs, events, metrics) are stored in several availability stages, basically in the chronological order.
There are several stops in the data flow where life cycle or retention of the data can be adapted:
- Archive - The first component that collects data is LMIO Receiver which provides Archive. Data in the Archive are managed through life cycle policy set for each stream.
Data lifecycle management in Archive
- Kafka - LMIO Receiver sends data to
received.<tenant>.<stream>topic. Once parsed, data reachevents.<tenant>.<stream>topic orothers.<tenant>if parsing fails.
Rentention policy settings in Kafka
- Elasticsearch - Parsed data are stored and indexed in Elasticsearch with its data lifecycle management.
Index lifecycle management in Elasticsearch
To remind the data flow through TeskaLabs LogMan.io, please see the Architecture diagram.
Kafka retention policy settings
TeskaLabs LogMan.io ensures the settings of Kafka topics are held in certain boundaries.
- Event lane topics are automatically managed by LogMan.io Event Lane Manager. Their retention can be set globally.
- Retention of any Kafka topic can be changed manually in Kafka.
Event lane topics
LogMan.io Event Lane Manager automatically sets the retention policy for event lane topics received.<tenant>.<stream>, events.<tenant>.<stream> and others.<tenant>. It is possible to set the retention globally (for all topics) in configuration:
services:
lmio-elman:
asab:
config:
kafka:
retention.ms_optimal: ... # default: 3 days
retention.ms_max: ... # default: 7 days
retention.ms_min: ... # default: 1 day (24 hours)
[kafka]
retention.ms_optimal=... ; default: 3 days
retention.ms_max=... ; default: 7 days
retention.ms_min=... ; default: 1 day (24 hours)
When a new event lane topic is created, it's retention is set to retention.ms_optimal. After that, retention of each event lane topic can then be changed manually, but it must higher than retention.ms_min and lower than retention.ms_max, otherwise it is automatically set back to retention.ms_optimal.
Sanity checks
Warning
The following lines are relevant for non-automated deployments of TeskaLabs LogMan.io without LMIO Event Lane Manager.
For installations where there is no LMIO Event Lane Manager running, there is a supporting mechanism that sets the retention for event lane topics.
LMIO Receiver checks all received.<tenant>.<stream> Kafka topics and ensures their retention is between configured minimum and maximum.
The default minimum retention is 12 hours and default maximum is 7 days.
If the retention is smaller, it is set to the configured minimum value. If the retention is bigger, it is set to configured maximum value.
You can change the configuration in the LMIO Receiver config. Use time in milliseconds:
[kafka:sanity]
min.retention.ms=... # default: 12 hours
max.retention.ms=... # default: 7 days
LMIO Depositor implements the same logic, using same configuration, affecting the topics events.<tenant>.<stream> and others.<tenant> and providing the same defaults.
Mind that the retention can be controlled based on both the age of the logs in the queue and size of the topic (in bytes). LogMan.io components do not control retention configuration based on index size.
Setting the retention in Kafka
Retention of each Kafka topic can be changed in Kafka.
Each Kafka Docker container is provided with Kafka Command-Line Interface Tools which can be accessed.
-
Enter the shell of Kafka Docker container:
docker exec -it kafka-1 bash -
Ensure that the topic exists and can be reached:
/usr/bin/kafka-topics --bootstrap-server localhost:9092 --list | grep "<topic>"(Replace
<topic>with your topic name.) -
Set the retention for a single topic using the command:
/usr/bin/kafka-configs --bootstrap-server localhost:9092 \ --entity-type topics --entity-name "<topic>" \ --alter --add-config retention.ms=86400000(Replace
<topic>with your topic name andretention.mswith your value.)
Why milliseconds?
You may wonder why are we using milliseconds everywhere we configure Kafka retention. Why just not use hours or days?
In fact, there are configuration options for setting the retention using hours or days.
But retention.ms option always has the highest priority over all other options.
To prevent possible conflicts with other services, we decided to use milliseconds, which is also recommended by Confluent.
Elasticsearch index lifecycle management
Index Lifecycle Management (ILM) in Elasticsearch serves to automatically close or delete old indices (i.e. with data older than three months), so searching performance is kept and data storage is able to store present data.
TeskaLabs LogMan.io provides default ILM policy for each index.
The default ILM policy is documented here. You can change it for each Elasticsearch index in the respective Event Lane declaration. Read more about that here.
Hot-Warm-Cold architecture (HWC)
HWC is an extension of the standard index rotation provided by the Elasticsearch ILM and it is a good tool for managing time series data. HWC architecture enables us to allocate specific nodes to one of the phases. When used correctly, along with the cluster architecture, this will allow for maximum performance, using available hardware to its fullest potential.
Hot stage
There is usually some period of time (week, month, etc.), where we want to query the indexes heavily, aiming for speed, rather than memory (and other resources) conservation. That is where the “Hot” phase comes in handy, by allowing us to have the index with more replicas, spread out and accessible on more nodes for optimal user experience.
Hot nodes
Hot nodes should use the fast parts of the available hardware, using most CPU's and faster IO.
Warm stage
Once this period is over, and the indexes are no longer queried as often, we will benefit by moving them to the “Warm” phase, which allows us to reduce the number of nodes (or move to nodes with less resources available) and index replicas, lessening the hardware load, while still retaining the option to search the data reasonably fast.
Warm nodes
Warm nodes, as the name suggests, stand on the crossroads, between being solely for the storage purposes, while still retaining some CPU power to handle the occasional queries.
Cold stage
Sometimes, there are reasons to store data for extended periods of time (dictated by law, or some internal rule). The data are not expected to be queried, but at the same time, they cannot be deleted just yet.
Cold nodes
This is where the Cold nodes come in, there may be few, with only little CPU resources, they have no need to use SSD drives, being perfectly fine with slower (and optionally larger) storage.
Elasticsearch backup and restore
Snapshots
Located under Stack Management -> Snapshot and Restore. The snapshots are stored in the repository location. The structure is as follows. The snapshot itself is just a pointer to the indices that it contains. The indices themselves are stored in a separate directory, and they are stored incrementally. This basically means, that if you create a snapshot every day, the older indices are just referenced again in the snapshot, while only the new indices are actually copied to the backup directory.
Repositories
First, the snapshot repository needs to be set up. Specify the location where the snapshot repository resides, /backup/elasticsearch for instance. This path needs to be accessible from all nodes in the cluster. With the Elasticsearch running in docker, this includes mounting the space inside of the docker containers, and restarting them.
Policies
To begin taking snapshots, a policy needs to be created. The policy determines the naming prefix of the snapshots it creates, it specifies repository it will be using for creating snapshots, It requires a schedule setting, indices (defined using patterns or specific index names - lmio-<tenant>-events-* for instance).
Furthermore, the policy is able to specify whether to ignore unavailable indices, allow partial indices and include global state. Use of these depends on the specific case, in which the snapshot policy will be used and are not recommended by default. There is also a setting available to automatically delete snapshots and define expiration. These also depend on specific policy, the snapshots themselves however are very small (memory wise), when they do not include global state, which is to be expected since they are just pointers to a different place, where the actual index data are stored.
Restoring a snapshot
To restore a snapshot, simply select the snapshot containing the index or indices you wish to bring back and select "Restore". You then need to specify whether you want to restore all indices contained in the snapshot, or just a portion. You are able to rename the restored indices, you can also restore partially snapshot indices and modify the index setting while restoring them. Or resetting them to default. The indices are then restored as specified back into the cluster.
Caveats
When deleting snapshots, bear in mind that you need to have the backed up indices covered by a snapshot to be able to restore them. What this means is, when you for example clear some of the indices from the cluster and then delete the snapshot that contained the reference to these indexes, you will be unable to restore them.
System monitoring
System monitoring
The following tools and techniques can help you understand how your TeskaLabs LogMan.io system is performing and investigate any issues that arise.
Preset dashboards
LogMan.io includes preset diagnostic dashboards that give you insight into your system performance. This is the best place to start monitoring.
Prophylactic checks
Prophylacitic checks are preventative checkups on your LogMan.io app and system performance. Visit our prophylactic check manual to learn how to perform regular prophylactic checks.
Metrics
Metrics are measurements regarding system performance. Investigating metrics can be useful if you already know what area of your system you need insight into, which you can discover through analyzing your preset dashboards or performing a prophylactic check.
Grafana dashboards for system diagnostics
Through TeskaLabs LogMan.io, you can access dashboards in Grafana that monitor your data pipelines. Use these dashboards for diagnostic purposes.
The first few months of your deployment of TeskaLabs LogMan.io are a stabilization period, in which you might see extreme values produced by these metrics. These dashboards are especially useful during stabilization and can help with system optimization. Once your system is stable, extreme values, in general, indicate a problem.
To access the dashboards:
1. In LogMan.io, go to Tools.
2. Click on Grafana. You are now securely logged in to Grafana with your LogMan.io user credentials.
3. Click the menu button, and go to Dashboards.
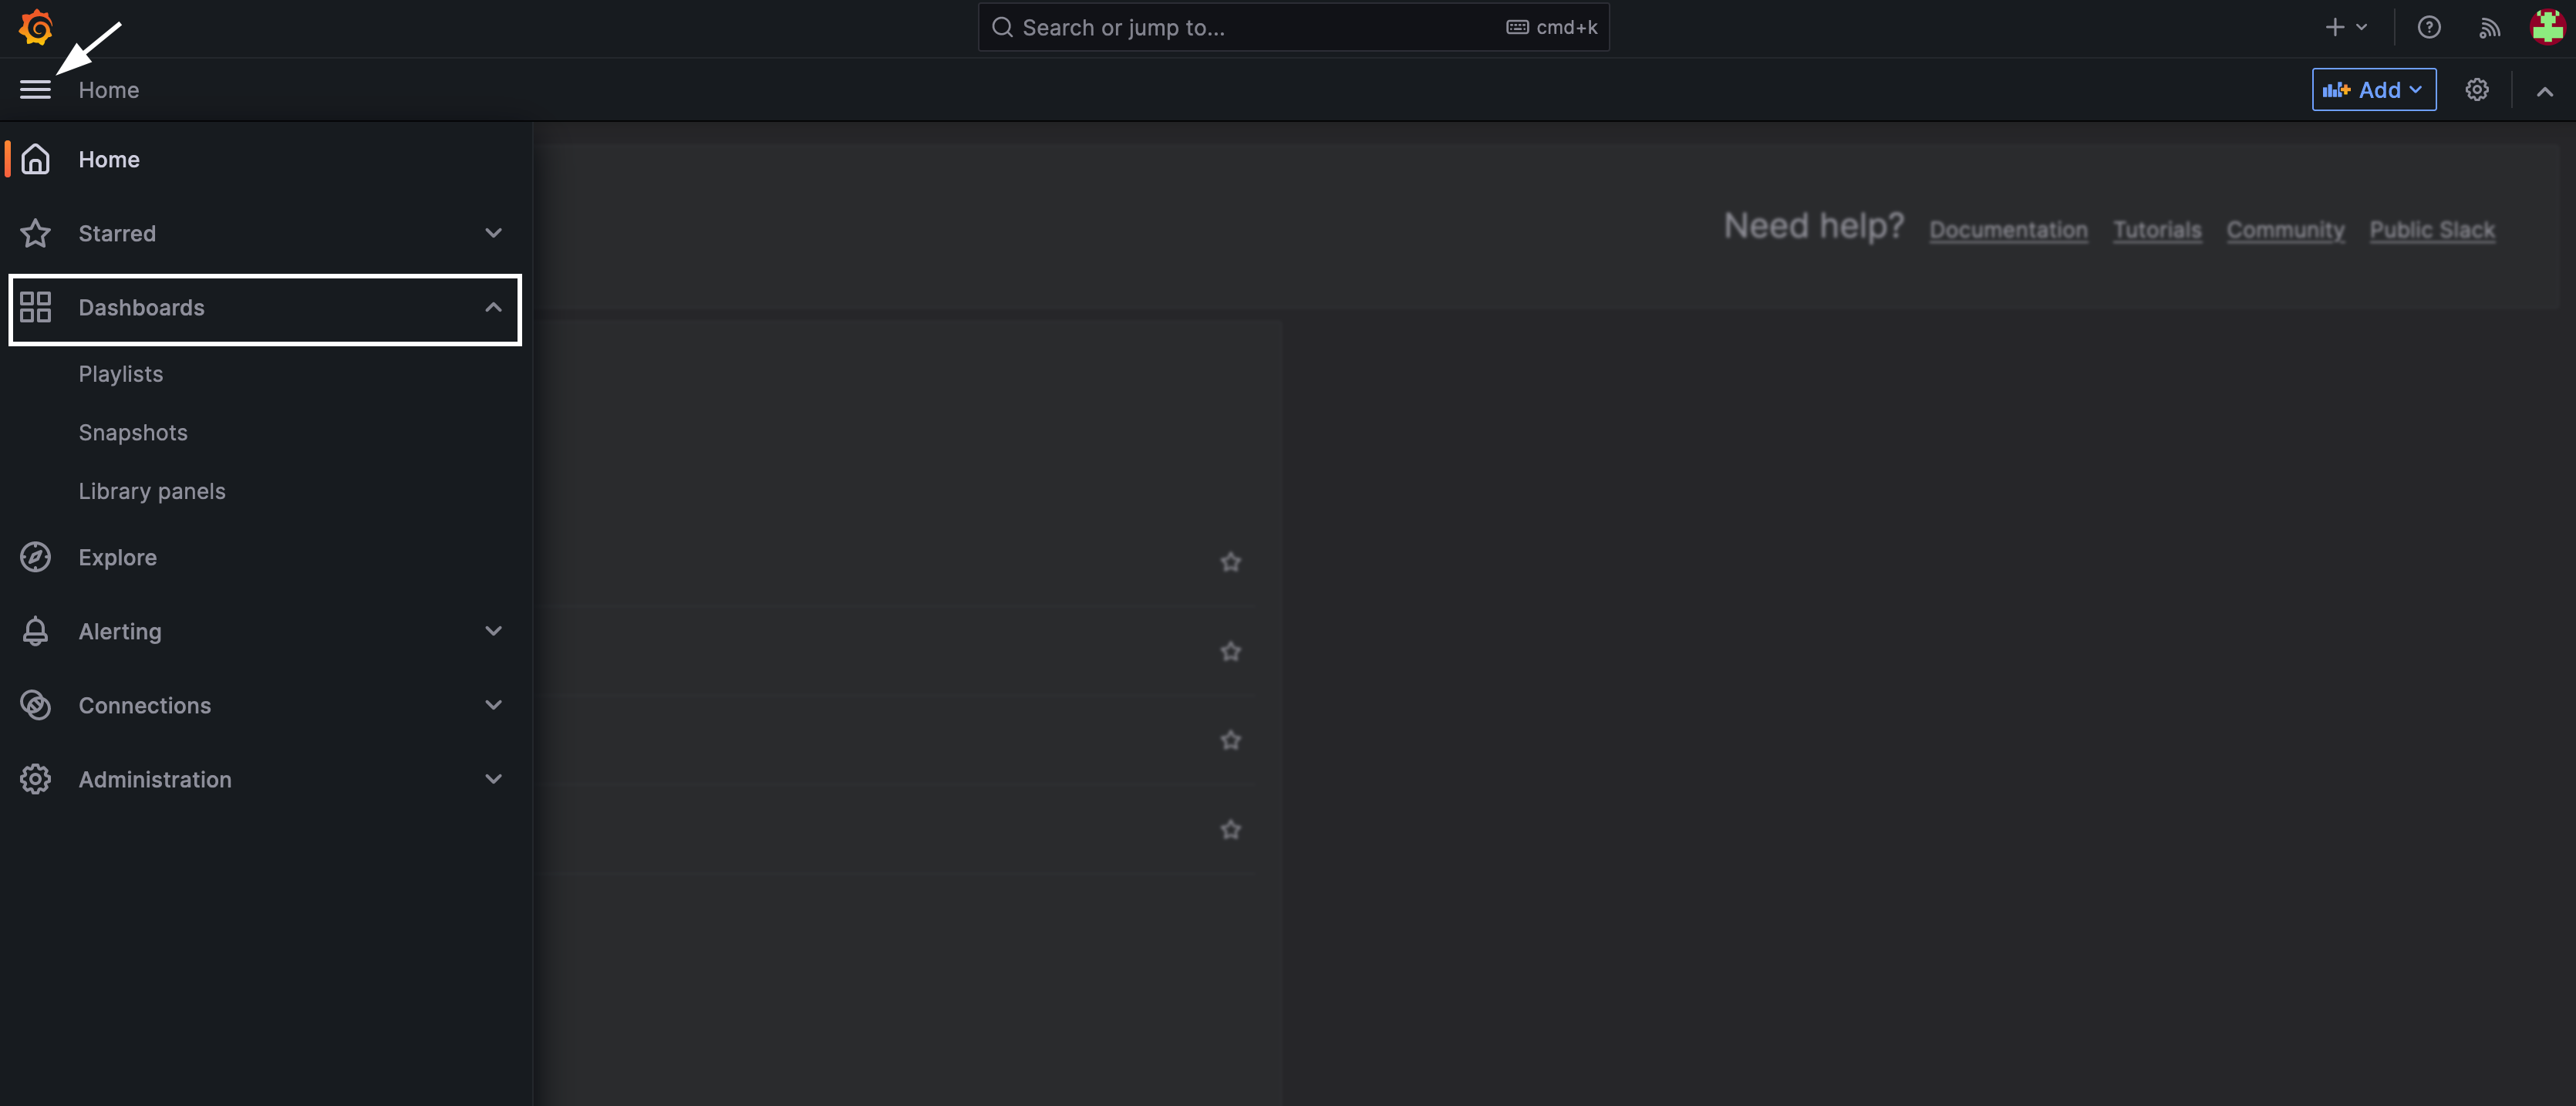
4. Select the dashboard you want to see.
Tips
- Hover over any graph to see details at specific time points.
- You can change the timeframe of any dashboard with the timeframe tools in the top right corner of the screen.
LogMan.io dashboard
The LogMan.io dashboard monitors all data pipelines in your installation of TeskaLabs LogMan.io. This dashboard can help you investigate if, for example, you're seeing fewer logs than expected in LogMan.io. See Pipeline metrics for deeper explanations.
Metrics included:
-
Event In/Out: The volume of events passing through each data pipeline measured in in/out operations per second (io/s). If the pipeline is running smoothly, the In and Out quantities are equal, and the Drop line is zero. This means that the same amount of events are entering and leaving the pipeline, and none are dropped. If you can see in the graph that the In quantity is greater than the Out quantity, and that the Drop line is greater than zero, then some events have been dropped, and there might be an issue.
-
Duty cycle: Displays the percentage of data being processed as compared to data waiting to be processed. If the pipeline is working as expected, the duty cycle is at 100%. If the duty cycle is lower than 100%, it means that somewhere in the pipeline, there is a delay or a throttle causing events to queue.
-
Time drift: Shows you the delay or lag in event processing, meaning how long after an event's arrival it is actually processed. A significant or increased delay impacts your cybersecurity because it inhibits your ability to respond to threats immediately. Time drift and duty cycle are related metrics. There is a greater time drift when the duty cycle is below 100%.
System-level overivew dashboard
The System-level overview dashboard monitors the servers involved in your TeskaLabs LogMan.io installation. Each node of the installation has its own section in the dashboard. When you encounter a problem in your system, this dashboard helps you perform an initial assessment on your server by showing you if the issue is related to input/output, CPU usage, network, or disk space or usage. However, for a more specific analysis, pursue exploring specific metrics in Grafana or InfluxDB.
Metrics included:
- IOWait: Percentage of time the CPU remains idle while waiting for disk I/O (input/output) requests. In other words, IOWait tells you how much processing time is being wasted waiting for data. A high IOWait, especially if it's around or exceeds 20% (depending on your system), signals that the disk read/write speed is becoming a system bottleneck. A rising IOWait indicates that the disk's performance is limiting the system's ability to receive and store more logs, impacting overall system throughput and efficiency.
- Uptime: The amount of a time the server has been running without since last being shut down or restarted.
- Load: Represents the average number of processes waiting in the queue for CPU time over the last 5 minutes. It's a direct indicator of how busy your system is. In systems with multiple CPU cores, this metric should be considered in relation to the total number of available cores. For instance, a load of 64 on a 64-core system might be acceptable, but above 100 indicates severe stress and unresponsiveness. The ideal load varies based on the specific configuration and use case but generally should not exceed 80% of the total number of CPU cores. Consistently high load values indicate that the system is struggling to process the incoming stream of logs efficiently.
- RAM usage: The percentage of the total memory currently being used by the system. Keeping RAM usage between 60-80% is generally optimal. Usage above 80% often leads to increased swap usage, which in turn can slow down the system and lead to instability. Monitoring RAM usage is crucial for ensuring that the system has enough memory to handle the workload efficiently without resorting to swap, which is significantly slower.
- CPU usage: An overview of the percentage of CPU capacity currently in use. It averages the utilization across all CPU cores, which means individual cores could be under or over-utilized. High CPU usage, particularly over 95%, suggests the system is facing CPU-bound challenges, where the CPU's processing capacity is the primary limitation. This dashboard metric helps differentiate between I/O-bound issues (where the bottleneck is data transfer) and CPU-bound issues. It's a critical tool for identifying processing bottlenecks, although it's important to interpret this metric alongside other system indicators for a more accurate diagnosis.
- Swap usage: How much of the swap space is being used. A swap partition is dedicated space on the disk used as a temporary substitute for RAM ("data overflow"). When RAM is full, the system temporarily stores data in swap space. High swap usage, above approximately 5-10%, indicates that the system is running low on memory, which can lead to degraded performance and instability. Persistent high swap usage is a sign that the system requires more RAM, as relying heavily on swap space can become a major performance bottleneck.
- Disk usage: Measures how much of the storage capacity is currently being used. In your log management system, it's crucial to keep disk usage below 90% and take action if it reaches 80%. Inadequate disk space is a common cause of system failures. Monitoring disk usage helps in proactive management of storage resources, ensuring that there is enough space for incoming data and system operations. Since most systems are configured to delete data after 18 months of storage, disk space usage can begin to stabilize after the system has been running for 18 months. Read more about the data lifecycle.
Elasticsearch metrics dashboard
The Elasticsearch metrics dashboard monitors the health of the Elastic pipeline. (Most TeskaLabs LogMan.io users use the Elasticsearch database to store log data.)
Metrics included:
- Cluster health: Green is good; yellow and red indicate a problem.
- Number of nodes: A node is a single instance of Elasticsearch. The number of nodes is how many nodes are part of your LogMan.io Elasticsearch cluster.
- Shards
- Active shards: Number of total shards active. A shard is the unit at which Elasticsearch distributes data around a cluster.
- Unassigned shards: Number of shards that are not available. They might be in a node which is turned off.
- Relocating shards: Number of shards that are in the process of being moved to a different node. (You might want to turn off a node for maintenance, but you still want all of your data to be available, so you can move a shard to a different node. This metrics tells you if any shards are actively in this process and therefore can't provide data yet.)
- Used mem: Memory used. Used memory at 100% would mean that Elasticsearch is overloaded and requires investigation.
- Output queue: The number of tasks waiting to be processed in the output queue. A high number could indicate a significant backlog or bottleneck.
- Stored GB: The amount of disk space being used for storing data in the Elasticsearch cluster. Monitoring disk usage is helps to ensure that there's sufficient space available and to plan for capacity scaling as necessary.
- Docs count: The total number of documents stored within the Elasticsearch indices. Monitoring the document count can provide insights into data growth and index management requirements
- Task max waiting in queue: The maximum time a task has waited in a queue to be processed. It’s useful for identifying delays in task processing which could impact system performance and throughput.
- Open file descriptors: File descriptors are handles that allow the system to manage and access files and network connections. Monitoring the number of open file descriptors is important to ensure that system resources are being managed effectively and to prevent potential file handle leaks which could lead to system instability
- Used cpu %: The percentage of CPU resources currently being used by Elasticsearch. Monitoring CPU usage helps you understand the system's performance and identify potential CPU bottlenecks.
- Indexing: The rate at which new documents are being indexed into Elasticsearch. A higher rate means your system can index more information more efficiently.
- Inserts: The number of new documents being added to the Elasticsearch indices. This line follows a regular pattern if you have a consistent number of inputs. If the line spikes or dips irregularly, there could be an issue in your data pipeline keeping events from reaching Elasticsearch.
Burrow consumer lag dashboard
The Burrow dashboard monitors the consumers and partitions of Apache Kafka. Learn more about Burrow here.
Apache Kafka terms:
- Consumers: Consumers read data. They subscribe to one or more topics and read the data in the order in which it was produced.
- Consumer groups: Consumers are typically organized into consumer groups. Each consumer within a group reads from exclusive partitions of the topics they subscribe to, ensuring that each record is processed only once by the group, even if multiple consumers are reading.
- Partitions: Topics are split into partitions. This allows the data to be distributed across the cluster, allowing for concurrent read and write operations.
Metrics included:
- Group status: The overall health status of the consumer group. A status of OK means that the group is functioning normally, while a warning or error could indicate issues like connectivity problems, failed consumers, or misconfigurations.
- Total lag: In this case, lag can be thought of as a queue of tasks waiting to be processed by a microservice. The total lag metric represents the count of messages that have been produced to the topic but not yet consumed by a specific consumer or consumer group. If the lag is 0, everything is dispatched properly, and there is no queue. Because Apache Kafka tends to group data into batches, some amount of lag is often normal. However, an increasing lag, or a lag above approximately 300,000 (this number is dependent on your system capacity, configuration, and sensitivity) is cause for investigation.
- Partitions lag: The lag for individual partitions within a topic. Being able to see partitions' lags separated tells you if some partitions have a larger queue, or higher delay, than others, which might indicate uneven data distribution or other partition-specific issues.
- Partition status: The status of individual partitions. An OK status indicates the partition is operating normally. Warnings or errors can signify problems like a stalled consumer, which is not reading from the partition. This metric helps identify specific partition-level issues that might not be apparent when looking at the overall group status.
Prophylactic Check
Introduction
Prophylactic checks MUST be performed periodically (weekly, monthly, etc.), ideally on the same day of the week and at a consistent time. It is crucial to consider variations in the quantity and frequency of incoming events, which can fluctuate based on the day of the week, working hours, and bank holidays.
The recommended periodicity of the prophylactic checks:
- 1x week in "hypercare" period; the hypercare period is a stabilization period after the initial installation of the product, lasting ~3 months.
- 1x month
The results of prophylactic checks should be documented in two separate reports:
- Vendor Report – Maintained for internal tracking in the Vendor (TeskaLabs) system.
- Client Report – Shared with end user via their support Slack channel or other support channel.
Note
Be mindful to clearly explain and describe findings, ensuring severe issues are already addressed internally. If a resolution is underway, always communicate this in the report.
Support Re-distribution
A list of individuals involved in specific projects can be found in the internal documentation. If an issue arises, escalate it appropriately based on the client, partner, or customer involved.
Prophylactic Check Procedure
Prerequisities
- Access (HTTPS, SSH) to respective TeskaLabs LogMan.io installation.
- Ensure that all tenants available to you are reviewed during these checks.
TeskaLabs LogMan.io Functionalities
Navigation and Functionality Check
- Review each assigned tenant by checking all components in the sidebar:
- Discover: Verify log accessibility, search performance, and query execution. Ensure logs are correctly indexed and available.
- Dashboards: Check for correct data visualization, updated widgets, and proper filtering. Ensure graphs and charts reflect expected metrics.
- Reports: Validate the generation of reports, their formatting, and accuracy of data. Ensure scheduled reports are delivered correctly.
- Export: Test data extraction and ensure exported files are correctly formatted and contain expected content.
- Archive: Verify archived logs are retrievable and stored as expected.
- Logsources:
- Collectors: Ensure all collectors are active, receiving data, and properly configured.
- Event Lanes: Validate the correct classification of events and confirm no anomalies in processing.
- Baselines: Check baseline metrics to ensure they align with expected thresholds and review changes.
- Alerts: Confirm that alerting mechanisms are functional, test alert triggers, and review escalations.
- Tools: Ensure that built-in tools (e.g., Grafana, Kibana) are working as expected.
- Lookups: Validate lookup tables for accuracy and ensure they are correctly referenced in event processing.
- Library: Confirm availability and correct versioning of shared resources and content.
- Maintenance:
- Configuration: Ensure system settings and configurations are properly maintained and updated.
- Services: Verify that backend services are operational and running smoothly.
-
Auth & Roles:
- Credentials: Check the available credentials and keep them updated.
- Tenants: Confirm tenant access and ensure proper isolation of data.
- Sessions: Review session logs for anomalies or unauthorized access attempts.
- Roles: Ensure role-based access controls are properly enforced.
- Resources: Validate the availability of shared system resources.
- Clients: Ensure client configurations are correctly maintained and up to date.
-
Note: If you are not a superuser, you may not see every section mentioned above.
ASAB-IRIS - Template Testing
- Test sending an email and a Slack message through the library.
- Any issues in this section should be reported internally.
Log Sources Monitoring
Log Time Zones
- Where to check: TeskaLabs LogMan.io Discover screen
- Check for logs with
@timestampin the future (now+2H or more) - Issue Reporting:
- Incorrect time zones should be reported internally.
- If the issue is due to incorrect logging device settings, report to the client’s support Slack channel.
- Analyze the source (
host.hostname,lmio.source, or IP address) and include this in the prophylaxis report.
Log Sources
- Where to check: Discover screen – Event Lanes, Event lane screen, and Baseliner
- Goal: Ensure every connected log source is currently active, investigate all outages and anomalies in logging.
- Issue Reporting:
- Internally and to the client/partner support Slack channel.
Other Events
- Where to check: TeskaLabs LogMan.io -
lmio-others-eventsindex on the Discover screen - Common sources of error logs:
- Depositor logs
- Unstructured logs
- Multiline and fragmented logs
- Issue Reporting: Internally to the parsec team.
System Logs
- Where to check: TeskaLabs LogMan.io - System tenant, index Events & Others
- Issue Reporting:
- Various log types may appear here; focus on error and warning logs.
- Report findings internally or to the client support Slack channel if necessary.
Baseliner
- Where to check: TeskaLabs LogMan.io Baseliner screen
- Include checking redirection from the Discover screen to the Baseliner screen.
- Issue Reporting: If Baseliner is inactive, report internally.
Elasticsearch Monitoring
- Where to check: Grafana, dedicated dashboard – ElasticSearch and Kibana Stack Monitoring
- Sample data check for the last 24 hours
- Indicators to Monitor:
- Inactive Nodes → Should be zero
- System Health → Should be green; escalate immediately if yellow or red.
- Unassigned Shards → Should be zero and green; yellow or nonzero requires monitoring and reporting.
- JVM Heap → Monitor heap usage to ensure it remains below 75% to avoid excessive garbage collection, which can slow down query execution. If heap usage frequently exceeds 85%, consider increasing allocated memory or optimizing queries and indexing.
- Assigned ILM → Check that ILM policies are correctly applied to indices, ensuring data is moved according to defined retention and performance strategies. Misconfigured ILM can lead to increased storage costs and degraded search performance.
- Issue Reporting: Escalate severe issues internally.
System Level Overview
- Where to check: Grafana, dedicated dashboard – System Level Overview
- Sample data check for the last 24 hours
- Metrics to Monitor:
- Disk usage: Must not exceed 80% (except for
/boot, which should not exceed 95%). - Load: Should not exceed 40%; max load should equal the number of cores.
- CPU Should not exceed 85% utilization over an extended period.
- IOWait: Should be below 10%; values above 20% indicate significant disk read/write delays.
- RAM usage: Should not exceed 70%; continuous usage above 80% requires investigation.
- Swap Should be minimal; frequent or high swap usage indicates memory pressure and needs further analysis.
- Issue Reporting: Report internally.
Kafka Lag Overview
- Definition: Lag in this context refers to the delay between when a message is produced to a Kafka topic and when it is consumed by the respective consumer group. A high lag value indicates that consumers are not processing messages quickly enough, leading to potential data processing delays and system inefficiencies.
- Where to check: Grafana, dedicated dashboard – Kafka Lag Overview
- Groups to Monitor:
lmio parseclmio depositorlmio baselinerlmio correlator- Key Metric: Lag value should not increase over time.
- Issue Reporting:
- If lag increases compared to the previous week, report in the internal Slack channel.
- Severe lag increase should be escalated immediately.
Index Sizing & Lifecycle Monitoring
- Where to check: Kibana, Stack monitoring or Stack management
- Steps:
- Click on Indices.
- Sort the Data column from largest to smallest.
- Investigate indices larger than 200 GB.
- ILM Check:
- If an index is missing a numeric suffix, it is not connected to ILM.
- Check whether indices are correctly classified as hot/warm/cold.
- Sharding:
- Sharding should not exceed 500-600 shards per node to prevent excessive resource utilization.
- Verify shard allocation across cluster nodes to ensure balanced distribution.
- Issue Reporting: Report internally and escalate immediately.
Counting EPS
- Definition EPS refers to the number of log events received per second. Monitoring EPS helps track the system's ingestion rate, detect anomalies, and ensure the system can handle peak loads efficiently.
- Where to check: LogMan.io UI for the last 7 days
- Metrics to Retrieve:
- MEAN value
- MAX value
Metrics
System monitoring metrics
When logs and events pass through the TeskaLabs LogMan.io, the logs and events are processed by several TeskaLabs microservices as well as Apache Kafka, and most deployments store data in Elasticsearch. Since the microservices and other technologies handle a huge volume of events, it is not practical to monitor them with logs. Instead, metrics, or measurements, monitor the status and health of each microservice and other parts of your system.
You can access the metrics in Grafana and/or InfluxDB with preset or custom visualizations. Each metric for each microservice updates approximately once per minute.
Viewing metrics
To access system monitoring metrics, you can use Grafana and/or InfluxDB through the TeskaLabs LogMan.io web app Tools page.
Using Grafana to view metrics
Preset dashboards
We deploy TeskaLabs LogMan.io with a prepared set of monitoring and diagnostic dashboards - details and instructions for access here. These dashboards give you a broader overview of what's going on in your system. We recommend consulting these dashboards first if you don't know what specfic metrics you want to investigate.
Using Grafana's Explore tool
1. In Grafana, click the (menu) button, and go to Explore.
2. Set data source to InfluxDB.

3. Use the clickable query builder:
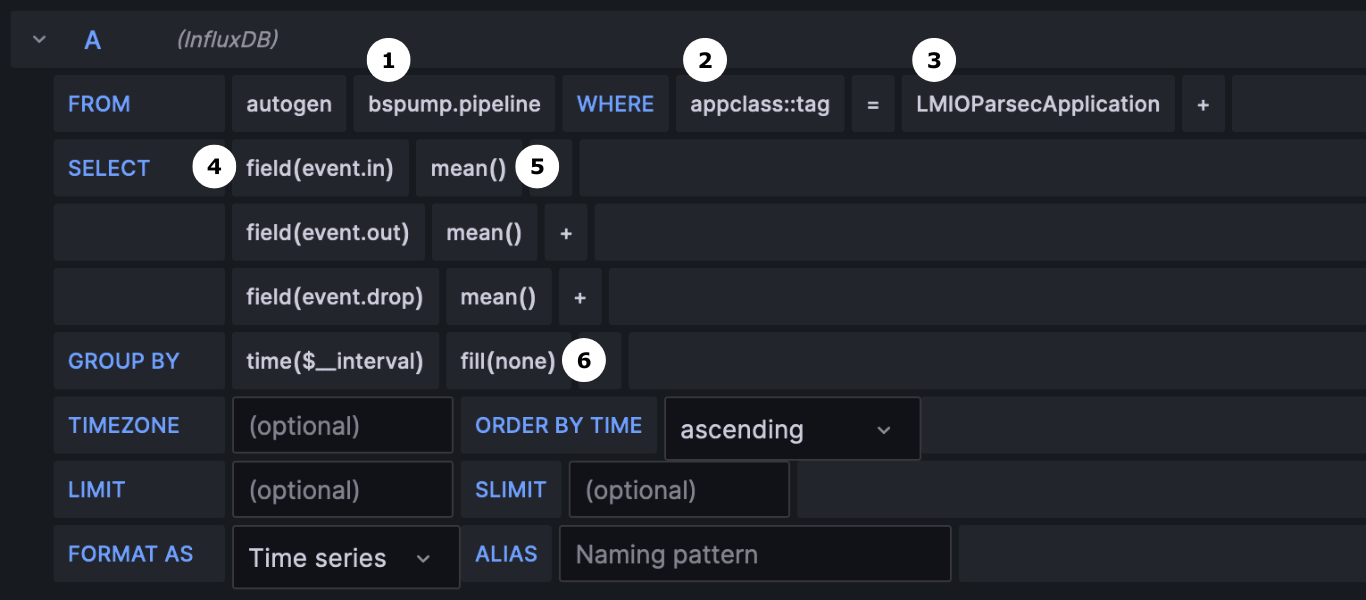
Grafana query builder
FROM:
1. Measurement: Click on select measurement to choose a group of metrics. In this case, the metrics group is bspump.pipeline.
2. Tag: Click the plus sign beside WHERE to select a tag. Since this example shows metrics from a microservice appclass::tag is selected.
3. Tag value: Click select tag value, and select a value. In this example, the query will show metrics from the Parsec microservice.
Optionally, you can add additional filters in the FROM section, such as pipeline and host.
SELECT:
4. Fields: Add fields to add specific metrics to the query.
5. Aggregation: You can choose the aggregation method for each metric. Be aware that Grafana cannot display a graph in which some values are aggregated and others are non-aggregated.
GROUP BY:
6. Fill: You can choose fill(null) or fill(none) to decide how to fill gaps between data points. fill(null) does not fill the gaps, so your resulting graph will be data points with space between. fill(none) connects data points with a line, so you can more easily see trends.
4. Adjust the timeframe as needed, and click Run query.
For more information about Grafana's Explore function, visit Grafana's documentation.
Using InfluxDB to view metrics
If you have access to InfluxDB, you can use it to explore data. InfluxDB provides a query builder that allows you to filter out which metrics you want to see, and get visualizations (graphs) of those metrics.
To access InfluxDB:
- In the LogMan.io web app, go to Tools.
- Click on InfluxDB, and log in.
Using the query builder:
This example guides you through investigating a metric that is specific to a microservice, such as a pipeline monitoring metric. If you're seeking a metric that does not involve a microservice, begin with the _measurement tag, then filter with additional relevant tags.
- In InfluxDB, in the left sidebar, click the icon to go to the Data Explorer. Now, you can see InfluxDB's visual query builder.
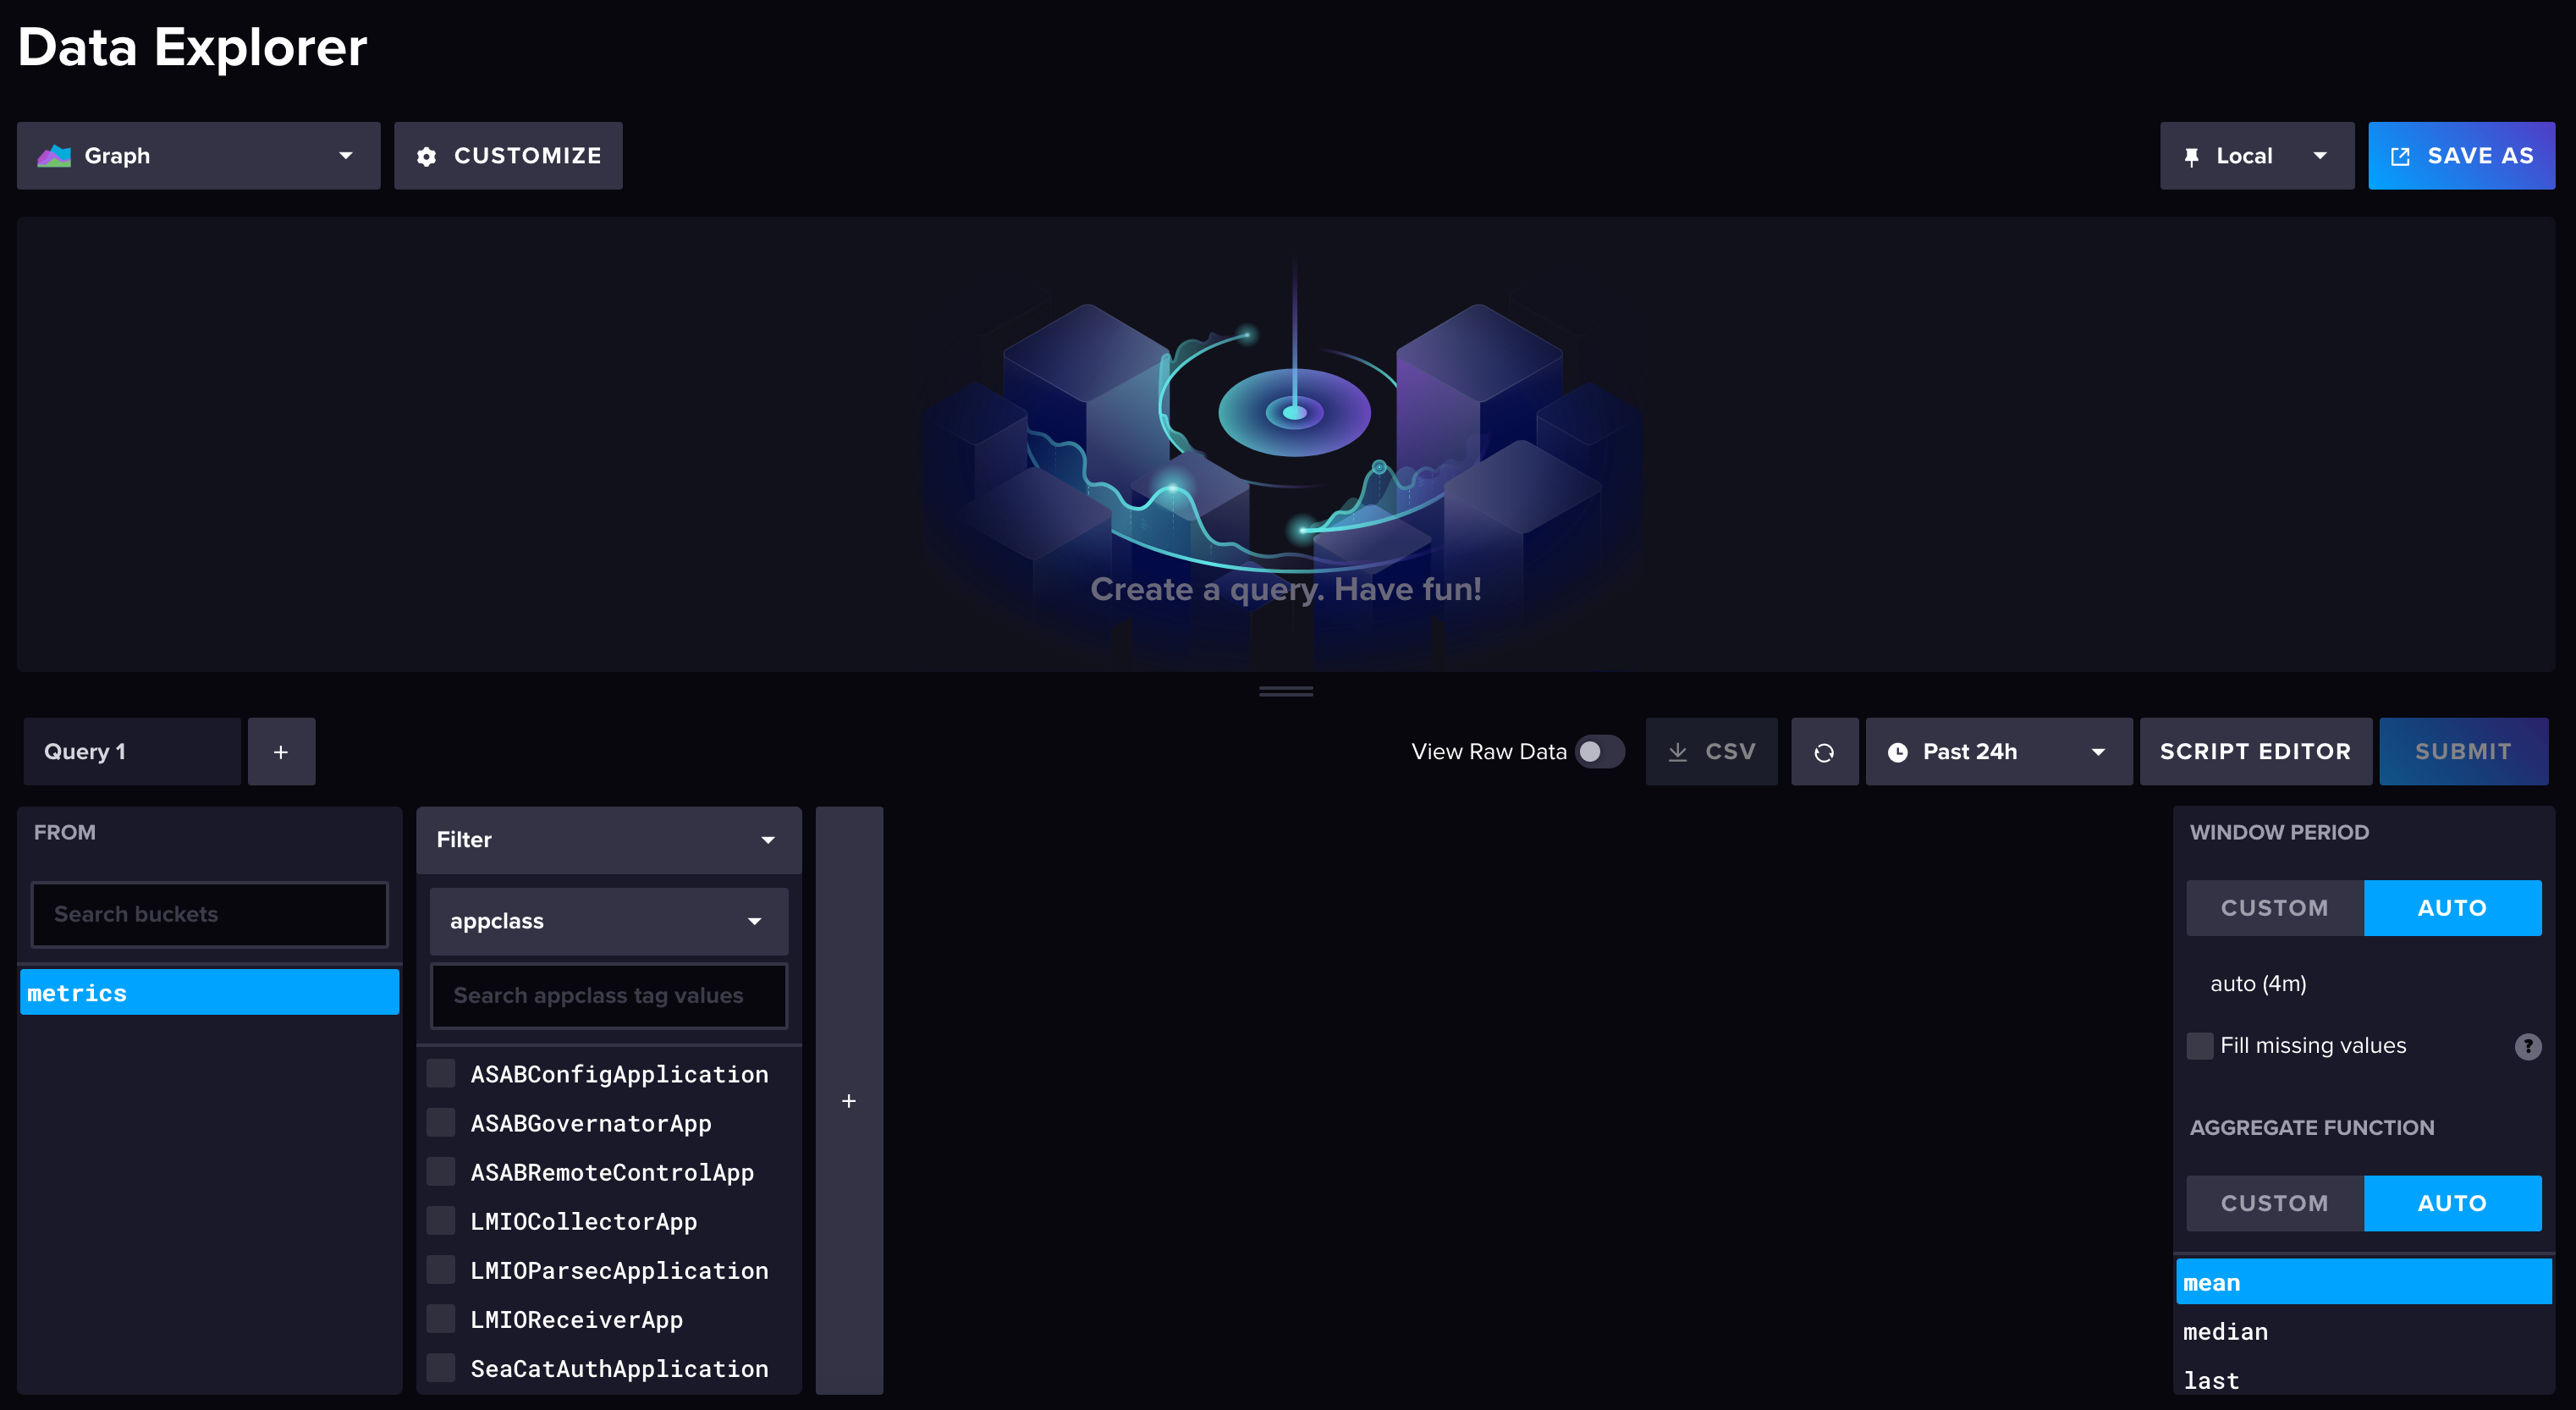
- In the first box, select a bucket. (Your metrics bucket is most likely either named
metricsor named after your organization.) - In the next filter, select appclass from the drop-down menu to see the list of microservices that produce metrics. Click on the microservice from which you want to see metrics.

- In the next filter, select _measurement from the drop-down menu to see the list of metrics groups. Select the group you want to see.

- In the next filter, select _field from the drop-down menu to see the list of metrics available. Select the metrics you want to see.

- A microservice can have multiple pipelines. To narrow your results to a specific pipeline, use an additional filter. Select pipeline from the drop-down menu, and select the pipeline(s) you want represented.
- Optionally, you can also select a host in the next filter. Without filtering, InfluxDB displays the data from all hosts available, but you likely have only one host. To select a host, choose host in the drop-down menu, and select a host.
- Change the timeframe if desired.

- To load the visualization, click Submit.
Visualization produced in this example:

For more information about InfluxDB's Data explorer function, visit InfluxDB's documentation.
Pipeline metrics
Pipeline metrics, or measurements, monitor the throughput of logs and events in the microservices' pipelines. You can use these pipeline metrics to understand the status and health of each microservice.
The data that moves through microservices is broken down to and measured in events. (Each event is one message in Kafka and will result in one entry in Elasticsearch.) Since events are countable, the metrics quantify the throughput, allowing you to assess pipeline status and health.
BSPump
Several TeskaLabs microservices are built on the technology BSPump, so the names of the metrics include bspump.
Microservices built on BSPump:
Microservice architecture
The internal architecture of each microservice differs and might affect your analysis of the metrics. Visit our Architecture page.
The microservices most likely to produce uneven event.in and event.out counter metrics without actually having an error are:
- Parser/Parsec - This is due to its internal architecture; the parser sends events into a different pipeline (Enricher), where the events are then not counted in
event.out. - Correlator - Since the correlator assesses events as they are involved in patterns, it often has a lower
event.outcount thanevent.in.
Metrics
Naming and tags in Grafana and InfluxDB
- Pipeline metrics groups are under the
measurementtag. - Pipeline metrics are produced for microservices (tag
appclass) and can be further filtered with the additional tagshostandpipeline. - Each individual metric (for example,
event.in) is a value in thefieldtag.
All metrics update automatically once per minute by default.
bspump.pipeline
event.in
Description: Counts the number of events entering the pipeline
Unit: Number (of events)
Interpretation: Observing event.in over time can show you patterns, spikes, and trends in how many events have been received by the microservice. If no events are coming in, event.in is a line at 0. If you are expecting throughput, and event.in is 0, there is a problem in the data pipeline.
event.out
Description: Counts the number of events leaving the pipeline successfully
Unit: Number (of events)
Interpretation: event.out should typically be the same as event.in, but there are exceptions. Some microservices are constructed to have either multiple outputs per input, or to divert data in such a way that the output is not detected by this metric.
event.drop
Description: Counts the number of events that have been dropped, or messages that have been lost, by a microservice.
Unit: Number (of events)
Interpretation: Since the microservices built on BSPump are generally not designed to drop messages, any drop is most likely an error.
 When you hover over a graph in InfluxDB, you can see the values of each line at any point in time. In this graph, you can see that
 event.out is equal to event.in, and event.drop equals 0, which is the expected behavior of the microservice. The same number of events are leaving as are entering the pipeline, and no events are being dropped.
warning
Description: Counts the number of warnings produced in a pipeline.
Unit: Number (of warnings)
Interpretation: Warnings tell you that there is an issue with the data, but the pipeline was still able to process it. A warning is less severe than an error.
error
Description: Counts the number of errors in a pipeline.
Unit: Number (of errors)
Interpretation: Microservices might trigger errors for different reasons. The main reason for an error is that the data does not match the microservice's expectation, and the pipeline has failed to process that data.
bspump.pipeline.eps
EPS means events per second.
eps.in
Description: "Events per second in" - Rate of events successfully entering the pipeline
Unit: Events per second (rate)
Interpretation: eps.in should stay consistent over time if If a microservice's eps.in slows over time unexpectedly, there might be a problem in the data pipeline before the microservice.
eps.out
Description: "Events per second out" - Rate of events successfully leaving the pipeline
Unit: Events per second (rate)
Interpretation: Similar to event.in and event.out, eps.in and eps.out should typically be the same, but they could differ depending on the microservice. If events are entering the microservice much faster than they are leaving, and this is not the expected behavior of that pipeline, you might need to address an error causing a bottleneck in the microservice.
eps.drop
Description: "Events per second dropped" - rate of events being dropped in the pipeline
Unit: Events per second (rate)
Interpretation: See event.drop. If eps.drop rapidly increases, and it is not the expected behavior of the microservice, that indicates that events are being dropped, and there is a problem in the pipeline.
 Similar to graphing
 event.in and event.out, the expected behavior of most microservices is for eps.out to equal eps.in with drop being equal to 0.
warning
Description: Counts the number of warnings produced in a pipeline in the specified timeframe.
Unit: Number (of warnings)
Interpretation: Warnings tell you that there is an issue with the data, but the pipeline was still able to process it. A warning is less severe than an error.
error
Description: Counts the number of errors in a pipeline in the specified timeframe.
Unit: Number (of errors)
Interpretation: Microservices might trigger errors for different reasons. The main reason for an error is that the data does not match the microservice's expectation, and the pipeline has failed to process that data.
bspump.pipeline.gauge
A gauge metric, percentage expressed as a number 0 to 1.
warning.ratio
Description: Ratio of events that generated warnings compared to the total number of successfully processed events.
Interpretation: If the warning ratio increases unexpectedly, investigate the pipeline for problems.
error.ratio
Description: Ratio of events that failed to process compared to the total number of successfully processed events.
Interpretation: If the error ratio increases unexpectedly, investigate the pipeline for problems. You could create a trigger to notify you when error.ratio exceeds, for example, 5%.
bspump.pipeline.dutycycle
The duty cycle (also called power cycle) describes if a pipeline is waiting for messages (ready, value 1) or unable to process new messages (busy, value 0).
In general:
- A value of 1 is acceptable because the pipeline can process new messages
- A value 0 indicates a problem, because the pipeline cannot process new messages.
Understanding the idea of duty cycle
We can use human productivity to explain the concept of the duty cycle. If a person is not busy at all and has nothing to do, they are just waiting for a task. Their duty cycle reading is at 100% - they are spending all of their time waiting and can take on more work. If a person is busy doing something and cannot take on any more tasks, their duty cycle is at 0%.
 The above example (not taken from InfluxDB) shows what a change in duty cycle looks like on a very short time scale. In this example, the pipeline had two instances of being at 0, meaning not ready and unable to process new incoming events. Keep in mind that your system's duty cycle can fluctuate between 1 or 0 thousands of times per second; the duty cycle
 ready graphs you'll see in Grafana or InfluxDB will already be aggregated (more below).
ready
Description: ready aggregates (averages) the duty cycle values once per minute. While duty cycle is expressed as 0 (false, busy) or 1 (true, waiting), the ready metric represents the percentage of time the duty cycle is at 0 or 1. Therefore, the value of ready is a percentage anywhere between 0 and 1, so the graph does not look like a typical duty cycle graph.
Unit: Percentage expressed as a number, 0 to 1
Interpretation: Monitoring the duty cycle is critical to understanding your system's capacity. While every system is different, in general, ready should stay above 70%. If ready goes below 70%, that means the duty cycle has dropped to 0 (busy) more than 30% of the time in that interval, indicating that the system is quite busy and requires some attention or adjustment.
 The above graph shows that the majority of the time, the duty cycle was ready more than 90% of the time over the course of these two days. However, there are two points at which it dropped near and below 70%.
timedrift
The timedrift metric serves as a way to understand how much the timing of events' origins (usually @timestamp) varies from what the system considers to be the "current" time. This can be helpful for identifying issues like delays or inaccuracies in a microservice.
Each value is calculated once per minute by default:
avg
Average. This calculates the average time difference between when an event actually happened and when your system recorded it. If this number is high, it may indicate a consistent delay.
median
Median. This tells you the middle value of all timedrifts for a set interval, offering a more "typical" view of your system's timing accuracy. The median is less sensitive to outliers than average, since it is a value and not a calculation.
stddev
Standard deviation. This gives you an idea of how much the timedrift varies. A high standard deviation might mean that your timing is inconsistent, which could be problematic.
min
Minimum. This shows the smallest timedrift in your set of data. It's useful for understanding the best-case scenario in your system's timing accuracy.
max
Maximum. This indicates the largest time difference. This helps you understand the worst-case scenario, which is crucial for identifying the upper bounds of potential issues.
 In this graph of time drift, you can see a spike in lag before the pipeline returns to normal.
commlink
The commlink is the communication link between LogMan.io Collector and LogMan.io Receiver. These metrics are specific to data sent from the Collector microservice to the Receiver microservice.
Tags: ActivityState, appclass (LogMan.io Receiver only), host, identity, tenant
- bytes.in: bytes that enter LogMan.io Receiver
- event.in: events that enter LogMan.io Receiver
logs
Count of logs that pass through microservices.
Tags: appclass, host, identity, instance_id, node_id, service_id, tenant
- critical: Count of critical logs
- errors: Count of error logs
- warnings: Count of warning logs
Disk usage metrics
Monitor your disk usage carefully to avoid a common cause of system failure.
disk
Metrics to monitor disk usage. See the InfluxDB Telegraf plugin documentation for more.
Tags: device, fstype (file system type), mode, node_id, path
- free: Total amount of free disk space available on the storage device, measured in bytes
- inodes_free: The number of free inodes, which corresponds to the number of free file descriptors available on the file system.
- inodes_total: The total number of inodes or file descriptors that the file system supports.
- inodes_used: The number of inodes or file descriptors currently being used on the file system.
- total: Total capacity of the disk or storage device, measured in bytes.
- used: The amount of disk space currently in use, calculated in bytes.
- used_percent: The percentage of the disk space that is currently being used in relation to the total capacity.
diskio
Metrics to monitor disk traffic and timing. Consult the InfluxDB Telegraf plugin documentation for the definition of each metric.
Tags: name, node_id, wwid
- io_time
- iops_in_progress
- merged_reads
- merged_writes
- read_bytes
- read_time
- reads
- weighted_io_time
- write_bytes
- write_time
- writes
System performance metrics
cpu
Metrics to monitor system CPUs. See the InfluxDB Telegraf plugin documentation for more.
Tags: ActivityState, cpu, node_id
- time_active: Total time the CPU has been active, performing tasks excluding idle time.
- time_guest: Time spent running a virtual CPU for guest operating systems.
- time_guest_nice: Time the CPU spent running a niced guest (a guest with a positive niceness value).
- time_idle: Total time the CPU was not in use (idle).
- time_iowait: Time the CPU was idle while waiting for I/O operations to complete.
- time_irq: Time spent handling hardware interrupts.
- time_nice: Time the CPU spent processing user processes with a positive niceness value.
- time_softirq: Time spent handling software interrupts.
- time_steal: Time that a virtual CPU waited for a real CPU while the hypervisor was servicing another virtual processor.
- time_system: Time the CPU spent running system (kernel) processes.
- time_user: Time spent on executing user processes.
- usage_active: Percentage of time the CPU was active, performing tasks.
- usage_guest: Percentage of CPU time spent running virtual CPUs for guest OSes.
- usage_guest_nice: Percentage of CPU time spent running niced guests.
- usage_idle: Percentage of time the CPU was idle.
- usage_iowait: Percentage of time the CPU was idle due to waiting for I/O operations.
- usage_irq: Percentage of time spent handling hardware interrupts.
- usage_nice: Percentage of CPU time spent on processes with a positive niceness.
- usage_softirq: Percentage of time spent handling software interrupts.
- usage_steal: Percentage of time a virtual CPU waited for a real CPU while the hypervisor serviced another processor.
- usage_system: Percentage of CPU time spent on system (kernel) processes.
- usage_user: Percentage of CPU time spent executing user processes.
mdstat
Statistics about Linux MD RAID arrays configured on the host. RAID (redundant array of inexpensive or independent disks) combines multiple physical disks into one unit for the purpose of data redundancy (and therefore safety or protection against loss in the case of disk failure) as well as system performance (faster data access). Visit the InfluxDB Telegraf plugin documentation for more.
Tags: ActivityState (active or inactive), Devices, Name, _field, node_id
- BlocksSynced: The count of blocks that have been scanned if the array is rebuilding/checking
- BlocksSyncedFinishTime: Minutes remaining in the expected finish time of the rebuild scan
- BlocksSyncedPct: Percentage remaining of the rebuild scan
- BlocksSyncedSpeed: The current speed the rebuild is running at, listed in K/sec
- BlocksTotal: The count of total blocks in the array
- DisksActive: Number of disks in the array that are currently considered healthy
- DisksDown: Number of disks in the array that are currently down, or non-operational
- DisksFailed: Count of currently failed disks in the array
- DisksSpare: Count of spare disks in the array
- DisksTotal: Count of total disks in the array
processes
All processes, grouped by status. Find the InfluxDB Telegraf plugin documentation here.
Tags: node_id
- blocked: Number of processes in a blocked state, waiting for resource or event to become available.
- dead: Number of processes that have finished execution but still have an entry in the process table.
- idle: Number of processes in an idle state, typically indicating they are not actively doing any work.
- paging: Number of processes that are waiting for paging, either swapping into our out from disk.
- running: Number of processes that are currently executing or ready to execute.
- sleeping: Number of processes that are in a sleep state, inactive until certain conditions are met or events occur.
- stopped: Number of processes that are stopped, typically due to receiving a signal or being in debug.
- total: Total number of processes currently existing in the system.
- total_threads: The total number of threads across all processes, as processes can have multiple threads.
- unknown: Number of processes in an unknown state, where their state can't be determined.
- zombies: Number of zombie processes, which have completed execution but still have an entry in the process table due to the parent process not reading its exit status.
system
These metrics provide general information about the system load, uptime, and number of users logged in. Visit the InfluxDB Telegraf plugin for details.
Tags: node_id
- load1: The average system load over the last one minute, indicating the number of processes in the system's run queue.
- load15: The average system load over the last 15 minutes, providing a longer-term view of the recent system load.
- load5: The average system load over the last 5 minutes, offering a shorter-term perspective of the recent system load.
- n_cpus: The number of CPU cores available in the system.
- uptime: The total time in seconds that the system has been running since its last startup or reboot.
temp
Temperature readings as collected by system sensors. Visit the InfluxDB Telegraf plugin documentation for details.
Tags: node_id, sensor
- temp: Temperature
Network-specific metrics
net
Metrics for network interface and protocol usage for Linux systems. Monitoring the volume of data transfer and potential errors is important to understanding the network health and performance. Visit the InfluxDB Telegraf plugin documentation for details.
Tags: interface, node_id
bytes fields: Monitoring the volume of data transfer, which is important to bandwidth management and network capacity planning.
- bytes_recv: The total number of bytes received by the interface
- bytes_sent: The total number of bytes sent by the interface
drop fields: Dropped packets are often a sign of network congestion, hardware issues, or incorrect configurations. Dropped packets can lead to performance degradation.
- drop_in: The total number of received packets dropped by the interface
- drop_out: The total number of transmitted packets dropped by the interface
error fields: High error rates can signal issues with the network hardware, interference, or configuration problems.
- err_in: The total number of receive errors detected by the interface
- err_out: The total number of transmit errors detected by the interface
packet fields: The number of packets sent and received gives an indication of network traffic and can help identify if the network is under heavy load or if there are issues with packet transmission.
- packets_recv: The total number of packets sent by the interface
- packets_sent: The total number of packets received by the interface
nstat
Network metrics. Visit the InfluxDB Telegraf plugin documentation for more.
Tags: name, node_id
ICMP fields
ICMP (internet control message protocol) metrics are used for network diagnostics and control messages, like error reporting and operational queries. Visit this page for additional field definitions.
Key terms:
- Echo requests/replies (ping): Used to test reachability and round-trip time.
- Destination unreachable: Indicates that a destination is unreachable.
- Parameter problems: Signals issues with IP header parameters.
- Redirect messages: Instructs to use a different route.
- Time exceeded messages: Indicates that the time to live (TTL) for a packet has expired.
IP fields
IP (internet protocol) metrics monitor the core protocol for routing packets across the internet and local networks.
Visit this page for additional field definitions.
Key terms:
- Address errors: Errors related to incorrect or unreachable IP addresses.
- Header errors: Problems in the IP header, such as incorrect checksums or formatting issues.
- Delivered packets: Packets successfully delivered to their destination.
- Discarded packets: Packets discarded due to errors or lack of buffer space.
- Forwarded datagrams: Packets routed to their next hop towards the destination.
- Reassembly failures: Failure in reassembling fragmented IP packets.
- IPv6 multicast/broadcast packets: Packets sent to multiple destinations or all nodes in a network segment in IPv6.
TCP fields
These metrics monitor the TCP, or transmission control protocol, which provides reliable, ordered, and error-checked delivery of data between applications. Visit this page for additional field definitions.
Key terms:
- Connection opens: Initiating a new TCP connection.
- Segments: Units of data transmission in TCP.
- Reset segments (RST): Used to abruptly close a connection.
- Retransmissions: Resending data that was not successfully received.
- Active/passive connection openings: Connections initiated actively (outgoing) or passively (incoming).
- Checksum errors: Errors detected in the TCP segment checksum.
- Timeout retransmissions: Resending data after a timeout, indicating potential packet loss.
UDP fields
These metrics monitor the UDP, or user datagram protocol, which facilitates low-latency (low-delay) but less reliable data transmission compared to TCP. Visit this page for additional field definitions.
- Datagrams: Basic transfer units in UDP.
- Receive/send buffer errors: Errors due to insufficient buffer space for incoming/outgoing data.
- No ports: Datagrams sent to a port with no listener.
- Checksum errors: Errors in the checksum field of UDP datagrams.
All nstat fields
- Icmp6InCsumErrors
- Icmp6InDestUnreachs
- Icmp6InEchoReplies
- Icmp6InEchos
- Icmp6InErrors
- Icmp6InGroupMembQueries
- Icmp6InGroupMembReductions
- Icmp6InGroupMembResponses
- Icmp6InMLDv2Reports
- Icmp6InMsgs
- Icmp6InNeighborAdvertisements
- Icmp6InNeighborSolicits
- Icmp6InParmProblems
- Icmp6InPktTooBigs
- Icmp6InRedirects
- Icmp6InRouterAdvertisements
- Icmp6InRouterSolicits
- Icmp6InTimeExcds
- Icmp6OutDestUnreachs
- Icmp6OutEchoReplies
- Icmp6OutEchos
- Icmp6OutErrors
- Icmp6OutGroupMembQueries
- Icmp6OutGroupMembReductions
- Icmp6OutGroupMembResponses
- Icmp6OutMLDv2Reports
- Icmp6OutMsgs
- Icmp6OutNeighborAdvertisements
- Icmp6OutNeighborSolicits
- Icmp6OutParmProblems
- Icmp6OutPktTooBigs
- Icmp6OutRedirects
- Icmp6OutRouterAdvertisements
- Icmp6OutRouterSolicits
- Icmp6OutTimeExcds
- Icmp6OutType133
- Icmp6OutType135
- Icmp6OutType143
- IcmpInAddrMaskReps
- IcmpInAddrMasks
- IcmpInCsumErrors
- IcmpInDestUnreachs
- IcmpInEchoReps
- IcmpInEchos
- IcmpInErrors
- IcmpInMsgs
- IcmpInParmProbs
- IcmpInRedirects
- IcmpInSrcQuenchs
- IcmpInTimeExcds
- IcmpInTimestampReps
- IcmpInTimestamps
- IcmpMsgInType3
- IcmpMsgOutType3
- IcmpOutAddrMaskReps
- IcmpOutAddrMasks
- IcmpOutDestUnreachs
- IcmpOutEchoReps
- IcmpOutEchos
- IcmpOutErrors
- IcmpOutMsgs
- IcmpOutParmProbs
- IcmpOutRedirects
- IcmpOutSrcQuenchs
- IcmpOutTimeExcds
- IcmpOutTimestampReps
- IcmpOutTimestamps
- Ip6FragCreates
- Ip6FragFails
- Ip6FragOKs
- Ip6InAddrErrors
- Ip6InBcastOctets
- Ip6InCEPkts
- Ip6InDelivers
- Ip6InDiscards
- Ip6InECT0Pkts
- Ip6InECT1Pkts
- Ip6InHdrErrors
- Ip6InMcastOctets
- Ip6InMcastPkts
- Ip6InNoECTPkts
- Ip6InNoRoutes
- Ip6InOctets
- Ip6InReceives
- Ip6InTooBigErrors
- Ip6InTruncatedPkts
- Ip6InUnknownProtos
- Ip6OutBcastOctets
- Ip6OutDiscards
- Ip6OutForwDatagrams
- Ip6OutMcastOctets
- Ip6OutMcastPkts
- Ip6OutNoRoutes
- Ip6OutOctets
- Ip6OutRequests
- Ip6ReasmFails
- Ip6ReasmOKs
- Ip6ReasmReqds
- Ip6ReasmTimeout
- IpDefaultTTL
- IpExtInBcastOctets
- IpExtInBcastPkts
- IpExtInCEPkts
- IpExtInCsumErrors
- IpExtInECT0Pkts
- IpExtInECT1Pkts
- IpExtInMcastOctets
- IpExtInMcastPkts
- IpExtInNoECTPkts
- IpExtInNoRoutes
- IpExtInOctets
- IpExtInTruncatedPkts
- IpExtOutBcastOctets
- IpExtOutBcastPkts
- IpExtOutMcastOctets
- IpExtOutMcastPkts
- IpExtOutOctets
- IpForwDatagrams
- IpForwarding
- IpFragCreates
- IpFragFails
- IpFragOKs
- IpInAddrErrors
- IpInDelivers
- IpInDiscards
- IpInHdrErrors
- IpInReceives
- IpInUnknownProtos
- IpOutDiscards
- IpOutNoRoutes
- IpOutRequests
- IpReasmFails
- IpReasmOKs
- IpReasmReqds
- IpReasmTimeout
- TcpActiveOpens
- TcpAttemptFails
- TcpCurrEstab
- TcpEstabResets
- TcpExtArpFilter
- TcpExtBusyPollRxPackets
- TcpExtDelayedACKLocked
- TcpExtDelayedACKLost
- TcpExtDelayedACKs
- TcpExtEmbryonicRsts
- TcpExtIPReversePathFilter
- TcpExtListenDrops
- TcpExtListenOverflows
- TcpExtLockDroppedIcmps
- TcpExtOfoPruned
- TcpExtOutOfWindowIcmps
- TcpExtPAWSActive
- TcpExtPAWSEstab
- TcpExtPAWSPassive
- TcpExtPruneCalled
- TcpExtRcvPruned
- TcpExtSyncookiesFailed
- TcpExtSyncookiesRecv
- TcpExtSyncookiesSent
- TcpExtTCPACKSkippedChallenge
- TcpExtTCPACKSkippedFinWait2
- TcpExtTCPACKSkippedPAWS
- TcpExtTCPACKSkippedSeq
- TcpExtTCPACKSkippedSynRecv
- TcpExtTCPACKSkippedTimeWait
- TcpExtTCPAbortFailed
- TcpExtTCPAbortOnClose
- TcpExtTCPAbortOnData
- TcpExtTCPAbortOnLinger
- TcpExtTCPAbortOnMemory
- TcpExtTCPAbortOnTimeout
- TcpExtTCPAutoCorking
- TcpExtTCPBacklogDrop
- TcpExtTCPChallengeACK
- TcpExtTCPDSACKIgnoredNoUndo
- TcpExtTCPDSACKIgnoredOld
- TcpExtTCPDSACKOfoRecv
- TcpExtTCPDSACKOfoSent
- TcpExtTCPDSACKOldSent
- TcpExtTCPDSACKRecv
- TcpExtTCPDSACKUndo
- TcpExtTCPDeferAcceptDrop
- TcpExtTCPDirectCopyFromBacklog
- TcpExtTCPDirectCopyFromPrequeue
- TcpExtTCPFACKReorder
- TcpExtTCPFastOpenActive
- TcpExtTCPFastOpenActiveFail
- TcpExtTCPFastOpenCookieReqd
- TcpExtTCPFastOpenListenOverflow
- TcpExtTCPFastOpenPassive
- TcpExtTCPFastOpenPassiveFail
- TcpExtTCPFastRetrans
- TcpExtTCPForwardRetrans
- TcpExtTCPFromZeroWindowAdv
- TcpExtTCPFullUndo
- TcpExtTCPHPAcks
- TcpExtTCPHPHits
- TcpExtTCPHPHitsToUser
- TcpExtTCPHystartDelayCwnd
- TcpExtTCPHystartDelayDetect
- TcpExtTCPHystartTrainCwnd
- TcpExtTCPHystartTrainDetect
- TcpExtTCPKeepAlive
- TcpExtTCPLossFailures
- TcpExtTCPLossProbeRecovery
- TcpExtTCPLossProbes
- TcpExtTCPLossUndo
- TcpExtTCPLostRetransmit
- TcpExtTCPMD5NotFound
- TcpExtTCPMD5Unexpected
- TcpExtTCPMTUPFail
- TcpExtTCPMTUPSuccess
- TcpExtTCPMemoryPressures
- TcpExtTCPMinTTLDrop
- TcpExtTCPOFODrop
- TcpExtTCPOFOMerge
- TcpExtTCPOFOQueue
- TcpExtTCPOrigDataSent
- TcpExtTCPPartialUndo
- TcpExtTCPPrequeueDropped
- TcpExtTCPPrequeued
- TcpExtTCPPureAcks
- TcpExtTCPRcvCoalesce
- TcpExtTCPRcvCollapsed
- TcpExtTCPRenoFailures
- TcpExtTCPRenoRecovery
- TcpExtTCPRenoRecoveryFail
- TcpExtTCPRenoReorder
- TcpExtTCPReqQFullDoCookies
- TcpExtTCPReqQFullDrop
- TcpExtTCPRetransFail
- TcpExtTCPSACKDiscard
- TcpExtTCPSACKReneging
- TcpExtTCPSACKReorder
- TcpExtTCPSYNChallenge
- TcpExtTCPSackFailures
- TcpExtTCPSackMerged
- TcpExtTCPSackRecovery
- TcpExtTCPSackRecoveryFail
- TcpExtTCPSackShiftFallback
- TcpExtTCPSackShifted
- TcpExtTCPSchedulerFailed
- TcpExtTCPSlowStartRetrans
- TcpExtTCPSpuriousRTOs
- TcpExtTCPSpuriousRtxHostQueues
- TcpExtTCPSynRetrans
- TcpExtTCPTSReorder
- TcpExtTCPTimeWaitOverflow
- TcpExtTCPTimeouts
- TcpExtTCPToZeroWindowAdv
- TcpExtTCPWantZeroWindowAdv
- TcpExtTCPWinProbe
- TcpExtTW
- TcpExtTWKilled
- TcpExtTWRecycled
- TcpInCsumErrors
- TcpInErrs
- TcpInSegs
- TcpMaxConn
- TcpOutRsts
- TcpOutSegs
- TcpPassiveOpens
- TcpRetransSegs
- TcpRtoAlgorithm
- TcpRtoMax
- TcpRtoMin
- Udp6IgnoredMulti
- Udp6InCsumErrors
- Udp6InDatagrams
- Udp6InErrors
- Udp6NoPorts
- Udp6OutDatagrams
- Udp6RcvbufErrors
- Udp6SndbufErrors
- UdpIgnoredMulti
- UdpInCsumErrors
- UdpInDatagrams
- UdpInErrors
- UdpLite6InCsumErrors
- UdpLite6InDatagrams
- UdpLite6InErrors
- UdpLite6NoPorts
- UdpLite6OutDatagrams
- UdpLite6RcvbufErrors
- UdpLite6SndbufErrors
- UdpLiteIgnoredMulti
- UdpLiteInCsumErrors
- UdpLiteInDatagrams
- UdpLiteInErrors
- UdpLiteNoPorts
- UdpLiteOutDatagrams
- UdpLiteRcvbufErrors
- UdpLiteSndbufErrors
- UdpNoPorts
- UdpOutDatagrams
- UdpRcvbufErrors
- UdpSndbufErrors
Authorization-specific metrics
TeskaLabs SeaCat Auth (as seen in tag appclass) handles all LogMan.io authorization, including credentials, logins, and sessions.
credentials
Tags: appclass (SeaCat Auth only), host, instance_id, node_id, service_id
- default: The number of credentials (user accounts) existing in your deployment of TeskaLabs LogMan.io.
logins
Count of failed and successful logins via TeskaLabs SeaCat Auth.
Tags: appclass (SeaCat Auth only), host, insance_id, node_id, service_id
- failed: Counts failed login attempts. Reports at the time of the login.
- successful: Counts successful logins. Reports at the time of the login.
sessions
A session begins any time a user logs in to LogMan.io, so the sessions metric counts open sessions.
Tags: appclass (SeaCat Auth only), host, instance_id, node_id, service_id
- sessions: Number of sessions open at the time
Memory metrics
By monitoring memory usage metrics, you can understand how memory resources are being used. This, in turn, can provide insights into areas that may need optimization or adjustment.
memory and os.stat
Tags: appclass, host, identity, instance_id, node_id, service_id, tenant
VmPeak
Meaning: Peak virtual memory size. This is the peak or current total of virtual memory being used by the microservice. Virtual memory includes both physical RAM and disk swap space (the sum of all virtual memory areas involved in the process).
Interpretation: Monitoring the peak can help you identify if a service is using more memory than expected, potentially indicating a memory leak or a requirement for optimization.
VmLck
Meaning: Locked memory size. This indicates the portion of memory that is locked in RAM and can't be swapped out to disk.
Interpretation: A high amount of locked memory could potentially reduce the system's flexibility in managing memory, which might lead to performance issues.
VmPin
Meaning: Pinned memory size. This is the portion of memory that is "pinned" in place; a memory page's physical location can't be changed within RAM automatically or swapped out to disk.
Interpretation: Like locked memory, pinned memory can't be moved, so a high value could also limit system flexibility.
VmHWM
Meaning: Peak resident set size ("high water mark"). This is the maximum amount of physical RAM that the microservice has used.
Interpretation: If this value is consistently high, it might indicate that the service needs optimization or that you need to allocate more physical RAM.
VmRSS
Meaning: Resident set size. This shows the portion of the microservice's memory that is held in RAM.
Interpretation: A high RSS value could mean your service is using a lot of RAM, potentially leading to performance issues if it starts to swap.
VmData, VmStk, VmExe
Meaning: Size of data, stack, and text segments. These values represent the sizes of different memory segments: data, stack, and executable code.
Interpretation: Monitoring these can help you understand the memory footprint of your service and can be useful for debugging or optimizing your code.
VmLib
Meaning: Shared library code size. This counts executable pages with a VmExe subtracted, and shows the amount of memory used by shared libraries in the process.
Interpretation: If this is high, you may want to check whether all the libraries are necessary, as they add to the memory footprint.
VmPTE
Meaning: Page table entries size. This indicates the size of the page table, which maps virtual memory to physical memory.
Interpretation: A large size might signify that a lot of memory is being used, which could be an issue if it grows too much.
VmSize
Meaning: Size of second-level page tables. This is an extension of VmPTE, indicating the size of the second-level page tables.
Interpretation: Like VmPTE, monitoring this size helps in identifying potential memory issues.
VmSwap
Meaning: Swapped-out virtual memory size. This indicates the amount of virtual memory that has been swapped out to disk. shmem swap is not included.
Interpretation: Frequent swapping is generally bad for performance; thus, if this metric is high, you may need to allocate more RAM or optimize your services.
mem
Additional masurements regarding memory. Visit the InfluxDB Telegraf plugin documentation for details.
-
Tags:
node_id -
active: Memory currently in use or very recently used, and thus not immediately available for eviction.
- available: The amount of memory that is readily available for new processes without swapping.
- available_percent: The percentage of total memory that is readily available for new processes.
- buffered: Memory used by the kernel for things like file system metadata, distinct from caching.
- cached: Memory used to store recently used data for quick access, not immediately freed when processes no longer require it.
- commit_limit: The total amount of memory that can be allocated to processes, including both RAM and swap space.
- committed_as: The total amount of memory currently allocated by processes, even if not used.
- dirty: Memory pages that have been modified but not yet written to their respective data location in storage.
- free: The amount of memory that is currently unoccupied and available for use.
- high_free: The amount of free memory in the system's high memory area (memory beyond direct kernel access).
- high_total: The total amount of system memory in the high memory area.
- huge_page_size: The size of each huge page (larger-than-standard memory pages used by the system).
- huge_pages_free: The number of huge pages that are not currently being used.
- huge_pages_total: The total number of huge pages available in the system.
- inactive: Memory that has not been used recently and can be made available for other processes or disk caching.
- low_free: The amount of free memory in the system's low memory area (memory directly accessible by the kernel).
- low_total: The total amount of system memory in the low memory area.
- mapped: Memory used for mapped files, such as libraries and executable files in memory.
- page_tables: Memory used by the kernel to keep track of virtual memory to physical memory mappings.
- shared: Memory used by multiple processes, or shared between processes and the kernel.
- slab: Memory used by the kernel for caching data structures.
- sreclaimable: Part of the slab memory that can be reclaimed, such as caches that can be freed if necessary.
- sunreclaim: Part of the slab memory that cannot be reclaimed under memory pressure.
- swap_cached: Memory that has been swapped out to disk but is still in RAM.
- swap_free: The amount of swap space currently not being used.
- swap_total: The total amount of swap space available.
- total: The total amount of physical RAM available in the system.
- used: The amount of memory that is currently being used by processes.
- used_percent: The percentage of total memory that is currently being used.
- vmalloc_chunk: The largest contiguous block of memory available in the kernel's vmalloc space.
- vmalloc_total: The total amount of memory available in the kernel's vmalloc space.
- vmalloc_used: The amount of memory currently used in the kernel's vmalloc space.
- write_back: Memory which is currently being written back to the disk.
- write_back_tmp: Temporary memory used during write-back operations.
Kernel-specific metrics
kernel
Metrics to monitor the Linux kernel. Visit the InfluxDB Telegraf plugin documentation for more details.
Tags: node_id
- boot_time: The time when the system was last booted, measured in seconds since the Unix epoch (January 1, 1970). This tells you the system uptime and time of last restart. You can convert this number to a date using a (Unix epoch time converter).
- context_switches: The number (count, integer) of context switches the kernel has performed. A context switch occurs when the CPU switches from one process or thread to another. A high number of context switches can indicate that many processes are competing for CPU time, which can be a sign of high system load.
- entropy_avail: The amount (integer) of available entropy (randomness that can be generated) in the system, which is essential for secure random number generation. Low entropy can affect cryptographic functions and secure communications. Entropy is consumed by various operations and replenished over time, so monitoring this metric is important for maintaining security.
- interrupts: The total number (count, integer) of interrupts processed since boot. An interrupt is a signal to the processor emitted by hardware or software indicating an event that needs immediate attention. High numbers of interrupts can indicate a busy or possibly overloaded system.
- processes_forked: The total number (count, integer) of processes that have been forked (created) since the system was booted. Tracking the rate of process creation can help in diagnosing system performance issues, especially in environments where processes are frequently started and stopped.
kernel_vmstat
Kernel virtual memory statistics gathered via proc/vmstat. Visit the InfluxDB Telegraf plugin documentation for more details.
Relevant terms
- Active pages: Pages currently in use or recently used.
- Inactive pages: Pages not recently used, and therefore more likely to be moved to swap space or reclaimed.
- Anonymous pages: Memory pages not backed by a file on disk; typically used for data that does not need to be persisted, such as program stacks.
- Bounce buffer: Temporary memory used to facilitate data transfers between devices that cannot directly address each other’s memory.
- Compaction: The process of rearranging pages in memory to create larger contiguous free spaces, often useful for allocating huge pages.
- Dirty pages: Pages that have been modified in memory but have not yet been written back to disk.
- Evict: The process of removing pages from physical memory, either by moving them to disk (swapping out) or discarding them if they are no longer needed.
- File-backed pages: Memory pages that are associated with files on the disk, such as executable files or data files.
- Free pages: Memory pages that are available for use and not currently allocated to any process or data.
- Huge pages: Large memory pages that can be used by processes, reducing the overhead of page tables.
- Interleave: The process of distributing memory pages across different memory nodes or zones, typically to optimize performance in systems with non-uniform memory access (NUMA).
- NUMA (non-uniform memory access): A memory design where a processor accesses its own local memory faster than non-local memory.
- Page allocation: The process of assigning free memory pages to fulfill a request by a process or the kernel.
- Page fault: An event that occurs when a program tries to access a page that is not in physical memory, requiring the OS to handle this by allocating a page or retrieving it from disk.
- Page table: Data structure used by the operating system to store the mapping between virtual addresses and physical memory addresses.
- Shared memory (shmem): Memory that can be accessed by multiple processes.
- Slab pages: Memory pages used by the kernel to store objects of fixed sizes, such as file structures or inode caches.
- Swap space: A space on the disk used to store memory pages that have been evicted from physical memory.
- THP (transparent huge pages): A feature that automatically manages the allocation of huge pages to improve performance without requiring changes to applications.
- Vmscan: A kernel process that scans memory pages and decides which pages to evict or swap out based on their usage.
- Writeback: The process of writing dirty pages back to disk.
Tags: node_id
- nr_free_pages: Number of free pages in the system.
- nr_inactive_anon: Number of inactive anonymous pages.
- nr_active_anon: Number of active anonymous pages.
- nr_inactive_file: Number of inactive file-backed pages.
- nr_active_file: Number of active file-backed pages.
- nr_unevictable: Number of pages that cannot be evicted from memory.
- nr_mlock: Number of pages locked into memory (mlock).
- nr_anon_pages: Number of anonymous pages.
- nr_mapped: Number of pages mapped into userspace.
- nr_file_pages: Number of file-backed pages.
- nr_dirty: Number of pages currently dirty.
- nr_writeback: Number of pages under writeback.
- nr_slab_reclaimable: Number of reclaimable slab pages.
- nr_slab_unreclaimable: Number of unreclaimable slab pages.
- nr_page_table_pages: Number of pages used for page tables.
- nr_kernel_stack: Amount of kernel stack pages.
- nr_unstable: Number of unstable pages.
- nr_bounce: Number of bounce buffer pages.
- nr_vmscan_write: Number of pages written by vmscan.
- nr_writeback_temp: Number of temporary writeback pages.
- nr_isolated_anon: Number of isolated anonymous pages.
- nr_isolated_file: Number of isolated file pages.
- nr_shmem: Number of shared memory pages.
- numa_hit: Number of pages allocated in the preferred node.
- numa_miss: Number of pages allocated in a non-preferred node.
- numa_foreign: Number of pages intended for another node.
- numa_interleave: Number of interleaved hit pages.
- numa_local: Number of pages allocated on the local node.
- numa_other: Number of pages allocated on other nodes.
- nr_anon_transparent_hugepages: Number of anonymous transparent huge pages.
- pgpgin: Number of kilobytes read from disk.
- pgpgout: Number of kilobytes written to disk.
- pswpin: Number of pages swapped in.
- pswpout: Number of pages swapped out.
- pgalloc_dma: Number of DMA zone pages allocated.
- pgalloc_dma32: Number of DMA32 zone pages allocated.
- pgalloc_normal: Number of normal zone pages allocated.
- pgalloc_movable: Number of movable zone pages allocated.
- pgfree: Number of pages freed.
- pgactivate: Number of inactive pages activated.
- pgdeactivate: Number of active pages deactivated.
- pgfault: Number of page faults.
- pgmajfault: Number of major page faults.
- pgrefill_dma: Number of DMA zone pages refilled.
- pgrefill_dma32: Number of DMA32 zone pages refilled.
- pgrefill_normal: Number of normal zone pages refilled.
- pgrefill_movable: Number of movable zone pages refilled.
- pgsteal_dma: Number of DMA zone pages reclaimed.
- pgsteal_dma32: Number of DMA32 zone pages reclaimed.
- pgsteal_normal: Number of normal zone pages reclaimed.
- pgsteal_movable: Number of movable zone pages reclaimed.
- pgscan_kswapd_dma: Number of DMA zone pages scanned by kswapd.
- pgscan_kswapd_dma32: Number of DMA32 zone pages scanned by kswapd.
- pgscan_kswapd_normal: Number of normal zone pages scanned by kswapd.
- pgscan_kswapd_movable: Number of movable zone pages scanned by kswapd.
- pgscan_direct_dma: Number of DMA zone pages directly scanned.
- pgscan_direct_dma32: Number of DMA32 zone pages directly scanned.
- pgscan_direct_normal: Number of normal zone pages directly scanned.
- pgscan_direct_movable: Number of movable zone pages directly scanned.
- zone_reclaim_failed: Number of failed zone reclaim attempts.
- pginodesteal: Number of inodes pages reclaimed.
- slabs_scanned: Number of slab pages scanned.
- kswapd_steal: Number of pages reclaimed by kswapd.
- kswapd_inodesteal: Number of inode pages reclaimed by kswapd.
- kswapd_low_wmark_hit_quickly: Frequency of kswapd hitting low watermark quickly.
- kswapd_high_wmark_hit_quickly: Frequency of kswapd hitting high watermark quickly.
- kswapd_skip_congestion_wait: Number of times kswapd skipped wait due to congestion.
- pageoutrun: Number of pageout pages processed.
- allocstall: Number of times page allocation stalls.
- pgrotated: Number of pages rotated.
- compact_blocks_moved: Number of blocks moved during compaction.
- compact_pages_moved: Number of pages moved during compaction.
- compact_pagemigrate_failed: Number of page migrations failed during compaction.
- compact_stall: Number of stalls during compaction.
- compact_fail: Number of compaction failures.
- compact_success: Number of successful compactions.
- htlb_buddy_alloc_success: Number of successful HTLB buddy allocations.
- htlb_buddy_alloc_fail: Number of failed HTLB buddy allocations.
- unevictable_pgs_culled: Number of unevictable pages culled.
- unevictable_pgs_scanned: Number of unevictable pages scanned.
- unevictable_pgs_rescued: Number of unevictable pages rescued.
- unevictable_pgs_mlocked: Number of unevictable pages mlocked.
- unevictable_pgs_munlocked: Number of unevictable pages munlocked.
- unevictable_pgs_cleared: Number of unevictable pages cleared.
- unevictable_pgs_stranded: Number of unevictable pages stranded.
- unevictable_pgs_mlockfreed: Number of mlock-freed unevictable pages.
- thp_fault_alloc: Number of times a fault caused THP allocation.
- thp_fault_fallback: Number of times a fault fell back from THP.
- thp_collapse_alloc: Number of THP collapses allocated.
- thp_collapse_alloc_failed: Number of failed THP collapse allocations.
- thp_split: Number of THP splits.
Tenant metrics
You can investigate the health and status of microservices on a tenant-specific basis if you have multiple LogMan.io tenants in your system. Tenant metrics are specific to LogMan.io Parser, Dispatcher, Correlator, and Watcher microservices.
Naming and tags in Grafana and InfluxDB
- Tenant metrics groups are under the
measurementtag. - Tenant metrics are produced for select microservices (tag
appclass) and can be further filtered with the additional tagshostandpipeline. - Each individual metric (for example,
eps.in) is a value in thefieldtag.
The tags are pipeline (ID of the pipeline), host (hostname of the microservice) and tenant (the lowercase name of the tenant). Visit the Pipeline metrics page for more in-depth explanations and guides for interpreting each metric.
bspump.pipeline.tenant.eps
A counter metric with following values, updated once per minute:
eps.in: The tenant's events per second entering the pipeline.eps.aggr: The tenant's aggregated events (number is multiplied bycntattribute in events) per second entering the pipeline.eps.drop: The tenant's events per second dropped in the pipeline.eps.out: The tenant's events per second successfully leaving the pipeline.warning: The tenant's number of warnings produced in the pipeline in the specified time interval.error: the tenant's number of errors produced in the pipeline in the specified time interval.
In LogMan.io Parser, the most relevant metrics come from ParsersPipeline (when the data first enters the Parser and gets parsed via preprocessors and parsers) and EnrichersPipeline. In LogMan.io Dispatcher, the most relevant metrics come from EventsPipeline and OthersPipeline.
bspump.pipeline.tenant.load
A counter metric with following values, updated once per minute:
load.in: The tenant's byte size of all events entering the pipeline in the specified time interval.load.out: the tenant's byte size of all events leaving the pipeline in the specified time interval.
Correlator metrics
The following metrics are specific for LogMan.io Correlator. Detections (also known as correlation rules) are based on the Correlator microservice.
Naming and tags in Grafana and InfluxDB
- Correlator metrics groups are under the
measurementtag. - Correlator metrics are only produced for the Correlator microservice (tag
appclass) and can be further filtered with the additional tagscorrelatorto isolate a single correlator, andhost. - Each individual metric (for example,
in) is a value in thefieldtag.
correlator.predicate
A counter metric that counts how many events went through the predicate section, or filter, of a detection. Each metric updates once per minute, so time interval refers to the period of about one minute.
in: Number events entering the predicate in the time interval.hit: Number events successfully matching the predicate (fulfilling the conditions of the filter) in the time interval.miss: Number events missing the predicate in the time interval (not fulfilling the conditions of the filter) and thus leaving the Correlator.error: Number of errors in the predicate in the time interval.
correlator.trigger
A counter metric that counts how many events went through the trigger section of the correlator. The trigger defines and carries out an action. Each metric updates once per minute, so time interval refers to the period of about one minute.
in: Number events entering the trigger in the time interval.out: Number events leaving the trigger in the time interval.error: Number of errors in the trigger in the time interval, should be equal toinminusout.
Continuity Plan
Risk matrix
The risk matrix defines the level of risk by considering the category of "Likelihood" of an incident occurring against the category of "Impact". Both categories are given a score between 1 and 5. By multiplying the scores for "Likelihood" and "Impact" together, a total risk score is be produced.
Likelihood
| Likelihood | Score |
|---|---|
| Rare | 1 |
| Unlikely | 2 |
| Possible | 3 |
| Likely | 4 |
| Almost certain | 5 |
Impact
| Impact | Score | Description |
|---|---|---|
| Insignificant | 1 | The functionality is not impacted, performance is not reduced, downtime is not needed. |
| Minor | 2 | The functionality is not impacted, the performance is not reduced, downtime of the impacted cluster node is needed. |
| Moderate | 3 | The functionality is not impacted, the performance is reduced, downtime of the impacted cluster node is needed. |
| Major | 4 | The functionality is impacted, the performance is significantly reduced, downtime of the cluster is needed. |
| Catastrophic | 5 | Total loss of functionality. |
Incident scenarios
Complete system failure
Impact: Catastrophic (5)
Likelihood: Rare (1)
Risk level: medium-high
Risk mitigation:
- Geographically distributed cluster
- Active use of monitoring and alerting
- Prophylactic maintenance
- Strong cyber-security posture
Recovery:
- Contact the support and/or vendor and consult the strategy.
- Restore the hardware functionality.
- Restore the system from the backup of the site configuration.
- Restore the data from the offline backup (start with the most fresh data and continue to the history).
Loss of the node in the cluster
Impact: Moderate (4)
Likelihood: Unlikely (2)
Risk level: medium-low
Risk mitigation:
- Geographically distributed cluster
- Active use of monitoring and alerting
- Prophylactic maintenance
Recovery:
- Contact the support and/or vendor and consult the strategy.
- Restore the hardware functionality.
- Restore the system from the backup of the site configuration.
- Restore the data from the offline backup (start with the most fresh data and continue to the history).
Loss of the fast storage drive in one node of the cluster
Impact: Minor (2)
Likelihood: Possible (3)
Risk level: medium-low
Fast drives are in RAID 1 array so the loss of one drive is non-critical. Ensure quick replacement of the failed drive to prevent a second fast drive failure. A second fast drive failure will escalate to a "Loss of the node in the cluster".
Risk mitigation:
- Active use of monitoring and alerting
- Prophylactic maintenance
- Timely replacement of the failed drive
Recovery:
- Turn off the impacted cluster node
- Replace failed fast storage drive ASAP
- Turn on the impacted cluster node
- Verify correct RAID1 array reconstruction
Note
Hot swap of the fast storage drive is supported on a specific customer request.
Fast storage space shortage
Impact: Moderate (3)
Likelihood: Possible (3)
Risk level: medium-high
This situation is problematic if it happens on multiple nodes of the cluster simultaneously. Use monitoring tools to identify this situation ahead of escalation.
Risk mitigation:
- Active use of monitoring and alerting
- Prophylactic maintenance
Recovery:
- Remove unnecessary data from the fast storage space.
- Adjust the life cycle configuration so that the data are moved to slow storage space sooner.
Loss of the slow storage drive in one node of the cluster
Impact: Insignificant (1)
Likelihood: Likely (4)
Risk level: medium-low
Slow drives are in RAID 5 or RAID 6 array so the loss of one drive is non-critical. Ensure quick replacement of the failed drive to prevent another drive failure. A second drive failure in RAID 5 or third drive failure in RAID 6 will escalate to a "Loss of the node in the cluster".
Risk mitigation:
- Active use of monitoring and alerting
- Prophylactic maintenance
- Timely replacement of the failed drive
Recovery:
- Replace failed slow storage drive ASAP (hot swap)
- Verify a correct slow storage RAID reconstruction
Slow storage space shortage
Impact: Moderate (3)
Likelihood: Likely (4)
Risk level: medium-high
This situation is problematic if it happens on multiple nodes of the cluster simultaneously. Use monitoring tools to identify this situation ahead of escalation.
Risk mitigation:
- Active use of monitoring and alerting
- Prophylactic maintenance
- Timely extension of the slow data storage size
Recovery:
- Remove unnecessary data from the slow storage space.
- Adjust the life cycle configuration so that the data are removed from slow storage space sooner.
Loss of the system drive in one node of the cluster
Impact: Minor (2)
Likelihood: Possible (3)
Risk level: medium-low
System drives are in RAID 1 array so the loss of one drive is non-critical. Ensure quick replacement of the failed drive to prevent a second fast drive failure. A second system drive failure will escalate to a "Loss of the node in the cluster".
Risk mitigation:
- Active use of monitoring and alerting
- Prophylactic maintenance
- Timely replacement of the failed drive
Recovery:
- Replace failed fast storage drive ASAP (how swap)
- Verify correct RAID1 array reconstruction
System storage space shortage
Impact: Moderate (3)
Likelihood: Rare (1)
Risk level: low
Use monitoring tools to identify this situation ahead of escalation.
Risk mitigation:
- Active use of monitoring and alerting
- Prophylactic maintenance
Recovery:
- Remove unnecessary data from the system storage space.
- Contact the support or the vendor.
Loss of the network connectivity in one node of the cluster
Impact: Minor (2)
Likelihood: Possible (3)
Risk level: medium-low
Risk mitigation:
- Active use of monitoring and alerting
- Prophylactic maintenance
- Redundant network connectivity
Recovery:
- Restore the network connectivity
- Verify the proper cluster operational condition
Failure of the Elasticsearch cluster
Impact: Major (4)
Likelihood: Possible (3)
Risk level: medium-high
Risk mitigation:
- Active use of monitoring and alerting
- Prophylactic maintenance
- Timely reaction to the deteriorating Elasticsearch cluster health
Recovery:
- Contact the support and/or vendor and consult the strategy.
Failure of the Elasticsearch node
Impact: Minor (2)
Likelihood: Likely (4)
Risk level: medium-low
Risk mitigation:
- Active use of monitoring and alerting
- Prophylactic maintenance
- Timely reaction to the deteriorating Elasticsearch cluster health
Recovery:
- Monitor an automatic Elasticsearch node rejoining to the cluster
- Contact the support / the vendor if the failure persists over several hours.
Failure of the Apache Kafka cluster
Impact: Major (4)
Likelihood: Rare (1)
Risk level: medium-low
Risk mitigation:
- Active use of monitoring and alerting
- Prophylactic maintenance
- Timely reaction to the deteriorating Apache Kafka cluster health
Recovery:
- Contact the support and/or vendor and consult the strategy.
Failure of the Apache Kafka node
Impact: Minor (2)
Likelihood: Rare (1)
Risk level: low
Risk mitigation:
- Active use of monitoring and alerting
- Prophylactic maintenance
- Timely reaction to the deteriorating Apache Kafka cluster
Recovery:
- Monitor an automatic Apache Kafka node rejoining to the cluster
- Contact the support / the vendor if the failure persists over several hours.
Failure of the Apache ZooKeeper cluster
Impact: Major (4)
Likelihood: Rare (1)
Risk level: medium-low
Risk mitigation:
- Active use of monitoring and alerting
- Prophylactic maintenance
- Timely reaction to the deteriorating Apache ZooKeeper cluster
Recovery:
- Contact the support and/or vendor and consult the strategy.
Failure of the Apache ZooKeeper node
Impact: Insignificant (1)
Likelihood: Rare (1)
Risk level: low
Risk mitigation:
- Active use of monitoring and alerting
- Prophylactic maintenance
- Timely reaction to the deteriorating Apache ZooKeeper cluster
Recovery:
- Monitor an automatic Apache ZooKeeper node rejoining to the cluster
- Contact the support / the vendor if the failure persists over several hours.
Failure of the stateless data path microservice (collector, parser, dispatcher, correlator, watcher)
Impact: Minor (2)
Likelihood: Possible (3)
Risk level: medium-low
Risk mitigation:
- Active use of monitoring and alerting
- Prophylactic maintenance
Recovery:
- Restart the failed microservice.
Failure of the stateless support microservice (all others)
Impact: Insignificant (1)
Likelihood: Possible (3)
Risk level: medium-low
Risk mitigation:
- Active use of monitoring and alerting
- Prophylactic maintenance
Recovery:
- Restart the failed microservice.
Significant reduction of the system performance
Impact: Moderate (3)
Likelihood: Possible (3)
Risk level: medium-high
Risk mitigation:
- Active use of monitoring and alerting
- Prophylactic maintenance
Recovery:
- Identify and remove the root cause of the reduction of the performance
- Contact the vendor or the support if help is needed
Backup and recovery strategy
Offline backup for the incoming logs
Incoming logs are duplicated to the offline backup storage that is not part of the active cluster of LogMan.io (hence is "offline"). Offline backup provides an option to restore logs to the LogMan.io after critical failure etc.
Backup strategy for the fast data storage
Incoming events (logs) are copied into the archive storage once they enter the LogMan.io. It means that there is always the way how to “replay” events into the TeskaLabs LogMan.in in case of need. Also, data are replicated to other nodes of the cluster immediately after arrival to the cluster. For this reason, traditional backup is not recommended but possible.
The restoration is handled by the cluster components by replicating the data from other nodes of the cluster.
Backup strategy for the slow data storage
The data stored on the slow data storage are ALWAYS replicated to other nodes of the cluster and also stored in the archive. For this reason, traditional backup is not recommended but possible (consider the huge size of the slow storage).
The restoration is handled by the cluster components by replicating the data from other nodes of the cluster.
Backup strategy for the system storage
It is recommended to periodically backup all file systems on the system storage so that they could be used for restoring the installation when needed. The backup strategy is compatible with most common backup technologies in the market.
- Recovery Point Objective (RPO): full backup once per week or after major maintenance work, incremental backup one per day.
- Recovery Time Objective (RTO): 12 hours.
Note
RPO and RTO are recommended, assuming highly available setup of the LogMan.io cluster. It means three and more nodes so that the complete downtime of the single node don’t impact service availability.
Generic backup and recovery rules
-
Data Backup: Regularly backup to a secure location, such as a cloud-based storage service, backup tapes, to minimize data loss in case of failures.
-
Backup Scheduling: Establish a backup schedule that meets the needs of the organization, such as daily, weekly, or monthly backups.
-
Backup Verification: Verify the integrity of backup data regularly to ensure that it can be used for disaster recovery.
-
Restoration Testing: Test the restoration of backup data regularly to ensure that the backup and recovery process is working correctly and to identify and resolve any issues before they become critical.
-
Backup Retention: Establish a backup retention policy that balances the need for long-term data preservation with the cost of storing backup data.
Monitoring and alerting
Monitoring is an important component of a Continuity Plan as it helps to detect potential failures early, identify the cause of failures, and support decision-making during the recovery process.
LogMan.io microservices provides OpenMetrics API and/or ship their telemetry into InfluxDB and uses Grafana as a monitoring tool.
-
Monitoring Strategy: OpenMetrics API is used to collect telemetry from all microservices in the cluster, Operating system and hardware. Telemetry is collected once per minute. InfluxDB is used to store the telemetry data. Grafana is used as the Web-based User interface for telemetry inspection.
-
Alerting and Notification: The monitoring system is configured to generate alerts and notifications in case of potential failures, such as low disk space, high resource utilization, or increased error rates.
-
Monitoring Dashboards: Monitoring dashboards are provided in Grafana that display the most important metrics for the system, such as resource utilization, error rates, and response times.
-
Monitoring Configuration: Regularly reviews and updates are provided for the monitoring configuration to ensure that it is effective and that it reflects changes in the system.
-
Monitoring Training: Trainings are provided for the monitoring team and other relevant parties on the monitoring system and the monitoring dashboards in Grafana.
High availability architecture
TeskaLabs LogMan.io is deployed in a highly available architecture (HA) with multiple nodes to reduce the risk of single points of failure.
High availability architecture is a design pattern that aims to ensure that a system remains operational and available, even in the event of failures or disruptions.
In a LogMan.io cluster, a high availability architecture includes the following components:
-
Load Balancing: Distribution of incoming traffic among multiple instances of microservices, thereby improving the resilience of the system and reducing the impact of failures.
-
Redundant Storage: Storing of data redundantly across multiple storage nodes to prevent data loss in the event of a storage failure.
-
Multiple Brokers: Use multiple brokers in Apache Kafka to improve the resilience of the messaging system and reduce the impact of broker failures.
-
Automatic Failover: Automatic failover mechanisms, such as leader election in Apache Kafka, to ensure that the system continues to function in the event of a cluster node failure.
-
Monitoring and Alerting: Usage of monitoring and alerting components to detect potential failures and trigger automatic failover mechanisms when necessary.
-
Rolling Upgrades: Upgrades to the system without disrupting its normal operation, by upgrading nodes one at a time, without downtime.
-
Data Replication: Replication of log across multiple cluster nodes to ensure that the system continues to function even if one or more nodes fail.
Communication plan
A clear and well-communicated plan for responding to failures and communicating with stakeholders helps to minimize the impact of failures and ensure that everyone is on the same page.
-
Stakeholder Identification: Identify all stakeholders who may need to be informed during and after a disaster, such as employees, customers, vendors, and partners.
-
Participating organizations: The LogMan.io operator, the integrating party and the vendor (TeskaLabs).
-
Communication Channels: Communication channels that will be used during and after a disaster are Slack, email, phone and SMS.
-
Escalation Plan: Specify an escalation plan to ensure that the right people are informed at the right time during a disaster, and that communication is coordinated and effective.
-
Update and Maintenance: Regularly update and maintain the communication plan to ensure that it reflects changes in the organization, such as new stakeholders or communication channels.
Reference
TeskaLabs LogMan.io Reference
Welcome to the Reference Guide. You can find definitions and details of every LogMan.io component here.
Collector
LogMan.io Collector
TeskaLabs LogMan.io Collector is a microservice responsible for collecting logs and other events from various inputs and sending them to LogMan.io Receiver.
- For the setup of event collection from other log sources, see the Log sources subtopic.
- For a description of a configuration, see Configuration for setup instructions.
- For the detailed configuration options, see Inputs, Transformations and Outputs.
- To create a log simulator, see Mirage.
- For the communication details between Collector and Receiver, see LogMan.io Receiver documentation.
Log sources
Collecting logs from Syslog
To collect logs from various Syslog sources, TeskaLabs LogMan.io Collector provides an option to setup a TCP and/or UDP receival port that conforms to a wide variety of Syslog protocols. You can simply configure a log source (for example Linux server or a network appliance) to send logs to the collector, typically to the port 514 (TCP and/or UDP) and TeskaLabs LogMan.io Collector will ingest these logs.
Tip
Syslog protocol typically uses port 514, TCP or UDP, but TeskaLabs LogMan.io Collector can be configured to use other ports as well.
To utilize this feature, configure your log sources to forward logs to port 514. TeskaLabs LogMan.io Collector will automatically detect the origin of the incoming data and categorize it into streams (event lanes) accordingly.
Smart classification
TeskaLabs LogMan.io Collector classifies incoming logs using a smart feature. This enables a convenient ability to configure all log sources to send logs to a TeskaLabs LogMan.io Collector IP address and a specific port, including a very simple network path configuration.
TeskaLabs LogMan.io Collector uses a classification map in its YAML configuration.
Configuration
This example shows a configuration of TeskaLabs LogMan.io Collector for using Syslog and a smart classification of the incoming logs on port 514 UDP and TCP.
Stream name is important
A stream name specified in configuration of LogMan.io Collector is important. LogMan.io selects a proper parsing rules, content and other components related to the log source based on the stream name. Read more about stream names here.
Here is an example of a minimal configuration in which all incoming logs will be sent to a stream generic.
classification:
smart514: &smart514 # YAML anchor referencing to both SmartDatagram and SmartStream inputs
# All events are sent to stream 'generic'
generic:
- ip: "*"
# Listen on the UDP 514
input:SmartDatagram:UDP514:
address: 514
smart: *smart514
output: smart
# Listen on the TCP 514
input:SmartStream:TCP514:
address: 514
smart: *smart514
output: smart
# Connection to LogMan.io
output:CommLink:smart: {}
Here is an example of configuration with four streams linux-syslog-rfc5424-1, fortinet-fortigate-1, fortinet-fortigate-2 and linux-rsyslog-1
with various options of how you can classify the incoming IP addresses, ports and protocols.
classification:
smart514: &smart514 # YAML anchor referencing to both SmartDatagram and SmartStream inputs
linux-syslog-rfc5424-1: # stream name
- ip: "192.168.0.1" # Single IPv4 address
port: 80 # Single port
protocol: TCP # TCP protocol
- ip: "2001:db8::1" # Single IPv6 address
port: "1000-2000" # Port range
protocol: UDP # UDP protocol
fortinet-fortigate-1:
- ip: "10.0.0.0/8" # IPv4 range
port: 14000
protocol: UDP
- ip: "fd00::/8" # IPv6 range
port: "*" # Any port
protocol: UDP
fortinet-fortigate-2:
- ip: "*" # Any IP address
port: "*" # Any port
protocol: UDP
linux-rsyslog-1:
- ip: "::1" # Local IP addresses
# Listen on the UDP 514
input:SmartDatagram:UDP514:
address: 514
smart: *smart514
output: smart
# Listen on the TCP 514
input:SmartStream:TCP514:
address: 514
smart: *smart514
output: smart
# The logs are forwarded to a LogMan.io using a CommLink
output:CommLink:smart: {}
Warning
Smart classification works only with a CommLink output.
SmartDatagram and SmartStream
SmartDatagram (for UDP) and SmartStream (for TCP) sources are similar to Datagram/TCP and Stream/UDP sources,
with additional option smart, which references the appropriate sub-section in classification.
# Listen on the UDP 514
input:SmartDatagram:UDP514:
address: 514
smart: *smart514
output: smart
# Listen on the TCP 514
input:SmartStream:TCP514:
address: 514
smart: *smart514
output: smart
Warning
Section classification must be specified BEFORE input:... sections, otherwise the reference *smart514 is not recognized.
Classification map
Section classification can contain one or more classifiers.
Each classifier specifies a combination of IP address ranges, port ranges and protocols;
and it resolves them into a stream.
Every log that arrives to the TeskaLabs LogMan.io Collector smart syslog is matched with these classifiers and a resulting stream is used as its destination in LogMan.io.
If no match is found, the log goes into generic stream (named generic).
Tip
Streams can be found in the Archive component of TeskaLabs LogMan.io.
linux-syslog-rfc5424-1:
- ip: "192.168.0.1"
port: 80
protocol: TCP
- ip: "2001:db8::1"
port: "1000-2000"
protocol: UDP
linux-syslog-rfc5424-1 is a stream name.
ip
- A single IPv4/IPv6 address:
92.168.0.1,2001:db8::1 - Range of IPv4/IPv6 addresses:
10.0.0.0/8,fd00::/8 - Wildcard
*for all IPv4/IPv6 addresses
port
- A single port:
5400 - Port range:
4000-8000 - When not specified or
*, range0-65535is used
protocol
TCP/UDP- When not specified, both TCP and UDP are used
* wildcard can go too wild
Be sure to wrap * wildcard into quotation marks in YAML "*". Aterisk without quotation marks would break YAML syntax.
Overlapping IP addresses and ports
IP addresses and ports can overlap.
In that case, the most specific match is selected.
In the example below, 25400 is matched with fortinet-fortigate-3, 25100 with fortinet-fortigate-2 and 24000 with fortinet-fortigate-1:
fortinet-fortigate-1:
- ip: "192.168.0.1"
port: 24000-30000
fortinet-fortigate-2:
- ip: "192.168.0.1"
port: 25000-26000
fortinet-fortigate-3:
- ip: "192.168.0.1"
port: 25400
The same holds for IP addresses.
Generic stream
If no target stream is identified during the classification, a log is forwarded to generic stream.
Example of stream classification
Suppose you connect new log sources from IP address range 192.168.0.0/24.
With no classifier, events are collected into generic stream and stored in Archive.
After looking into streams in Archive, you discovered there is a source of type logsox.
You classify the stream to separate it from other incoming data:
logsox-1:
- ip: "192.168.0.0/24"
When creating parsing rules for the stream, you discover that logsox incoming events from IP 192.168.0.68 have a different form than the others.
You can isolate that stream and apply different parsing rules for it:
logsox-1:
- ip: "192.168.0.0/24"
logsox-2:
- ip: "192.168.0.68"
Stream names
Selecting a proper stream name is important, as TeskaLabs LogMan.io determines a technology, selects proper parsing rules, dashboards and other content, based on the name of the stream.
To connect a log source which exists in Library and automatically assign the correct event lane, stream name must match one of event lane templates located in /Templates/EventLanes/ folder in Library.
Below is a table outlining the stream names used by various technologies when connecting to the LogMan.io Collector.
Replace the star "*" at the end of the stream name with arbitrary number.
For example, you can use a counter (fortinet-fortigate-1, fortinet-fortigate-2, linux-rsyslog-1, ...) or port number (fortinet-fortigate-10000, fortinet-fortigate-20000, linux-rsyslog-30000, ...).
| Technology name | Stream name |
|---|---|
| Bitdefender GravityZone | bitdefender-gravityzone-* |
| Broadcom Brocade Switch | broadcom-brocade-switch-* |
| Cisco ASA | cisco-asa-* |
| Cisco FTD | cisco-ftd-* |
| Cisco iOS | cisco-ios-* |
| Cisco ISE | cisco-ise-* |
| Cisco Switch Nexus | cisco-switch-nexus-* |
| Cisco WLC | cisco-wlc-* |
| Dell iDRAC | dell-idrac-* |
| Dell PowerVault | dell-powervault-* |
| Dell Switch | dell-switch-* |
| Devolutions Web Server | devolutions-web-server-* |
| EATON UPS | eaton-ups-* |
| ESET Protect | eset-protect-* |
| F5 | f5-* |
| FileZilla | filezilla-* |
| Fortinet FortiClient | fortinet-forticlient-* |
| Fortinet FortiGate | fortinet-fortigate-* |
| Fortinet FortiMail | fortinet-fortimail-* |
| Fortinet FortiSwitch | fortinet-fortiswitch-* |
| Gordic Ginis | gordic-ginis-* |
| Helios | helios-* |
| HPE Aruba ClearPass | hpe-aruba-clearpass-* |
| HPE Aruba IAP | hpe-aruba-iap-* |
| HPE Aruba IAP | hpe-aruba-switch-* |
| HPE iLO | hpe-ilo-* |
| HPE LaserJet Series | hpe-laserjet-* |
| HPE Primera | hpe-primera-* |
| HPE StoreOnce | hpe-storeonce-* |
| IBM QRADAR | ibm-qradar-* |
| IceWarp | icewarp-mailserver-* |
| Kubernetes | kubernetes-* |
| Linux Auditd | linux-auditd-* |
| Linux Rsyslog | linux-rsyslog-* |
| Linux Syslog RFC 3164 | linux-syslog-rfc3164-* |
| Linux Syslog RFC 5424 | linux-syslog-rfc5424-* |
| McAfee Webwasher | mcafee-webwasher-* |
| MikroTik | mikrotik-* |
| Minolta Bizhub | minolta-bizhub-* |
| Nginx | nginx-* |
| Ntopng | ntopng-* |
| OpenVPN | openvpn-* |
| Oracle Cloud | oracle-cloud-* |
| Oracle Listener | oracle-listener-* |
| Oracle Spark | oracle-spark-* |
| PfSense | pfsense-* |
| SentinelONE | sentinelone-* |
| Sophos Device Standard Format | sophos-device-standard-format-* |
| Sophos Standard Syslog Protocol | sophos-standard-syslog-protocol-* |
| Sophos Unstructured Format | sophos-unstructured-* |
| Squid Proxy | squid-proxy-* |
| Synology NAS | synology-nas-* |
| Ubiquiti UniFi | ubiquiti-unifi-* |
| Veeam Backup & Replication | veeam-backup-replication-* |
| VMware Cloud Director | vmware-cloud-director-* |
| VMware ESXi | vmware-esxi-* |
| VMware vCenter | vmware-vcenter-* |
| ySoft SafeQ | ysoft-safeq-* |
| ZyXEL Switch | zyxel-switch-* |
Example
Configuration example of three log sources connected over TCP/UDP:
- Two sources of Fortinet FortiGate on ports 10000 and 20000
- One source of Linux Rsyslog on port 30000
# Fortinet FortiGate on port 10000
input:TCP:fortinet-fortigate-1:
address: 10000
output: fortinet-fortigate-1
output:CommLink:fortinet-fortigate-1: {}
# Fortinet FortiGate on port 20000
input:TCP:fortinet-fortigate-2:
address: 20000
output: fortinet-fortigate-2
output:CommLink:fortinet-fortigate-2: {}
# Linux Rsyslog on port 30000
input:TCP:linux-rsyslog-1:
address: 30000
output: linux-rsyslog-1
output:CommLink:linux-rsyslog-1: {}
Microsoft Windows
Collecting logs from Microsoft Windows
There are multiple ways of collecting logs or Windows Events from Microsoft Windows.
Window Event Collector (WEC/WEF)
The agent-less Window Event Collector (WEC) sends logs from Windows computers via the Windows Event Forwarding (WEF) service to TeskaLabs LogMan.io Collector. The TeskaLabs LogMan.io Collector then acts as Window Event Collector (WEC). The WEF configuration can be deployed using Group Policy, either centrally managed by the Active Directory server or using Local Group Policy. With Active Directory in place, there are no additional configuration requirements on individual Windows machines.
Tip
We recommend this method for collecting Windows Events.
Windows Remote Management
Agent-less remote control connects to a desired Windows computer over Windows Remote Management (aka WinRM) and runs the collection command there as a separate process to collect its standard output.
Agent on the Windows computer
In this method, TeskaLabs LogMan.io Collector runs as an agent on the desired Windows computer(s) and collects Windows Events.
Collecting from Microsoft Windows using WEC/WEF
The agent-less Window Event Collector (WEC) sends logs from Windows computers via the Windows Event Forwarding (WEF) service to TeskaLabs LogMan.io Collector. The TeskaLabs LogMan.io Collector then acts as Window Event Collector (WEC). The WEF configuration can be deployed using Group Policy, either centrally managed by the Active Directory server or using Local Group Policy. With Active Directory in place, there are no additional configuration requirements on individual Windows machines.
Schema: Event flow of WEC/WEF collection in TeskaLabs LogMan.io.
Prerequisites
- Microsoft Active Directory Domain Controller, in this example providing domain name
domain.int/DOMAIN.int - TeskaLabs LogMan.io Collector, in this example with IP address
10.0.2.101and hostnamelmio-collector, running in the same network as Windows computes, including Active Directory - The IP address of the TeskaLabs LogMan.io Collector MUST be fixed (ie. reserved by a DHCP server)
- Date and time of the TeskaLabs LogMan.io Collector MUST be NTP synchronized
- TeskaLabs LogMan.io Collector SHOULD use the DNS server of the Active Directory
- TeskaLabs LogMan.io Collector MUST be able to resolve the hostnames of Domain Controller servers of the Active Directory
- TeskaLabs LogMan.io Collector MUST be able to reach
udp/88andtcp/88ports (Kerberos version 5 authentication) on Microsoft Active Directory Domain Controller, respective KDC - All Microsoft Windows stations and servers MUST be able to reach TeskaLabs LogMan.io Collector's
tcp/5985andtcp/5986for WEF andudp/88,tcp/88(Kerberos authentication) ports
Tip
This setup utilizes Kerberos authentication. Kerberos authentication uses Active Directory domain-specific Kerberos tickets issued by the domain controller for authentication and encryption of the log forwarding. It is the optimal choice for Windows computers that are managed through a domain.
Active Directory
1.1. Create a new user in Active Directory
Navigate to Windows Administrative Tools > Active Directory Users and Computers > DOMAIN.int > Users
Right-click and choose New > User
Enter following information:
- Full name:
TeskaLabs LogMan.io - User logon name:
lmio-collector
Warning
The user logon name must be the same as the computer name of the TeskaLabs LogMan.io Collector. You can find it in the TeskaLabs LogMan.io collector setup screen.
Select "Next".
Set a password for the user.
This example uses Password01!.
Warning
Use a strong password according your policy. This password will be used in later step of this procedure.
Uncheck "User must change password at next logon".
Check "Password never expires".
Hit Next and then Finish button to create the user.
Finally, right-click on the new user, click Properties, and open the Account tab.
- Check "This account supports Kerberos AES 128 bit encryption".
- Check "This account supports Kerberos AES 256 bit encryption".
The new user lmio-collector is now ready.
1.2. Create an A record in the DNS server for TeskaLabs LogMan.io Collector
Use DHCP to reserve an IP address of the collector
A fixed IP address MUST be assigned to TeskaLabs LogMan.io Collector. This can by done by "reserving" the IP address in the Active Directory DHCP server.
Navigate to Windows Administrative Tools > DNS > Forward Lookup Zones > DOMAIN.int
Right-click and choose "New Host (A or AAAA)…"
Add a record with name lmio-collector and IP address 10.0.2.101.
Adjust this according to the IP address of your TeskaLabs LogMan.io Collector.
Hit Add Host button to finish.
1.3. Create a host principal name
Create a host principal name and the associated keytab file for the host of the TeskaLabs LogMan.io Collector. Execute following command on the Active Directory Domain Controller Server's command prompt (cmd.exe):
ktpass /princ host/lmio-collector.domain.int@DOMAIN.INT /pass Password01! /mapuser DOMAIN\lmio-collector -pType KRB5_NT_PRINCIPAL /out host-lmio-collector.keytab /crypto AES256-SHA1
Process is case-sensitive
Make sure to CAPITALIZE anything you see capitalized in our examples (such as host/lmio-collector.domain.int@DOMAIN.INT).
It has to be CAPITALIZED even if your domain contains lowercase letters.
The keytab file host-lmio-collector.keytab is created.
1.4. Create a http principal name
Create a service principal name and the associated keytab file for a service:
ktpass /princ http/lmio-collector.domain.int@DOMAIN.INT /pass Password01! /mapuser DOMAIN\lmio-collector -pType KRB5_NT_PRINCIPAL /out http-lmio-collector.keytab /crypto AES256-SHA1
The keytab file http-lmio-collector.keytab is created.
1.5. Collect key tab files from the Windows Server
Collect two keytab files from above. You'll upload them into TeskaLabs LogMan.io in a later step.
Group Policy
2.1. Open the Group Policy Management Console
Navigate to Windows Administrative Tools > Group Policy Management, select your domain, DOMAIN.int in this example.
2.2. Create Group Policy Object
In the Group Policy Management console, select your domain, such as DOMAIN.int.
Right-click the domain and choose "Create a GPO in this domain, and Link it here....
Specify a name for the new GPO, "TeskaLabs LogMan.io Windows Event Forwarding", then select OK.
2.3. Configure Group Policy Object
The new GPO is created and linked to your domain. To configure the policy settings, right-select the created GPO and choose "Edit...".
The "Group Policy Management Editor" opens to let you customize the GPO.
2.4. Configure Event Forwarding Policy under Computer Configuration section
In the "Group Policy Management Editor", navigate to Computer Configuration > Policies > Administative Templates > Windows Compontents and select Event Forwarding.
Select "Configure target Subscription Manager".
Enable the setting and select Show.
Fill in the location of the TeskaLabs LogMan.io Collector:
Server=http://lmio-collector.domain.int:5985/wsman/SubscriptionManager/WEC,Refresh=60
Press OK to apply the settings.
2.5. Apply
Execute gpupdate /force in cmd.exe on the Windows Server.
Security log
WEF can't access Windows security log by default.
To enable forwarding of the Security log, add Network Service to WEF.
Tip
Windows Security log is the most important source of cyber security information and must be configured.
3.1. Open the Group Policy Management Console
Navigate to Windows Administrative Tools > Group Policy Management, select your domain; DOMAIN.int in this example.
Right-click and select "Edit...".
Navigate to Computer Configuration > Administrative Templates > Windows Components > and select Event Log Service.
Then select Security.
Select Configure log access.
3.2. Configure the log access
In "Log Access" field, enter:
O:BAG:SYD:(A;;0xf0005;;;SY)(A;;0x5;;;BA)(A;;0x1;;;S-1-5-32-573)(A;;0x1;;;S-1-5-20)
Explanation
- O:BA: Specifies that the owner of the object is the Built-in Administrators group.
- G:SY: Specifies that the primary group is SYSTEM.
-
D:: Indicates that the following part defines the Discretionary Access Control List (DACL).
-
Built-in Administrators (BA): Read and write permissions.
- SYSTEM (SY): Full control with read and write permissions and special permissions for managing the event logs.
- Builtin\Event Log Readers (S-1-5-32-573): Read-only permissions.
- Network Service (S-1-5-20): Read-only permissions.
Press OK.
3.3. Apply
Execute gpupdate /force in cmd.exe on the Windows Server.
Troubleshooting
Network Service user must be part of the Event Log Readers group to access security logs.
Follow these steps to configure access:
-
Open RUN command line via Windows Key + R
-
Enter to open Local User Manager: lusrmgr.msc (for Windows Home edition, use gpedit.msc)
-
Open: Groups
-
Select: Event Log Readers
-
Add NT AUTHORITY\NETWORK SERVICE user
- Click "Add"
- Enter the exact name: NT AUTHORITY\NETWORK SERVICE
- Click "Check Names" to verify
-
For Kerberos authentication:
- Add the domain service account (e.g.,
DOMAIN\lmio-collector) - Only required when using domain authentication
- Add the domain service account (e.g.,
-
Click OK to save changes
-
Open command line (
cmd.exe) as Administrator -
Restart WinRM service:
net stop winrm timeout /t 5 net start winrm
Note: This configuration must be applied on all computers sending Security Logs. For enterprise environments, use Group Policy deployment instead of manual configuration.
TeskaLabs LogMan.io
4.1. Configure Microsoft Events collection
In TeskaLabs Logman.io, navigate to Collectors > Your Collector > Microsoft Windows.
Fill the Realm and FQDN of the Domain Controller, add keytab files for host and http and press Apply.
4.2. The log collection is configured
Advanced topics
Alternatives
- Use of HTTPS / SSL certificates instead of Active Directory and Kerberos
- Use a local group policy instead of Active Directory Group Policy
Forwarding Event Log
The Eventlog-forwardingPlugin/Operational event channel logs relevant information of machines that are set up to forward logs into the collector.
It also contains the information about possible issues with WEF subscription.
Use Event Viewer application to investigate.
Manual configuration
Collecting from Microsoft Windows by Windows Remote Management
Agent-less remote control connects to a desired Windows computer over Windows Remote Management (aka WinRM) and runs the collection command there as a separate process to collect its standard output.
Input specification: input:WinRM:
WinRM input connects to a remote Windows Server machine, where is calls a specified command.
It then periodically checks for new output at stdout and stderr, so it behaves in a similar manner to input:SubProcess.
LogMan.io Collector WinRM configuration options
endpoint: # Endpoint URL of the Windows Management API of the remote Windows machine (f. e. http://MyMachine:5985/wsman)
transport: ntlm # Authentication type
server_cert_validation: # Specify the certificate validation (default: ignore)
cert_pem: # (optional) Specify path to the certificate (if using HTTPS)
cert_key_pem: # (optional) Specify path to the private key
username: # (optional) When using username authentication (like over ntlm), specify username in format <DOMAIN>\<USER>
password: # Password of the authenticated user above
output: # Which output to send the incoming events to
The following configuration clarifies the command that should be remotely called:
# Read 1000 system logs once per 2 seconds
command: # Specify the command, that should be remotely called (f. e. wevtutil qe system /c:1000 /rd:true)
chilldown_period: # How often in seconds should the remote command be called, if it is ended (default: 5)
duplicity_check: # Specify if to check for duplicities based on time (true/false)
duplicity_reverse_order: # Specify if to check for duplicities in reverse order (f. e. logs come in descending order)
last_value_storage: # Persistent storage for the current last value in duplicity check (default: ./var/last_value_storage)
Collecting by the agent on the Windows machine
TeskaLabs LogMan.io Collector runs as an agent on a desired Windows machine and collects Windows Events.
Input specification: input:WinEvent
Note: input:WinEvent only works at Windows-based machine.
This input periodically reads Windows Events from the specified event type.
LogMan.io Collector WinEvent configuration options
server: # (optional) Specify source of the events (default: localhost, i. e. the entire local machine)
event_type: # (optional) Specify the event type to be read (default: System)
buffer_size: # (optional) Specify how many events should be read in one query (default: 1024)
event_block_size: # (optional) Specify the amount of events after which an idle time will be executed for other operations to take place (default: 100)
event_idle_time: # (optional) Specify the idle time in seconds mentioned above (default: 0.01)
last_value_storage: # Persistent storage for the current last value (default: ./var/last_value_storage)
output: # Which output to send the incoming events to
The event type can be specified for every Window Event log type, including:
Applicationfor application logsSystemfor system logsSecurityfor security logs etc.
Collecting logs from Microsoft 365
TeskaLabs LogMan.io can collect logs from Microsoft 365, formerly Microsoft Office 365.
There are following classes of Microsoft 365 logs:
-
Audit logs: They contain information about various user, admin, system, and policy actions and events from Azure Active Directory, Exchange and SharePoint.
-
Message Trace: It provides an ability to gain an insight into the e-mail traffic passing thru Microsoft Office 365 Exchange mail server.
Enable auditing of Microsoft 365
By default, audit logging is enabled for Microsoft 365 and Office 365 enterprise organizations. However, when setting up logging of a Microsoft 365 or Office 365 organization, you should verify the auditing status of Microsoft Office 365.
1) Go to https://compliance.microsoft.com/ and sign in
2) In the left navigation pane of the Microsoft 365 compliance center, click Audit
3) Click the Start recording user and admin activity banner
It may take up to 60 minutes for the change to take effect.
For more details, see Turn auditing on or off.
Configuration of Microsoft 365
Before you can collect logs from Microsoft 365, you must configure Microsoft 365. Be aware that configuration takes a significant amount of time.
1) Setup a subscription to Microsoft 365 and a subscription to Azure
You need a subscription to Microsoft 365 and a subscription to Azure that has been associated with your Microsoft 365 subscription.
You can use trial subscriptions to both Microsoft 365 and Azure to get started.
For more details, see Welcome to the Office 365 Developer Program.
2) Register your TeskaLabs LogMan.io collector in Azure AD
It allows you to establish an identity for TeskaLabs LogMan.io and assign specific permissions it needs to collect logs from Microsoft 365 API.
Sign in to the Azure portal, using the credential from your subscription to Microsoft 365 you wish to use.
3) Navigate to Azure Active Directory
4) On the Azure Active Directory page, select "App registrations" (1), and then select "New registration" (2)
5) Fill the registration form for TeskaLabs LogMan.io application
- Name: "TeskaLabs LogMan.io"
- Supported account types: "Account in this organizational directory only"
- Redirect URL: None
Press "Register" to complete the process.
6) Collect essential informations
Store following informations from the registered application page at Azure Portal:
- Application (client) ID aka
client_id - Directory (tenant) ID aka
tenant_id
7) Create a client secret
The client secret is used for the safe authorization and access of TeskaLabs LogMan.io.
After the page for your app is displayed, select Certificates & secrets (1) in the left pane. Then select "Client secrets" tab (2). On this tab, create new client secrets (3).
8) Fill in the information about a new client secret
- Description: "TeskaLabs LogMan.io Client Secret"
- Expires: 24 months
Press "Add" to continue.
9) Click the clipboard icon to copy the client secret value to the clipboard
Store the Value (not the Secret ID) for a configuration of TeskaLabs LogMan.io, it will be used as client_secret.
10) Specify the permissions for TeskaLabs LogMan.io to access the Microsoft 365 Management APIs
Go to App registrations > All applications in the Azure Portal and select "TeskaLabs LogMan.io".
11) Select API Permissions (1) in the left pane and then click Add a permission (2)
12) On the Microsoft APIs tab, select Microsoft 365 Management APIs
13) On the flyout page, select the all types of permissions
- Delegated permissions
ActivityFeed.ReadActivityFeed.ReadDlpServiceHealth.Read
- Application permissions
ActivityFeed.ReadActivityFeed.ReadDlpServiceHealth.Read
Click "Add permissions" to finish.
14) Add "Microsoft Graph" permissions
- Delegated permissions
AuditLog.Read.All
- Application permissions
AuditLog.Read.All
Select "Microsoft Graph", "Delegated permissions", then seek and select "AuditLog.Read.All" in "Audit Log".
Then select again "Microsoft Graph", "Application permissions" then seek and select "AuditLog.Read.All" in "Audit Log".
15) Add "Office 365 Exchange online" permissions for collecting Message Trace reports
Click on "Add a permission" again.
Then go to "APIs my organization uses".
Type "Office 365 Exchange Online" to search bar.
Finally select "Office 365 Exchange Online" entry.
Select "Application permissions".
Type "ReportingWebService" into a search bar.
Check the "ReportingWebService.Read.All" select box.
Finally click on "Add permissions" button.
16) Grant admin consent
17) Navigate to Azure Active Directory
18) Navigate to Roles and administrators
19) Assign TeskaLabs LogMan.io to Global Reader role
Type "Global Reader" into a search bar.
Then click on "Global Reader" entry.
Select "Add assignments".
Type "TeskaLabs LogMan.io" into a search bar. Alternatively use "Application (client) ID" from previous steps.
Select "TeskaLabs LogMan.io" entry, the entry will appear in "Selected items".
Hit "Add" button.
Congratulations! Your Microsoft 365 is now ready for an log collection.
Configuration of TeskaLabs LogMan.io
Example
connection:MSOffice365:MSOffice365Connection:
client_id: xxxxxxxx-xxxx-xxxx-xxxx-xxxxxxxxxxxx
tenant_id: xxxxxxxx-xxxx-xxxx-xxxx-xxxxxxxxxxxx
client_secret: xxxxxxxxxxxxxxxxxxxxxxxxxxxxxxxxxxxxxxxx
# Collect Microsoft 365 Audit.General
input:MSOffice365:MSOffice365Source1:
connection: MSOffice365Connection
content_type: Audit.General
output: ms-office365-01
# Collect Microsoft 365 Audit.SharePoint
input:MSOffice365:MSOffice365Source2:
connection: MSOffice365Connection
content_type: Audit.SharePoint
output: ms-office365-01
# Collect Microsoft 365 Audit.Exchange
input:MSOffice365:MSOffice365Source3:
connection: MSOffice365Connection
content_type: Audit.Exchange
output: ms-office365-01
# Collect Microsoft 365 Audit.AzureActiveDirectory
input:MSOffice365:MSOffice365Source4:
connection: MSOffice365Connection
content_type: Audit.AzureActiveDirectory
output: ms-office365-01
# Collect Microsoft 365 DLP.All
input:MSOffice365:MSOffice365Source5:
connection: MSOffice365Connection
content_type: DLP.All
output: ms-office365-01
output:XXXXXX:ms-office365-01: {}
# Collect Microsoft 365 Message Trace logs
input:MSOffice365MessageTraceSource:MSOffice365MTSource1:
connection: MSOffice365Connection
output: ms-office365-message-trace-01
output:XXXXXX:ms-office365-message-trace-01: {}
Connection
The connection to Microsoft 365 must be configured first in the connection:MSOffice365:... section.
connection:MSOffice365:MSOffice365Connection:
client_id: # Application (client) ID from Azure Portal
tenant_id: # Directory (tenant) ID from Azure Portal
client_secret: # Client secret value from Azure Portal
resources: # (optional) resource to get data from separated by comma (,) (default: https://manage.office.com,https://outlook.office365.com)
Danger
Fields client id, tenant_id and client secret MUST be specified for a successful connection to Microsoft 365.
Collecting from Microsoft 365 activity logs
Configuration options to set up the collection fot the Auditing logs (Audit.AzureActiveDirectory, Audit.SharePoint, Audit.Exchange, Audit.General and DLP.All):
input:MSOffice365:MSOffice365Source1:
connection: # ID of the MSOffice365 connection
output: # Which output to send the incoming events to
content_type: # (optional but advised) Content type of obtained logs (default: Audit.AzureActiveDirectory Audit.SharePoint Audit.Exchange Audit.General DLP.All)
refresh: # (optional) The refresh interval in seconds to obtain messages from the API (default: 600)
last_value_storage: # (optional) Persistent storage for the current last value (default: ./var/last_value_storage)
Collecting from Microfost 365 Message Trace
Configuration options to set up the source of data of Microsoft 365 Message Trace:
input:MSOffice365MessageTraceSource:MSOffice365MessageTraceSource1:
connection: # ID of the MSOffice365 connection
output: # Which output to send the incoming events to
refresh: # (optional) The refresh interval in seconds to obtain messages from the API (default: 600)
last_value_storage: # (optional) Persistent storage for the current last value (default: ./var/last_value_storage)
Refresh of the client secret
The client secret will expire after 24 months and it has to be periodically recreated.
1) Navigate to Azure Active Directory.
2) Go to "App registrations" and select "TeskaLabs LogMan.io".
3) Create a new client secret.
Go to "Certificates & secrets".
Hit "New client secret" in "Client secrets" tab.
Fill "TeskaLabs LogMan.io Client Secret 2" in the Description. Use increasing numbers for new client secrets.
Select "730 days (24 mothns)" expiration.
Hit "Add" button.
4) Reconfigure TeskaLabs LogMan.io to use new client secrets.
5) Delete the old client secret.
Microsoft 365 Attributes explained
| Attribute | Description | Values as an example | Notes | Full list (ext) | |
|---|---|---|---|---|---|
| o365.audit.ActorContextId | ID of the user or service account that performed the action. | 571c8d2c-1ae2-486d-a17c-81bf54cbaa15 | |||
| o365.audit.ApplicationId | Application identifier (unique letter+number string) | 89bee1f7-5e6e-4d8a-9f3d-ecd601259da7 | |||
| o365.audit.AzureActiveDirectoryEventType | The type of Azure Active Directory event. The following values indicate the type of event. | 0 - Indicates an account login event. 1 - Indicates an Azure application security event. |
|||
| o365.audit.DeviceProperties | Source device properties such as OS, browser type etc. | Name:"OS" Value:"Linux" } {2 items Name:"BrowserType" Value:"Firefox" } {2 items Name:"IsCompliantAndManaged" Value:"False" } {2 items Name:"SessionId" Value:"e94ad17c-354f-4009-a9ee-34900770e997" |
Parcing of these properties is still in progress | ||
| o365.audit.ErrorNumber | An error code string that can be used to classify types of errors that occur, and should be used to react to errors. | 0, 50140, 501314 ... | https://learn.microsoft.com/en-us/azure/active-directory/develop/reference-aadsts-error-codes | ||
| o365.audit.ExtraProperties | Not defined yet | // | |||
| o365.audit.FileSizeBytes | FIle size in bytes | 23301 | |||
| o365.audit.InterSystemsId | Unique inter system ID string | acc33436-ee63-4d81-b6ee-544998a1c7d9 | |||
| o365.audit.IntraSystemId | Unique intra system ID string | 01dd20c0-edb9-4aaa-a51b-2bf38e1a8900 | |||
| o365.audit.ItemName | Unique item name | b1379a75-ce5e-4fa3-80c6-89bb39bf646c | |||
| o365.audit.LogonError | Error message displayed after failed login | InvalidUserNameOrPassword, TriggerBrowserCapabilitiesInterrupt, InvalidPasswordExpiredPassword | |||
| o365.audit.ObjectId | URL path to accesed file | https://telescopetest.sharepoint.com/sites/Shared Documents/Docs/o365 - logs.xlsx | |||
| o365.audit.RecordType | The type of operation indicated by the record. This property indicates the service or feature that the operation was triggered in. | 6 | https://learn.microsoft.com/en-us/office/office-365-management-api/office-365-management-activity-api-schema#auditlogrecordtype | ||
| o365.audit.ResultStatus | Triggered response | Success, Fail | |||
| o365.audit.SourceFileExtension | Accessed file extension (format type). | .xlsx, .pdf, .doc etc. | |||
| o365.audit.SourceFileName | Name of file user accessed | "o365.attributesexplained.xlsx" | |||
| o365.audit.SupportTicketId | ID of the potential Support ticket, after user opened a support request in Azure Active Directory. | // | The customer support ticket ID for the action in "act-on-behalf-of" situations. | ||
| o365.audit.TargetContextId | The GUID of the organization that the targeted user belongs to. | 571c8d2c-1ae2-486d-a17c-81bf54cbaa15 | |||
| o365.audit.UserKey | An alternative ID for the user identified in the UserID property. For example, this property is populated with the passport unique ID (PUID) for events performed by users in SharePoint. This property also might specify the same value as the UserID property for events occurring in other services and events performed by system accounts. | i:0h.f|membership|1003200224fe6604@live.com | |||
| o365.audit.UserType | The type of user that performed the operation. The following values indicate the user type. | 0 - A regular user. 2 - An administrator in your Microsoft 365 organization.1 3 - A Microsoft datacenter administrator or datacenter system account. 4 - A system account. 5 - An application. 6 - A service principal. 7 - A custom policy. 8 - A system policy. |
|||
| o365.audit.Version | Indicates the version number of the activity (identified by the Operation property) that's logged. | 1 | |||
| o365.audit.Workload | The Microsoft 365 service where the activity occurred. | AzureActiveDirectory | |||
| o365.message.id | This is the Internet message ID (also known as the Client ID) found in the message header in the Message-ID: header field. | 08f1e0f6806a47b4ac103961109ae6ef@server.domain | This ID should be unique; however, not all sending mail systems behave the same way. As a result, there's a possibility that you may get results for multiple messages when querying upon a single Message ID. | ||
| o365.message.index | Value of MessageTrace Index | 1, 2, 3 ... | |||
| o365.message.size | Size of the sent/received message in bytes. | 33489 | |||
| o365.message.status | Following action after sending the message. | Delivered, FilteredAsSpam, Expanded | https://learn.microsoft.com/en-us/exchange/monitoring/trace-an-email-message/run-a-message-trace-and-view-results | ||
| o365.message.subject | Message subject; can be written uniquely. | "Binding Offer Letter for Ms. Smith" | |||
Collecting events from Apache Kafka
TeskaLabs LogMan.io Collector is able to collect events from Apache Kafka, namely its topics. The events stored in Kafka may contain any data encoded in bytes, such as logs about various user, admin, system, device and policy actions.
Prerequisites
In order to create a Kafka consumer, the boostrap_servers, that is the location of the Kafka nodes, need to be known as well as the topic where to read the data from.
LogMan.io Collector Configuration
The LogMan.io Collector provides input:Kafka: input section, that needs to be specified in the YAML configuration. The configuration looks as follows:
input:Kafka:KafkaInput:
bootstrap_servers: <BOOTSTRAP_SERVERS>
topic: <TOPIC>
group_id: <GROUP_ID>
...
The input creates a Kafka consumer for the specific topic(s).
Configuration options related to the connection establishment:
bootstrap_servers: # Kafka nodes to read messages from (such as `kafka1:9092,kafka2:9092,kafka3:9092`)
Configuration options related to the Kafka Consumer setting:
topic: # Name of the topics to read messages from (such as `lmio-events` or `^lmio.*`)
group_id: # Name of the consumer group (such as: `collector_kafka_consumer`)
refresh_topics: # (optional) If more topics matching the topic name are expected to be created during consumption, this options specifies in seconds how often to refresh the topics' subscriptions (such as: `300`)
Options bootstrap_servers, topic and group_id are always required!
topic can be a name, a list of names separated by spaces or a simple regex (to match all available topics, use ^.*)
For more configuration options, please refer to librdkafka configuration guide.
Collecting from Beats or Logstash
Configuration of TeskaLabs LogMan.io
The basic configuration snipplet of the collector:
input:Lumberjack:logstash:
output: ...
logstash is an input identified and can be replaced by anything unique within the configuration file
address specifies an network interface and/or a port that will be used for listening.
The default value is '5044', to listen on tcp/5044.
Optional smart attribute can be used to specify a smart map, when connected to the output:CommLink.
Tip
The protocol used for this extraction is called Lumberjack and by default runs on tcp/5044 with optional SSL.
Log source classes input:Lumberjack:, input:Logstash: and input:Beats: are actually synonyms.
SSL configuration
The incoming SSL is detected automatically.
The following configuration options specify the SSL connection:
cert: Path to the client SSL certificatekey: Path to the private key of the client SSL certificatepassword: Private key file password (optional, default: none)cafile: Path to a PEM file with CA certificate(s) to verify the SSL server (optional, default: none)capath: Path to a directory with CA certificate(s) to verify the SSL server (optional, default: none)cadata: one or more PEM-encoded CA certificates to verify the SSL server (optional, default: none)ciphers: SSL ciphers (optional, default: none)dh_params: Diffie–Hellman (D-H) key exchange (TLS) parameters (optional, default: none)verify_mode: One of CERT_NONE, CERT_OPTIONAL or CERT_REQUIRED (optional); for more information, see: github.com/TeskaLabs/asab
Configuration of Beats
This log source can be used to collect logs using Beats family of tools. Beats are lightweight data shippers from Elastic.
Supported Beats:
- winlogbeat
- filebeat
- auditbeat
- and many other beats ...
Configuration snipplet:
output.logstash:
hosts: ["<collector>:5044"]
Example of winlogbeat configuration
winlogbeat.yaml:
output.logstash:
hosts: ["<collector>:5044"]
winlogbeat.event_logs:
- name: Application
ignore_older: 72h
- name: System
ignore_older: 72h
- name: Security
ignore_older: 72h
- name: Setup
ignore_older: 72h
- name: Microsoft-Windows-Sysmon/Operational
ignore_older: 72h
- name: Microsoft-Windows-Windows Defender/Operational
ignore_older: 72h
- name: Microsoft-Windows-GroupPolicy/Operational
ignore_older: 72h
- name: Microsoft-Windows-TaskScheduler/Operational
ignore_older: 72h
- name: Microsoft-Windows-Windows Firewall With Advanced Security/Firewall
ignore_older: 72h
- name: Windows PowerShell
event_id: 400, 403, 600, 800
ignore_older: 72h
- name: Microsoft-Windows-PowerShell/Operational
event_id: 4103, 4104, 4105, 4106
ignore_older: 72h
- name: ForwardedEvents
tags: [forwarded]
logging.to_files: true
logging.files:
rotateeverybytes: 10485760 # = 10MB
keepfiles: 7
Example of filebeat configuration
filebeat.yaml:
output.logstash:
hosts: ["<collector>:5044"]
filebeat.inputs:
- type: filestream
fields:
stream: <stream name>
paths:
- /path/to/the/file.log
Collecting events from Google Cloud PubSub
Info
This option is available from version v23.27 onwards.
TeskaLabs LogMan.io Collector can collect events from Google Cloud PubSub using a native asynchronous consumer.
Google Cloud PubSub Documentation
Google Cloud Pull Subscription Explanation
Prerequisites
In Pub Sub, the following information need to be gathered:
1.) The name of the project the messages are to be consumed from
How to create a topic in a project
2.) the subscription name created in the topic the messages are to be consumed from
How to create a PubSub subscription
3.) Service account file with a private key to authorize to the given topic and subscription
How to create a service account
LogMan.io Collector Input setup
Google Cloud PubSub Input
The input named input:GoogleCloudPubSub: needs to be provided in the LogMan.io Collector YAML configuration:
input:GoogleCloudPubSub:GoogleCloudPubSub:
subscription_name: <NAME_OF_THE_SUBSCRIPTION_IN_THE_GIVEN_TOPIC>
project_name: <NAME_OF_THE_PROJECT_TO_CONSUME_FROM>
service_account_file: <PATH_TO_THE_SERVICE_ACCOUNT_FILE>
output: <OUTPUT>
<NAME_OF_THE_SUBSCRIPTION_IN_THE_GIVEN_TOPIC>, <NAME_OF_THE_PROJECT_TO_CONSUME_FROM> and <PATH_TO_THE_SERVICE_ACCOUNT_FILE> must be provided from the Google Clould Pub Sub
The output is events as a byte stream with the following meta information: publish_time, message_id, project_name and subscription_name.
Commit
The commit/acknowledgement is done automatically after each individual bulk of messages is processed,
so the same messages are not set by PubSub repeatedly.
The default bulk is 5,000 messages and can be changed in the input configuration via max_messages option:
max_messages: 10000
Collecting from Bitdefender
TeskaLabs LogMan.io can collect Bitdefender logs from requests made by Bitdefender as specified by the server API documentation.
LogMan.io Collector Configuration
On the LogMan.io server, where the logs are being forwarded to, run a LogMan.io Collector instance with the following configuration.
In the listen section, set the appropriate port configured in the Log Forwarding in Bitdefender.
Bitdefender Server Configuration
input:Bitdefender:BitdefenderAPI:
listen: 0.0.0.0 <PORT_SET_IN_FORWARDING> ssl
cert: <PATH_TO_PEM_CERT>
key: <PATH_TO_PEM_KEY_CERT>
cafile: <PATH_TO_PEM_CA_CERT>
encoding: utf-8
output: <OUTPUT_ID>
output:xxxxxx:<OUTPUT_ID>:
...
Collecting from Cisco IOS based devices
This collecting method is designed to collect logs from Cisco products that operates IOS, such as Cisco Catalyst 2960 switch or Cisco ASR 9200 router.
Log configuration
Configure the remote address of a collector and the logging level:
CATALYST(config)# logging host <hostname or IP of the LogMan.io collector> transport tcp port <port-number>
CATALYST(config)# logging trap informational
CATALYST(config)# service timestamps log datetime year msec show-timezone
CATALYST(config)# logging origin-id <hostname>
Log format contains the following fields:
-
timestamp in the UTC format with:
- year month, day
- hour, minute, and second
- millisecond
-
hostname of the device
-
log level is set to informational
Example of the output
<189>36: CATALYST: Aug 22 2022 10:11:25.873 UTC: %SYS-5-CONFIG_I: Configured from console by admin on vty0 (10.0.0.44)
Time synchronization
It is important that Cisco device time is synchronized using NTP.
Prerequisites are: * Internet connection (if you are using a public NTP server) * Configured name-server option (for a DNS query resolution)
LAB-CATALYST(config)# no clock timezone
LAB-CATALYST(config)# no ntp
LAB-CATALYST(config)# ntp server <hostname or IP of NTP server>
Example of the configuration with Google NTP server:
CATALYST(config)# no clock timezone
CATALYST(config)# no ntp
CATALYST(config)# do show ntp associations
%NTP is not enabled.
CATALYST(config)# ntp server time.google.com
CATALYST(config)# do show ntp associations
address ref clock st when poll reach delay offset disp
*~216.239.35.4 .GOOG. 1 58 64 377 15.2 0.58 0.4
* master (synced), # master (unsynced), + selected, - candidate, ~ configured
CATALYST(config)# do show clock
10:57:39.110 UTC Mon Aug 22 2022
Collecting from Citrix
TeskaLabs LogMan.io can collect Citrix logs using Syslog via log forwarding over TCP (recommended) or UDP communication.
Citrix ADC
If Citrix devices are being connected through ADC, there is the following guide on how to enable Syslog over TCP. Make sure you select the proper LogMan.io server and port to forward logs to.
F5 BIG-IP
If Citrix devices are connected to F5 BIG-IP, use the following guide. Make sure you select the proper LogMan.io server and port to forward logs to.
Configuring LogMan.io Collector
On the LogMan.io server, where the logs are being forwarded to, run a LogMan.io Collector instance with the following configuration.
Log Forwarding Via TCP
input:TCPBSDSyslogRFC6587:Citrix:
address: 0.0.0.0:<PORT_SET_IN_FORWARDING>
output: WebSocketOutput
output:WebSocket:WebSocketOutput:
url: http://<LMIO_SERVER>:<YOUR_PORT>/ws
tenant: <YOUR_TENANT>
debug: false
prepend_meta: false
Log Forwarding Via UDP
input:Datagram:Citrix:
address: 0.0.0.0:<PORT_SET_IN_FORWARDING>
output: WebSocketOutput
output:WebSocket:WebSocketOutput:
url: http://<LMIO_SERVER>:<YOUR_PORT>/ws
tenant: <YOUR_TENANT>
debug: false
prepend_meta: false
Collecting from Fortinet FortiGate
TeskaLabs LogMan.io can collect Fortinet FortiGate logs directly or through FortiAnalyzer via log forwarding over TCP (recommended) or UDP communication.
Forwards logs to LogMan.io
Both in FortiGate and FortiAnalyzer, the Syslog type must be selected along with the appropriate port.
For precise guides, see the following link:
LogMan.io Collector Configuration
On the LogMan.io server, where the logs are being forwarded to, run a LogMan.io Collector instance with the following configuration.
In the address section, set the appropriate port configured in the Log Forwarding in FortiAnalyzer.
Log Forwarding Via TCP
input:TCPBSDSyslogRFC6587:Fortigate:
address: 0.0.0.0:<PORT_SET_IN_FORWARDING>
output: <OUTPUT_ID>
output:xxxxxxx:<OUTPUT_ID>:
...
Log Forwarding Via UDP
input:Datagram:Fortigate:
address: 0.0.0.0:<PORT_SET_IN_FORWARDING>
output: <OUTPUT_ID>
output:xxxxxxx:<OUTPUT_ID>:
...
Collecting events from Microsoft Azure Event Hub
This option is available from version v22.45 onwards
TeskaLabs LogMan.io Collector can collect events from Microsoft Azure Event Hub through a native client or Kafka. The events stored in Azure Event Hub may contain any data encoded in bytes, such as logs about various user, admin, system, device, and policy actions.
Microsoft Azure Event Hub Setting
The following credentials need to be obtained for LogMan.io Collector to read the events: connection string, event hub name and consumer group.
Obtain connection string from Microsoft Azure Event Hub
1) Sign in to the Azure portal with admin privileges to the respective Azure Event Hubs Namespace.
The Azure Event Hubs Namespace is available in the Resources section.
2) In the selected Azure Event Hubs Namespace, click on Shared access policies in the Settings section in the left menu.
Click on Add button, enter the name of the policy (the recommended name is: LogMan.io Collector), and a right popup window about the policy details should appear.
3) In the popup window, select the Listen option to allow the policy to read from event hubs associated with the given namespace.
See the following picture.
4) Copy the Connection string-primary key and click on Save.
The policy should be visible in the table in the middle of the screen.
The connection string starts with Endpoint=sb:// prefix.
Obtain consumer group
5) In the Azure Event Hubs Namespace, select Event Hubs option from the left menu.
6) Click on the event hub that contains events to be collected.
7) When in the event hub, click on the + Consumer group button in the middle of the screen.
8) In the right popup window, enter the name of the consumer group (the recommended value is lmio_collector) and click on Create button.
9) Repeat this procedure for all event hubs meant to be consumed.
10) Write down the consumer group's name and all event hubs for the eventual LogMan.io Collector configuration.
LogMan.io Collector Input setup
Azure Event Hub Input
The input named input:AzureEventHub: needs to be provided in the LogMan.io Collector YAML configuration:
input:AzureEventHub:AzureEventHub:
connection_string: <CONNECTION_STRING>
eventhub_name: <EVENT_HUB_NAME>
consumer_group: <CONSUMER_GROUP>
output: <OUTPUT>
<CONNECTION_STRING>, <EVENT_HUB_NAME> and <CONSUMER_GROUP> are provided through the guide above
The following meta options are available for the parser: azure_event_hub_offset, azure_event_hub_sequence_number, azure_event_hub_enqueued_time, azure_event_hub_partition_id, azure_event_hub_consumer_group and azure_event_hub_eventhub_name.
The output is events as a byte stream, similar to Kafka input.
Azure Monitor Through Event Hub Input
The Azure Monitor Through Event Hub Input loads events from Azure Event Hub, loads the Azure Monitor JSON Log and breaks individual records to log lines, that are then sent to the defined output.
The input named input:AzureMonitorEventHub: needs to be provided in the LogMan.io Collector YAML configuration:
input:AzureMonitorEventHub:AzureMonitorEventHub:
connection_string: <CONNECTION_STRING>
eventhub_name: <EVENT_HUB_NAME>
consumer_group: <CONSUMER_GROUP>
encoding: # default: utf-8
output: <OUTPUT>
<CONNECTION_STRING>, <EVENT_HUB_NAME> and <CONSUMER_GROUP> are provided through the guide above
The following meta options are available for the parser: azure_event_hub_offset, azure_event_hub_sequence_number, azure_event_hub_enqueued_time, azure_event_hub_partition_id, azure_event_hub_consumer_group and azure_event_hub_eventhub_name.
The output is events as a byte stream, similar to Kafka input.
Alternative: Kafka Input
Azure Event Hub also provides (excluding basic tier users) a Kafka interface, so standard LogMan.io Collector Kafka input can be used.
There are multiple authentication options in Kafka, including oauth etc.
However, for the purposes of the documentation and reuse of the connection string, the plain SASL authentication using the connection string from the guide above is preferred.
input:Kafka:KafkaInput:
bootstrap_servers: <NAMESPACE>.servicebus.windows.net:9093
topic: <EVENT_HUB_NAME>
group_id: <CONSUMER_GROUP>
security.protocol: SASL_SSL
sasl.mechanisms: PLAIN
sasl.username: "$ConnectionString"
sasl.password: <CONNECTION_STRING>
output: <OUTPUT>
<CONNECTION_STRING>, <EVENT_HUB_NAME> and <CONSUMER_GROUP> are provided through the guide above, <NAMESPACE> in the name of the Azure Event Hub resource (also mentioned in the guide above).
The following meta options are available for the parser: kafka_key, kafka_headers, _kafka_topic, _kafka_partition and _kafka_offset.
The output is events as a byte stream.
Collect logs from database using ODBC
Introduction
The recommended way of extracting logs and other events from databases is to use ODBC. ODBC provides a unified way how to connect LogMan.io to various database systems.
Tip
Examples of ODBC connection strings can be found here.
ODBC driver and configuration
You need to provide the ODBC driver for a database system you want to integrate with LogMan.io. The relevant ODBC driver must be compatible with Ubuntu 20.04 LTS, 64bit.
ODBC drivers needs to be deployed into the LogMan.io Collector, specifically into /odbc directory.
Alternatively, our support will help you to deploy a correct ODBC driver for your database system or provide LogMan.io Collector with bundled ODBC driver.
Note
ODBC drivers are exposed to LogMan.io collector software via Docker volumes.
The ODBC configuration is done in /odbc/odbcinst.ini and odbc.ini files.
Collector input configuration
The input source specification is input:ODBC:.
Example of the ODBC collector configuration:
input:ODBC:ODBCInput:
dsn: Driver={FreeTDS};Server=MyServer;Port=1433;Database=MyDatabase;TDS_Version=7.3;UID=MyUser;PWD=MyPassword
query: SELECT * FROM viewAlerts WHERE {increment_where_clause} ORDER BY Cas Time;
increment_strategy: date
increment_first_value: "2020-10-01 00:00:00.000"
increment_column_name: "Time"
chilldown_period: 30
output: WebSocket
last_value_storage: /data/var/last_value_storage
MySQL ODBC configuration
MySQL ODBC drivers can be obtained on the following link.
The driver package needs to be extracted into /odbc/mysql directory.
Entries in the /odbc/odbcinst.ini:
[MySQL ODBC 8.0 Unicode Driver]
Driver=/odbc/mysql/libmyodbc8w.so
UsageCount=1
[MySQL ODBC 8.0 ANSI Driver]
Driver=/odbc/mysql/libmyodbc8a.so
UsageCount=1
Microsoft SQL Server ODBC configuration
Microsoft SQL Server ODBC drivers can be obtained on the following link.
Entries in the /odbc/odbcinst.ini:
[ODBC Driver 17 for SQL Server]
Description=Microsoft ODBC Driver 17 for SQL Server
Driver=/odbc/microsoft/msodbcsql17/lib64/libmsodbcsql-17.6.so.1.1
UsageCount=1
Example of the connection string:
Driver={ODBC Driver 17 for SQL Server};Server=<server_name>;Authentication=ActiveDirectoryPassword;UID=<username>;PWD=<password>;Database=<database>;TrustServerCertificate=Yes
Microsoft SQL Server ODBC alternative configuration
Alternative connectivity to Microsoft SQL Server is provided by FreeTDS project, respective its ODBC driver.
Entries in the /odbc/odbcinst.ini:
[FreeTDS]
Description=FreeTDS Driver for Linux & MSSQL
Driver=/odbc/freetds/libtdsodbc.so
Setup=/odbc/freetds/libtdsodbc.so
UsageCount=1
Example of the connection string:
Driver={FreeTDS};Server=<server_name>;Port=<server_port>;Database=<database>;UID=<username>;PWD=<password>;TDS_Version=7.3
MariaDB ODBC configuration
MariaDB ODBC drivers can be obtained on the following link.
SAP IQ, Sybase IQ, Sybase ASE ODBC configuration
SAP IQ / Sybase IQ / Sybase ASE / SQL Anywhere ODBC drivers needs to be downloaded from SAP support page.
The driver package needs to be extracted into /odbc/sybase directory.
Entry in the /odbc/odbcinst.ini:
[ODBC Driver for Sybase IQ]
Description=Sybase IQ
Driver=/odbc/sybase/IQ-16_1/lib64/libdbodbc17.so
UsageCount=1
Example of the connection string:
Driver={ODBC Driver for Sybase IQ};UID=<username>;PWD=<password>;Server=<server_name>;DBN=<database_name>;CommLinks=TCPIP{host=<host>;port=<port>};DriverUnicodeType=1
Troubleshooting
Add a ODBC Trace
If you need greater insight into the ODBC connectivity, you can enable ODBC tracing.
Add this section to the /odbc/odbcinst.ini :
[ODBC]
Trace = yes
TraceFile = /odbc/trace.log
Then the collector is started, the trace output of the ODBC system is stored in the file /odbc/trace.log.
This file is available also outside of the container.
Verify the ODBC configuration
The command odbcinst -j (launched within the container) can be used to verify ODBC readiness:
# odbcinst -j
unixODBC 2.3.6
DRIVERS............: /etc/odbcinst.ini
SYSTEM DATA SOURCES: /etc/odbc.ini
FILE DATA SOURCES..: /etc/ODBCDataSources
USER DATA SOURCES..: /root/.odbc.ini
SQLULEN Size.......: 8
SQLLEN Size........: 8
SQLSETPOSIROW Size.: 8
Docker-compose
The LogMan.io collector can be started using docker-compose.
This is an extract of relevant entries from docker-compose.yaml:
lmio-collector:
image: docker.teskalabs.com/lmio/lmio-collector
...
volumes:
- /odbc/odbcinst.ini:/etc/odbcinst.ini
- /odbc/odbc.ini:/etc/odbc.ini
- /odbc:/odbc
...
network_mode: host
Afterwards, the LogMan.io Collector needs to be recreated with:
docker-compose up -d
Collecting logs from Oracle Cloud
You can collect logs from Oracle Cloud Infrastructure (OCI).
More about OCI Logging can be found here.
For LogMan.io Collector configuration, you will need to:
- Generate a new API key together with new public and private keys in the OCI console
- Create a new search query for the API requests
Generating API key in OCI Console
-
Log in to your OCI Console.
-
Make sure Generate API Key Pair is selected. Click Download Private Key and then Download Public Key. Then, click Add.
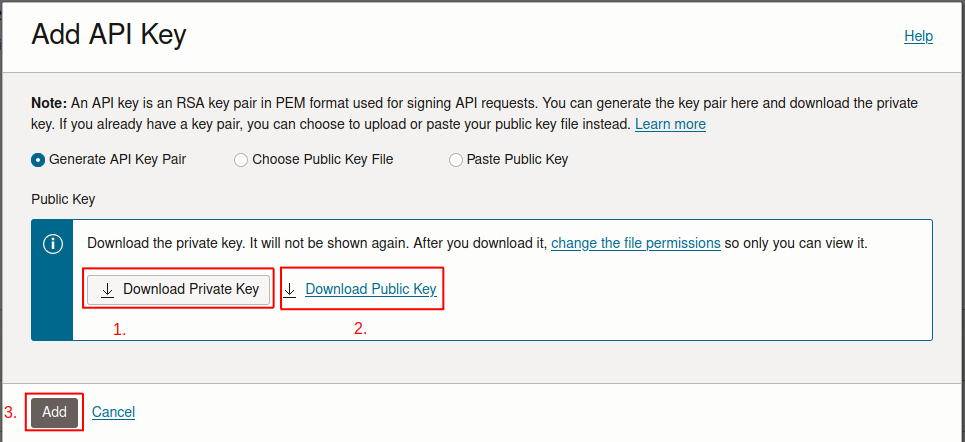
-
A configuration file with all the credentials you need will be created. Paste the contents of the text box into the
data/oci/configfile.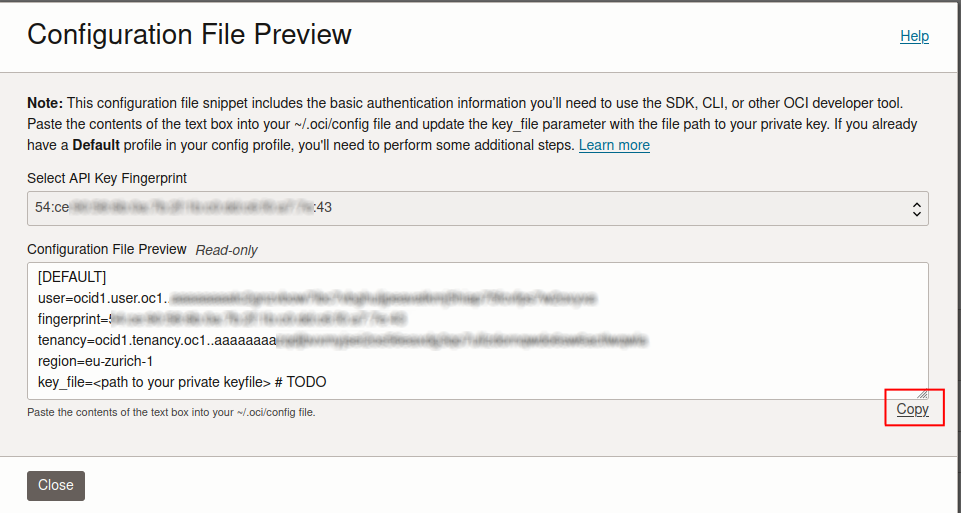
-
Fill out
key_filewith the path to your private key file.
Important
Never share your private key with anyone else. Keep it secret in its own file. You might need to change the permissions of the public and private keys after downloading them.
How does the requesting process work?
The private and public keys are part of an asymmetric encryption system. The public key is stored with Oracle Cloud Infrastructure and is used to verify the identity of the client. The private key, which you keep secure and never share, is used to sign your API requests.
When you make a request to the OCI API, the client software uses the private key to create a digital signature for the request. This signature is unique for each request and is generated based on the request data. The client then sends the API request along with this digital signature to Oracle Cloud Infrastructure.
Upon receiving the request, Oracle uses the public key (which it already has) to verify the digital signature. If the signature is valid, it confirms that the request was indeed sent by the holder of the corresponding private key (you) and has not been tampered with during transmission. This process is crucial for maintaining the integrity and authenticity of the communication.
The private key itself is never sent over the network. It stays on your client-side. The security of the entire process depends on the private key remaining confidential. If it were compromised, others could impersonate your service and send requests to OCI on your behalf.
Logging Query Language Specification
Please refer to the official documentation for creating new queries.
You will need the following information:
- Compartment OCID
- Log group OCID
- Log OCID
Logging Query Example
search "<compartment_OCID>/<log_group_OCID>/<log_OCID>" | where level = 'ERROR' | sort by datetime desc
Configuration
Below is the required configuration for LogMan.io Collector:
input:Oracle:OCIInput:
oci_config_path: ./data/oci/config # Path to your OCI configuration file (required)
search_query: search '<compartment_OCID>/<log_group_OCID>/<log_OCID>' | where level = 'ERROR' # (required)
encoding: utf-8 # Encoding of the events (optional)
interval: 10 # Number of seconds between requests to OCI (optional)
output: <output_id> # (required)
Development
Warning
LogMan.io Collector Oracle Source is built on OCI integration for API which uses synchronous requests. There might be some problems when there is heavy TCP input.
Collecting events from Zabbix
TeskaLabs LogMan.io Collector can collect events from Zabbix through Zabbix API.
- Zabbix Metrics Source collects history and events.
- Zabbix Security Source collects alerts and events.
Zabbix Metrics Source
Zabbix Metrics Source periodically sends event.get and history.get requests.
The event.get request is used to retrieve event data from the Zabbix server. Events in Zabbix represent significant occurrences within the monitored environment, such as triggers firing, discovery actions, or internal Zabbix events.
The history.get request is used to retrieve historical data from Zabbix, which includes various types of monitoring data, such as numeric values, text logs, and more.
Configuration
Example of minimal required configuration:
input:ZabbixMetrics:<SOURCE_ID>:
url: https://192.0.0.5/api_jsonrpc.php # URL for Zabbix API
auth: b03.......6f # Authorization token for Zabbix API
output: <output_id>
output:<type>:<output_id>:
...
Optionally, you can configure properties of requests:
interval: 60 # (optional, default: 60) Time interval between requests in seconds
max_requests: 100 # (optional, default: 50) Number of concurrent requests
request timeout: 10 # (optional, default: 10) Timeout for requests in seconds
sleep_on_error: 10 # (optional, default: 10) When error occurs, LMIO Collector waits for some time and then sends the requests again
You can also change the encoding of incoming events:
encoding: utf-8 # (optional) Encoding of incoming events
History types
In Zabbix, a history object represents a recorded piece of data associated with a metric item over time. These history objects are fundamental for analyzing the performance and status of monitored entities, as they store the actual collected data points. Each history object is associated with a specific item and includes a timestamp indicating when the data was collected. The history objects are used to track and analyze trends, generate graphs, and trigger alerts based on historical data.
Multiple different history object types can be returned in events. See the official documentation for more info.
| History object type | Name | Usage |
|---|---|---|
| 0 | numeric float | metrics like CPU load, temperature, etc. |
| 1 | character | log entries, service statuses, etc. |
| 2 | log | system and application logs |
| 3 | (default) numeric unsigned | free disk space, network traffic, etc. |
| 4 | text | descriptions, messages, etc. |
| 5 | binary | binary messages |
History types are configured in the following way:
histories_to_return: "0,1,3" # (optional, default: '0,3') List of history types
Metric items
A metric item in Zabbix specifies the type of data to be gathered from a monitored host. Each item is associated with a key that uniquely identifies the data to be collected, as well as other attributes such as the data type, collection frequency, and units of measurement. Items can represent various types of data, including numerical values, text, log entries, and more.
The Zabbix server typically contains a large amount of hosts from which histories will be collected. To filter for specific metric items, do the following steps:
- Create a CSV file with the list of metric types, each on separate line:
Uptime
Number of processes
Number of threads
FortiGate: System uptime
VMware: Uptime
CPU utilization
CPU user time
...
- Configure the path in LogMan.io Collector Zabbix Metrics Source configuration:
items_list_filename: conf/items.csv
Tip
We recommend to filter for a small subset of metric types to prevent Zabbix server overloading.
Zabbix Security Source
Zabbix Security Source periodically sends event.get and alert.get requests.
The event.get request is used to retrieve event data from the Zabbix server. Events in Zabbix represent significant occurrences within the monitored environment, such as triggers firing, discovery actions, or internal Zabbix events.
The alert.get request is used to retrieve alert data from the Zabbix server. Alerts in Zabbix are notifications generated in response to certain conditions or events, such as trigger status changes, discovery actions, or internal system events. These alerts can be configured to notify administrators or take automated actions to address issues.
Required configuration
Example of minimal required configuration:
input:ZabbixSecurity:<SOURCE_ID>:
url: https://192.0.0.5/api_jsonrpc.php # URL for Zabbix API
auth: b03.......6f # Authorization token for Zabbix API
output: <output_id>
output:<type>:<output_id>:
...
Optionally, you can configure properties of requests:
interval: 60 # (optional, default: 60) Time interval between requests in seconds
request timeout: 10 # (optional, default: 10) Timeout for requests in seconds
sleep_on_error: 10 # (optional, default: 10) When error occurs, LMIO Collector waits for some time and then sends the requests again
You can also change the encoding of incoming events:
encoding: utf-8 # (optional) Encoding of incoming events
ESET Connect API Source
ESET Connect is an API gateway between a client and a collection of ESET backend services. It acts as a reverse proxy to accept all application programming interface (API) calls, aggregate the various services required to fulfill them and return the appropriate result.
Creating new API Client
Warning
In order to create new user, you need to have superuser permission in ESET Business Account.
- Log as superuser (Administrator) into ESET Business Account.
-
Open User Management and click on New user button at the bottom.
-
Create the account with read-only permission and enable Integrations slider bar.
-
New user account should be successfully created with permission to read from ESET Connect API.
Collecting detections from connected devices
Connected devices are organized in device groups. Each group can have its subgroups. One device can be a member of different subgroups. It is possible to monitor detections from from selected devices or selected device groups. If these are not specified, all devices are monitored.
Configuration of LogMan.io Collector
'input:ESET:EsetSource':
client_id: john.doe@domain.com # (required) E-mail of the API Client
client_secret: client_secret # (required) Password for the API Client
interval: 10 # (optional, default: 10) Interval between requests in seconds.
LogMan.io Collector configuration
LogMan.io Collector configuration typically consists of two files.
- Collector configuration (
/conf/lmio-collector.conf, INI format) specifies the path for pipeline configuration(s) and possibly other application-level configuration options. - Pipeline configuration (
/conf/lmio-collector.yaml, YAML format) specifies from which inputs the data is collected (inputs), how the data is transformed (transforms) and how the data is sent further (outputs).
Collector configuration
[config]
path=/conf/lmio-collector.yaml
Pipeline configuration
Pipeline configuration is in a YAML format. Multiple pipelines can be configured in the same pipeline configuration file.
Every section represents one component of the pipeline. It always starts with either input:, transform:, output: or connection: and has the form:
input|transform|output:<TYPE>:<ID>
where <TYPE> determines the component type. <ID> is used for reference and can be chosen in any way.
- Input specifies a source/input of logs.
- Output specifies output where to ship logs.
- Connection specifies the connection that can be used by
output. - Transform specifies a transformation action to be applied on logs (optional).
Typical pipeline configuration for LogMan.io Receiver:
# Connection to LogMan.io (central part)
connection:CommLink:commlink:
url: https://recv.logman.example.com/
# Input
input:Datagram:udp-10002-src:
address: 0.0.0.0 10002
output: udp-10002
# Output
output:CommLink:udp-10002: {}
For the detailed configuration options of each component, see Inputs, Transformations and Outputs chapters. See LogMan.io Receiver documentation for the CommLink connection details.
Docker Compose
version: '3'
services:
lmio-collector:
image: docker.teskalabs.com/lmio/lmio-collector
container_name: lmio-collector
volumes:
- ./lmio-collector/conf:/conf
- ./lmio-collector/var:/app/lmio-collector/var
network_mode: host
restart: always
LogMan.io Collector Inputs
Note
This chapter concerns setup for log sources collected over network, syslog, files, databases, etc. For the setup of event collection from various log sources, see the Log sources subtopic.
Network
Sections: input:TCP, input:Stream, input:UDP, input:Datagram
These inputs listen on a given address using TCP, UDP or Unix Socket.
Tip
Logs should be collected through TCP protocol. Only if it is not possible, use UDP protocol.
The configuration options for listening:
address: # Specify IPv4, IPv6 or UNIX file path to listen from
output: # Which output to send the incoming events to
Here are possible form of address:
8080or*:8080: Listen on a port 8080 all available network interfaces on IPv4 and IPv60.0.0.0:8080: Listen on a port 8080 all available network interfaces on IPv4:::8080: Listen on a port 8080 all available network interfaces on IPv61.2.3.4:8080: Listen on a port 8080 and specific network interface (1.2.3.4) on IPv4::1:8080: Listen on a port 8080 and specific network interface (::1) on IPv6/tmp/unix.sock: Listen on a UNIX socket/tmp/unix.sock
The following configuration options are available only for input:Datagram:
max_packet_size: # (optional) Specify the maximum size of packets in bytes (default: 65536)
receiver_buffer_size: # (optional) Limit the receiver size of the buffer in bytes (default: 0)
Warning
LogMan.io Collector runs inside Docker container. Propagation of network ports must be enabled like this:
services:
lmio-collector-tenant:
network_mode: host
Note
TCP (Transmission Control Protocol) and UDP (User Datagram Protocol) are both protocols used for sending data over the network.
TCP is a Stream, as it provides a reliable, ordered, and error-checked delivery of a stream of data.
In contrast, UDP is a datagram that sends packets independently, allowing faster transmission but with less reliability and no guarantee of order, much like individual, unrelated messages.
Tip
For troubleshooting, use tcpdump to capture raw network traffic and then use Wireshark for deeper analysis.
The example of capturing the traffic at TCP/10008 port:
$ sudo tcpdump -i any tcp port 10008 -s 0 -w /tmp/capute.pcap -v
When enough traffic is captured, press Ctrl-C and collect the file /tmp/capture.pcap that contains the traffic capture.
This file can be opened in Wireshark.
Syslog
Sections: input:TCPBSDSyslogRFC6587, input:TCPBSDSyslogNoFraming
Special cases of TCP input for parsing SysLog via TCP. For more information, see RFC 6587 and RFC 3164, section 4.1.1
The configuration options for listening on a given path:
address: # Specify IPv4, IPv6 or UNIX file path to listen from (f. e. 127.0.0.1:8888 or /data/mysocket)
output: # Which output to send the incoming events to
The following configuration options are available only for input:TCPBSDSyslogRFC6587:
max_sane_msg_len: # (optional) Maximum size in bytes of SysLog message to be received (default: 10000)
The following configuration options are available only for input:TCPBSDSyslogNoFraming:
buffer_size: # (optional) Maximum size in bytes of SysLog message to be received (default: 64 * 1024)
variant: # (optional) The variant of SysLog format of the incoming message, can be `auto`, `nopri` with no PRI number in the beginning and `standard` with PRI (default: auto)
Subprocess
Section: input:SubProcess
The SubProcess input runs a command as a subprocess of the LogMan.io collector, while
periodically checking for its output at stdout (lines) and stderr.
The configuration options include:
command: # Specify the command to be run as subprocess (f. e. tail -f /data/tail.log)
output: # Which output to send the incoming events to
line_len_limit: # (optional) The length limit of one read line (default: 1048576)
ok_return_codes: # (optional) Which return codes signify the running status of the command (default: 0)
File tailing
Section: input:SmartFile
Smart File Input is used for collecting events from multiple files whose content may be dynamically modified,
or the files may be deleted altogether by another process, similarly to the tail -f shell command.
Smart File Input creates a monitored file object for every file path, that is specified in the configuration in the path options.
The monitored file periodically checks for new lines in the file, and if one occurs, the line is read in bytes and passed further to the pipeline, including meta information such as file name and extracted parts of file path, see extract parameters section.
Various protocols are used for reading from different log file formats:
- Line Protocol for line-oriented log files
- XML Protocol for XML-oriented log files
- W3C Extended Log File Protocol for log files in W3C Extended Log File Format
- W3C DHCP Server Protocol for DHCP Server log files
Required configuration options:
input:SmartFile:MyFile:
path: | # File paths separated by newlines
/first/path/to/log/files/*.log
/second/path/to/log/files/*.log
/another/path/*s
protocol: # Protocol to be used for reading
Optional configuration options:
recursive: # Recursive scanning of specified paths (default: True)
scan_period: # File scan period in seconds (default: 3 seconds)
preserve_newline: # Preserve new line character in the output (default: False)
last_position_storage: # Persistent storage for the current positions in read files (default: ./var/last_position_storage)
Tip
In more complex setup, such as an extraction of logs from the Windows shared folder, you can utilize rsync to synchronize logs from the shared folder to a local folder at the collector machine. Then Smart File Input reads logs from the local folder.
Warning
Internally, the current position in the file is stored in last position storage in position variable. If the last position storage file is deleted or not specified, all files are read all over again after the LogMan.io Collector restarts, i.e. no persistence means reset of the reading when restarting.
You can configure path for last position storage:
last_position_storage: "./var/last_position_storage"
Warning
If the file size is lower than the previous remembered file size, the file is read as a whole over again and sent to the pipeline split to lines.
File paths
File path globs are separated by newlines. They can contain wildcards (such as *, **, etc.).
path: |
/first/path/*.log
/second/path/*.log
/another/path/*
By default, files are read recursively. You can disable recursive reading with:
recursive: False
Line Protocol
protocol: line
line/C_separator: # (optional) Character used for line separator. Default: '\n'.
Line Protocol is used for reading messages from line-oriented log files.
XML Protocol
protocol: xml
tag_separator: '</msg>' # (required) Tag for separator.
XML Protocol is used for reading messages from XML-oriented log files.
Parameter tag_separator must be included in configuration.
Example
Example of XML log file:
...
<msg time='2024-04-16T05:47:39.814+02:00' org_id='orgid'>
<txt>Log message 1</txt>
</msg>
<msg time='2024-04-16T05:47:42.814+02:00' org_id='orgid'>
<txt>Log message 2</txt>
</msg>
<msg time='2024-04-16T05:47:43.018+02:00' org_id='orgid'>
<txt>Log message 3</txt>
</msg>
...
Example configuration:
input:SmartFile:Alert:
path: /xml-logs/*.xml
protocol: xml
tag_separator: "</msg>"
W3C Extended Log File Protocol
protocol: w3c_extended
W3C Extended Log File Protocol is used for collecting events from files in W3C Extended Log File Format and serializing them into JSON format.
Example of event collection from Microsoft Exchange Server
LogMan.io Collector Configuration example:
input:SmartFile:MSExchange:
path: /MicrosoftExchangeServer/*.log
protocol: w3c_extended
extract_source: file_path
extract_regex: ^(?P<file_path>.*)$
Example of log file content:
#Software: Microsoft Exchange Server
#Version: 15.02.1544.004
#Log-type: DNS log
#Date: 2024-04-14T00:02:48.540Z
#Fields: Timestamp,EventId,RequestId,Data
2024-04-14T00:02:38.254Z,,9666704,"SendToServer 122.120.99.11(1), AAAA exchange.bradavice.cz, (query id:46955)"
2024-04-14T00:02:38.254Z,,7204389,"SendToServer 122.120.99.11(1), AAAA exchange.bradavice.cz, (query id:11737)"
2024-04-14T00:02:38.254Z,,43150675,"Send completed. Error=Success; Details=id=46955; query=AAAA exchange.bradavice.cz; retryCount=0"
...
W3C DHCP Server Format
protocol: w3c_dhcp
W3C DHCP Protocol is used for collecting events from DHCP Server log files. It is very similar to W3C Extended Log File Format with the difference in log file header.
Table of W3C DHCP events identification
| Event ID | Meaning |
|---|---|
| 00 | The log was started. |
| 01 | The log was stopped. |
| 02 | The log was temporarily paused due to low disk space. |
| 10 | A new IP address was leased to a client. |
| 11 | A lease was renewed by a client. |
| 12 | A lease was released by a client. |
| 13 | An IP address was found to be in use on the network. |
| 14 | A lease request could not be satisfied because the scope's address pool was exhausted. |
| 15 | A lease was denied. |
| 16 | A lease was deleted. |
| 17 | A lease was expired and DNS records for an expired leases have not been deleted. |
| 18 | A lease was expired and DNS records were deleted. |
| 20 | A BOOTP address was leased to a client. |
| 21 | A dynamic BOOTP address was leased to a client. |
| 22 | A BOOTP request could not be satisfied because the scope's address pool for BOOTP was exhausted. |
| 23 | A BOOTP IP address was deleted after checking to see it was not in use. |
| 24 | IP address cleanup operation has began. |
| 25 | IP address cleanup statistics. |
| 30 | DNS update request to the named DNS server. |
| 31 | DNS update failed. |
| 32 | DNS update successful. |
| 33 | Packet dropped due to NAP policy. |
| 34 | DNS update request failed as the DNS update request queue limit exceeded. |
| 35 | DNS update request failed. |
| 36 | Packet dropped because the server is in failover standby role or the hash of the client ID does not match. |
| 50+ | Codes above 50 are used for Rogue Server Detection information. |
Example of event collection from DHCP Server
LogMan.io Collector Configuration example:
input:SmartFile:DHCP-Server-Input:
path: /DHCPServer/*.log
protocol: w3c_dhcp
extract_source: file_path
extract_regex: ^(?P<file_path>.*)$
Example of DHCP Server log file content:
DHCP Service Activity Log
Event ID Meaning
00 The log was started.
01 The log was stopped.
...
50+ Codes above 50 are used for Rogue Server Detection information.
ID,Date,Time,Description,IP Address,Host Name,MAC Address,User Name, TransactionID, ...
24,04/16/24,00:00:21,Database Cleanup Begin,,,,,0,6,,,,,,,,,0
24,04/16/24,00:00:22,Database Cleanup Begin,,,,,0,6,,,,,,,,,0
...
For instance, ignore_older_than limit for files being red can be set to ignore_older_than: 20d or ignore_older_than: 100s.
Extract parameters
There are also options for the extraction of information from the file name or file path using a regular expression.
The extracted parts are then stored as meta data (which implicitly include unique meta ID and file name).
The configuration options start with extract_ prefix and include the following:
extract_source: # (optional) file_name or file_path (default: file_path)
extract_regex: # (optional) regex to extract field names from the extract source (disabled by default)
The extract_regex must contain named groups. The group names are used as field keys for the extracted information.
Unnamed groups produce no data.
Example of extracting metadata from regex
Collecting from a file /data/myserver.xyz/tenant-1.log
The following configuration:
extract_regex: ^/data/(?P<dvchost>\w+)/(?P<tenant>\w+)\.log$
will produce metadata:
{
"meta": {
"dvchost": "myserver.xyz",
"tenant": "tenant-1"
}
}
The following in a working example of configuration of SmartFile input with extraction
of attributes from file name using regex, and associated File output:
input:SmartFile:SmartFileInput:
path: ./etc/tail.log
extract_source: file_name
extract_regex: ^(?P<dvchost>\w+).log$
output: FileOutput
output:File:FileOutput:
path: /data/my_path.txt
prepend_meta: true
debug: true
Prepending information
prepend_meta: true
Prepends the meta information such as the extracted field names to the log line/event as key-values pairs separated by spaces.
Ignore old changes
The following configuration options enable to check that modification time of files being read is not older than the specified limit.
ignore_older_than: # (optional) Limit in days, hours, minutes or seconds to read only files modified after the limit (default: "", f. e. "1d", "1h", "1m", "1s")
File
Section: input:File, input:FileBlock, input:XML
These inputs read specified files by lines (input:File) or as a whole block (input:FileBlock, input:XML)
and pass their content further to the pipeline.
Depending on the mode, the files may be then renamed to <FILE_NAME>-processed
and if more of them are specified using a wildcard, another file will be open,
read and processed in the same way.
The available configuration options for opening, reading and processing the files include:
path: # Specify the file path(s), wildcards can be used as well (f. e. /data/lines/*)
chilldown_period: # If more files or wildcard is used in the path, specify how often in seconds to check for new files (default: 5)
output: # Which output to send the incoming events to
mode: # (optional) The mode by which the file is going to be read (default: 'rb')
newline: # (optional) File line separator (default is value of os.linesep)
post: # (optional) Specifies what should happen with the file after reading - delete (delete the file), noop (no renaming), move (rename to `<FILE_NAME>-processed`, default)
exclude: # (optional) Path of filenames that should be excluded (has precedence over 'include')
include: # (optional) Path of filenames that should be included
encoding: # (optional) Charset encoding of the file's content
move_destination: # (optional) Destination folder for post 'move', make sure it is outside of the path specified above
lines_per_event: # (optional) The number of lines after which the read method enters the idle state to allow other operations to perform their tasks (default: 10000)
event_idle_time: # (optional) The time in seconds for which the read method enters the idle state, see above (default: 0.01)
ODBC
Section: input:ODBC
Provides input via ODBC driver connection to collect logs form various databases.
Configuration options related to the connection establishment:
host: # Hostname of the database server
port: # Port where the database server is running
user: # Username to loging to the databse server (usually a technical/access account)
password: # Password for the user specified above
driver: # Pre-installed ODBC driver (see list below)
db: # Name of the databse to access
connect_timeout: # (optional) Connection timeout in seconds for the ODBC pool (default: 1)
reconnect_delay: # (optional) Reconnection delay in seconds after timeout for the ODBC pool (default: 5.0)
output_queue_max_size: # (optional) Maximum size of the output queue, i. e. in-memory storage (default: 10)
max_bulk_size: # (optional) Maximum size of one bulk composed of the incoming records (default 2)
output: # Which output to send the incoming events to
Configuration options related to querying the database:
query: # Query to periodically call the database
chilldown_period: # Specify in seconds how often the query above will be called (default: 5)
last_value_enabled: # Enable last value duplicity check (true/false)
last_value_table: # Specify table for SELECT max({}) from {};
last_value_column: # The column in query to be used for obtainment of last value
last_value_storage: # Persistent storage for the current last value (default: ./var/last_value_storage)
last_value_query: # (optional) To specify the last value query entirely (in case this option is set, last_value_table will not be considered)
last_value_start: # (optional) The first value to start from (default: 0)
Apache Kafka
Section: input:Kafka
This option is available from version v22.32
Creates a Kafka consumer for the specific .topic(s).
Configuration options related to the connection establishment:
bootstrap_servers: # Kafka nodes to read messages from (such as `kafka1:9092,kafka2:9092,kafka3:9092`)
Configuration options related to the Kafka Consumer setting:
topic: # Name of the topics to read messages from (such as `lmio-events` or `^lmio.*`)
group_id: # Name of the consumer group (such as: `collector_kafka_consumer`)
refresh_topics: # (optional) If more topics matching the topic name are expected to be created during consumption, this options specifies in seconds how often to refresh the topics' subscriptions (such as: `300`)
bootstrap_servers, topic and group_id options are always required
topic can be a name, a list of names separated by spaces or a simple regex (to match all available topics, use ^.*)
For more configuration options, please refer to https://github.com/edenhill/librdkafka/blob/master/CONFIGURATION.md
LogMan.io Collector Outputs
The collector output is specified as follows:
output:<output-type>:<output-name>:
debug: false
...
Common output options
In every output, meta information can be specified as dictionary in meta attribute.
meta:
my_meta_tag: my_meta_tag_value # (optional) Custom meta information, that will be later available in LogMan.io Parser in event's context
tenant meta information can be specified in the output's config directly.
Debugging
debug (optional)
Specify if to write output also to the log for debugging.
Default: false
Prepend the meta information
prepend_meta (optional)
Prepend the meta information to the the incoming event as key-values pairs separated by spaces.
Default: false
Note
Meta information include file name or extracted information from it (in case of Smart File input), custom defined fields (see below) etc.
TCP Output
Outputs events over TCP to a server specified by the IP address and the Port.
output:TCP:<output-name>:
address: <IP address>:<Port>
...
Address
address
The server address consists of the IP address and the port.
Hint
IPv4 and IPv6 addresses are supported.
Maximum size of packets
max_packet_size (optional)
Specify the maximum size of packets in bytes.
Default: 65536
Receiver size of the buffer
receiver_buffer_size (optional)
Limit the receiver size of the buffer in bytes.
Default: 0
UDP Output
Outputs events over a UDP to the specified IP address and the Port.
output:UDP:<output-name>:
address: <IP address>:<Port>
...
Address
address
The server address consists of the IP address and the port.
Hint
IPv4 and IPv6 addresses are supported.
Maximum size of packets
max_packet_size (optional)
Specify the maximum size of packets in bytes.
Default: 65536
Receiver size of the buffer
receiver_buffer_size (optional)
Limit the receiver size of the buffer in bytes.
Default: 0
WebSocket Output
Outputs events over WebSocket to a specified URL.
output:WebSocket:<output-name>:
url: <Server URL>
...
URL
url
Specify WebSocket destination URL. For example http://example.com/ws
Tenant
tenant
Name of the tenant the LogMan.io Collector, the tenant name is forwarded to LogMan.io parser and put to the event.
Inactive time
inactive_time (optional)
Specify inactive time in seconds, after which idle Web Sockets will be closed.
Default: 60
Output queue size
output_queue_max_size (optional)
Specify in-memory outcoming queue size for every Web Socket
Path to store persistent files
buffer (optional)
Path to store persistent files in, when the Web Socket connection is offline.
SSL configuration options
The following configuration options specify the SSL (HTTPS) connection:
cert: Path to the client SSL certificatekey: Path to the private key of the client SSL certificatepassword: Private key file password (optional, default: none)cafile: Path to a PEM file with CA certificate(s) to verify the SSL server (optional, default: none)capath: Path to a directory with CA certificate(s) to verify the SSL server (optional, default: none)ciphers: SSL ciphers (optional, default: none)dh_params: Diffie–Hellman (D-H) key exchange (TLS) parameters (optional, default: none)verify_mode: One of CERT_NONE, CERT_OPTIONAL or CERT_REQUIRED (optional); for more information, see: github.com/TeskaLabs/asab
File Output
Outputs events into a specified file.
output:File:<output-name>:
path: /data/output.log
...
Path
path
Path of the output file.
Hint
Make sure the location of the output file is accessible within the Docker container when using Docker.
Flags
flags (optional)
One of O_CREAT and O_EXCL, where the first one tell the output to create the file if it does not exist.
Default: O_CREAT
Mode
mode (optional)
The mode by which the file is going to be written to.
Default: ab (append bytes).
Unix Socket (datagram)
Outputs events into a datagram-oriented Unix Domain Socket.
output:UnixSocket:<output-name>:
address: <path>
...
Address
address
The Unix socket file path, e.g. /data/myunix.socket.
Maximum size of packets
max_packet_size (optional)
Specify the maximum size of packets in bytes.
Default: 65536
Unix Socket (stream)
Outputs events into a stream-oriented Unix Domain Socket.
output:UnixStreamSocket:<output-name>:
address: <path>
...
Address
address
The Unix socket file path, e.g. /data/myunix.socket.
Maximum size of packets
max_packet_size (optional)
Specify the maximum size of packets in bytes.
Default: 65536
Print Output
Helper output that print events to the terminal.
output:Print:<output-name>:
...
Null Output
Helper outputs that discard events.
output:Null:<output-name>:
...
LogMan.io Collector Transformations
Transformations are used for pre-processing the incoming event with user-defined declaration before it is passed to the specified output.
Available transforms
transform:Declarative:provides declarative processor, that is configured via declarative configuration (YAML)transform:XMLToDict:is typically used for XML files and Windows Events from WinRM.
LogMan.io Collector Mirage
LogMan.io Collector has the ability to create mock logs and send them through the data pipeline, mainly for testing and demonstration purposes. The source that produces mock logs is called Mirage.
Mirage uses LogMan.io Collector Library as a repository for collected logs from various providers. The logs in this library are derived from real logs.
Mirage input configuration
# Configuration YAML file for inputs
[config]
path=./etc/lmio-collector.yaml
# Connection to the Library where Mirage logs are stored
[library]
providers=git+http://user:password@gitlab.example.com/lmio/lmio-collector-library.git
[web]
listen=0.0.0.0 8088
input:Mirage:MirageInput:
path: /Mirage/<path>/
eps: <number of logs sent per second>
output: <output_id>
Throughput of logs
You can define the number of logs produced every second (EPS - events per second).
The configuration below will produce 20 logs every second:
input:Mirage:MirageInput:
eps: 20
This configuration will also add deviation, so each second the amount will be between 10 and 40 logs:
input:Mirage:MirageInput:
eps: 20
deviation: 0.5
In order to create a more realistic log source and change EPS during the day, you can use scenarios.
input:Mirage:MirageInput:
eps: dayshift
deviation: 0.5
Available options are:
- normal
- gaussian
- dayshift
- nightshift
- tiny
- peak
Finally, you can create a custom scenario. You can set EPS every minute:
input:Mirage:MirageInput:
eps:
"10:00": 10
"12:00": 20
"15:10": 10
"15:11": 12
"16:00": 5
"23:00": 0
deviation: 0.5
Adding new log sources to the Library
- Create a new repository for log collection or clone the existing one.
- Create a new directory. Name the directory after the log source.
- Create a new file for each log in the source directory. Mirage can use the same log multiple times when sending logs through the pipeline. (You don't need 100 separate log files to send 100 logs - Mirage will repeat the same logs.)
By default, when sending logs through the pipeline, Mirage chooses from your log files randomly and approximately evenly, but you can add weight to logs to change that.
Templating logs
To get more unique logs without having to create more log files, template your logs. You can choose which fields in the log will have variable values, then make a list of values you want to populate that field, and Mirage will randomly choose the values.
-
In your log, choose which field you would like to have variable values. Replace the field values with
${fieldname}, wherefieldnameis what you will call the field in your list."user.name":${user.name}, "id":${id}, "msg":${msg} -
Make a file called
values.yamlin your log source directory. -
In the new file
values.yaml, list possible values for each templated field. Match the field names in thevalues.yamlfile to the field names in your log files.values: user.name: - Albus Dumbledore - Harry Potter - Hermione Granger id: - 171 - 182 - 193 msg: - Connection ended - Connection interrupted - Connection success - Connection failure
Datetime formats
Mirage can generate a current timestamp for each log. For that, you need to choose the format the timestamp will be in. To add a timestamp to your mock log, add ${datetime: <format>} to the text in the file.
Example
${datetime: %y-%m-%d %H:%M:%S} generates the timestamp 23-06-07 12:55:26
${datetime: %Y %b %d %H:%M:%S:%f} generates the timestamp 2023 Jun 07 12:55:26:002651
Datetime directives
Datetime directives are derived from the Python datetime module.
| Directive | Meaning | Example |
|---|---|---|
%a |
Weekday as locale’s abbreviated name. | Sun, Mon, ..., Sat (en_US); |
%A |
Weekday as locale’s full name. | Sunday, Monday, ..., Saturday (en_US); |
%w |
Weekday as a decimal number, where 0 is Sunday and 6 is Saturday. | 0, 1, ..., 6 |
%d |
Day of the month as a zero-padded decimal number. | 01, 02, ..., 31 |
%b |
Month as locale’s abbreviated name. | Jan, Feb, ..., Dec (en_US); |
%B |
Month as locale’s full name. | January, February, ..., December (en_US); |
%m |
Month as a zero-padded decimal number. | 01, 02, ..., 12 |
%y |
Year without century as a zero-padded decimal number. | 00, 01, ..., 99 |
%Y |
Year with century as a decimal number. | 0001, 0002, ..., 2013, 2014, ..., 9998, 9999 |
%H |
Hour (24-hour clock) as a zero-padded decimal number. | 00, 01, ..., 23 |
%I |
Hour (12-hour clock) as a zero-padded decimal number. | 01, 02, ..., 12 |
%p |
Locale’s equivalent of either AM or PM. | AM, PM (en_US); am, pm (de_DE) |
%M |
Minute as a zero-padded decimal number. | 00, 01, ..., 59 |
%S |
Second as a zero-padded decimal number. | 00, 01, ..., 59 |
%f |
Microsecond as a decimal number, zero-padded to 6 digits. | 000000, 000001, ..., 999999 |
%z |
UTC offset in the form ±HHMM[SS[.ffffff]] (empty string if the object is naive). | (empty), +0000, -0400, +1030, +063415, -030712.345216 |
%Z |
Time zone name (empty string if the object is naive). | (empty), UTC, GMT |
%j |
Day of the year as a zero-padded decimal number. | 001, 002, ..., 366 |
%U |
Week number of the year (Sunday as the first day of the week) as a zero-padded decimal number. All days in a new year preceding the first Sunday are considered to be in week 0. | 00, 01, ..., 53 |
%W |
Week number of the year (Monday as the first day of the week) as a zero-padded decimal number. All days in a new year preceding the first Monday are considered to be in week 0. | 00, 01, ..., 53 |
%c |
Locale’s appropriate date and time representation. | Tue Aug 16 21:30:00 1988 (en_US); Di 16 Aug 21:30:00 1988 (de_DE) |
%x |
Locale’s appropriate date representation. | 08/16/88 (None); 08/16/1988 (en_US); 16.08.1988 (de_DE) |
%X |
Locale’s appropriate time representation. | 21:30:00 (en_US); 21:30:00 (de_DE) |
%% |
A literal '%' character. | % |
Log weight
If you want Mirage to select some logs more often and some less, you can give certain log files more weight. Weight means how much more or less a log file is selected, compared to others.
To change the weight, add a number at the beginning of the log file name. This number creates a ratio with the other log files. If a file does not begin with a number, Mirage considers it to be a 1.
Example
5-example1.log2-example2.log3-example3.logexample4.log
Mirage would send these logs in a 5:2:3:1 ratio.
Collecting into lookups
Files
To periodically collect lookups from files such as CSV, use the input:FileBlock: input with following configuration:
path: # Specify the lookup folder, where the file lookup will be stored (f. e. /data/lookups/mylookup/*)
chilldown_period: # Specify how often in seconds to check for new files (default: 5)
FileBlock reads all files in one block (one event is the entire file content) and passes it to configured output, which is usually output:WebSocket.
In such a way, the lookup is passed to LogMan.io Receiver, and, eventually, to LogMan.io Parser, where the lookup can be processed and stored in Elasticsearch. See Parsing lookups for more information.
Sample configuration
input:FileBlock:MyLookupFileInput:
path: /data/lookups/mylookup/*
chilldown_period: 10
output: LookupOutput
output:WebSocket:LookupOutput:
url: https://lm1/files-ingestor-ws
...
Default Configuration of LogMan.io Collector
The TeskaLabs LogMan.io collector is equipped with a default configuration designed for quick and efficient integration with typical log sources, optimizing initial setup times and providing robust connectivity out-of-the-box.
Default Network Ports for Log Sources
Below is a table outlining the default network ports used by various technologies when connecting to the LogMan.io Collector. Both UDP (User Datagram Protocol) and TCP (Transmission Control Protocol) ports are available to support different network communication needs.
| Vendor Technology |
Product Variant |
Port range | Stream name | Note |
|---|---|---|---|---|
| Linux | Syslog RFC 3164 | 10000 10009 |
linux-syslog-rfc3164 |
BSD Syslog Protocol |
| Linux | Syslog RFC 5424 | 10020 10029 |
linux-syslog-rfc5424 |
IETF Syslog Protocol |
| Linux | rsyslog | 10010 10019 |
linux-rsyslog |
|
| Linux | syslog-ng | 10030 10039 |
linux-syslogng |
|
| Linux | Auditd | 10040 10059 |
linux-auditd |
|
| Fortinet | FortiGate | 10100 10109 |
fortinet-fortigate |
RFC6587 Framing on TCP |
| Fortinet | FortiGate | 10110 10119 |
fortinet-fortigate |
|
| Fortinet | FortiSwitch | 10120 10129 |
fortinet-fortiswitch |
No Framing on TCP |
| Fortinet | FortiSwitch | 10130 10139 |
fortinet-fortiswitch |
|
| Fortinet | FortiMail | 10140 10159 |
fortinet-fortimail |
|
| Fortinet | FortiClient | 10160 10179 |
fortinet-forticlient |
|
| Fortinet | FortiAnalyzer | 10180 10199 |
fortinet-fortianalyzer |
|
| Cisco | ASA | 10300 10319 |
cisco-asa |
|
| Cisco | FTD | 10320 10339 |
cisco-ftd |
|
| Cisco | IOS | 10340 10359 |
cisco-ios |
|
| Cisco | ISE | 10360 10379 |
cisco-ise |
|
| Cisco | Switch Nexus | 10380 10399 |
cisco-switch-nexus |
|
| Cisco | WLC | 10400 10419 |
cisco-wlc |
|
| Dell | Switch | 10500 10519 |
dell-switch |
|
| Dell | PowerVault | 10520 10539 |
dell-powervault |
|
| Dell | iDRAC | 10540 10559 |
dell-idrac |
|
| HPE | Aruba Clearpass | 10600 10619 |
hpe-aruba-clearpass |
|
| HPE | Aruba IAP | 10620 10639 |
hpe-aruba-iap |
|
| HPE | Aruba Switch | 10640 10659 |
hpe-aruba-switch |
|
| HPE | Integrated Lights-Out (iLO) | 10660 10679 |
hpe-ilo |
|
| HPE | Primera | 10680 10699 |
hpe-primera |
|
| HPE | StoreOnce | 10700 10719 |
hpe-storeonce |
|
| Bitdefender | Gravity Zone | 10740 10759 |
bitdefender-gravityzone |
|
| Broadcom | Brocade Switch | 10760 10779 |
broadcom-brocade-switch |
|
| Devolutions | Devolutions Web Server | 10800 10819 |
devolutions-web-server |
|
| ESET | Protect | 10840 10859 |
eset-protect |
|
| F5 | 10860 10879 |
f5 |
||
| FileZilla | 10880 10899 |
filezilla |
||
| Gordic | Ginis | 10900 10919 |
gordic-ginis |
|
| IceWarp | Mail Server | 10920 10939 |
icewarp-mailserver |
|
| Kubernetes | 10940 10959 |
kubernetes |
||
| McAfee WebWasher | 10960 10979 |
mcafee-webwasher |
||
| MikroTik | 10980 10999 |
mikrotik |
||
| Oracle | Listener | 11000 11019 |
oracle-listener |
|
| Oracle | Spark | 11020 11039 |
oracle-spark |
|
| Ntopng | 11060 11079 |
ntopng |
||
| OpenVPN | 11080 11099 |
openvpn |
||
| SentinelOne | 11100 11119 |
sentinelone |
||
| Squid | Proxy | 11120 11139 |
squid-proxy |
|
| Synology | NAS | 11140 11159 |
synology-nas |
|
| Veeam | Backup & Replication | 11160 11179 |
veeam-backup-replication |
|
| ySoft | SafeQ | 11180 11199 |
ysoft-safeq |
|
| Ubiquiti | UniFi | 11200 11219 |
ubiquiti-unifi |
|
| VMware | vCenter | 11300 11319 |
vmware-vcenter |
|
| VMware | vCloud Director | 11320 11339 |
vmware-vcloud-director |
|
| VMware | ESXi | 11340 11359 |
vmware-esxi |
|
| ZyXEL | Switch | 11440 11459 |
zyxel-switch |
|
| Sophos | Standard Syslog Protocol | 11500 11519 |
sophos-standard-syslog-protocol |
The preffered logging format. |
| Sophos | Syslog Devide Standard Format | 11520 11539 |
sophos-device-standard-format |
Device standard logging format is deprecated. |
| Sophos | Unstructured Format | 11540 11559 |
sophos-unstructured |
Unstructured logging format is deprecated. |
| Custom | 14000 14099 |
custom |
Receiver
LogMan.io Receiver
TeskaLabs LogMan.io Receiver is a microservice responsible for receiving logs and other events from the LogMan.io collector, forwarding these logs into the central LogMan.io system, and archiving raw logs. LogMan.io Receiver forwards incoming logs into proper tenants.
Note
LogMan.io Receiver replaces LogMan.io Ingestor.
Communication link
The communication between lmio-collector and lmio-receiver is named "commlink", short for the Communication Link.
The websocket is used as a primary communication protocol but HTTPS calls from the collector are also utilized. The collector keeps the websocket connection to the receiver open for a long period of a time. When the communication link from the collector is terminated, the collector tries to reconnect periodically.
Note
Websocket connection utilizes server-side generated PING packets to keep the websocket open.
The Communication Link is protected by the mutual SSL authorization.
It means that each lmio-collector is equipped by the private key and the client SSL certificate.
The private key and the client SSL certificate is generated automatically during provisioning of the new collector.
The private key and the client SSL certificate are used to authenticate the collector.
This mechanism also provide a strong encryption of the traffic between the collector and the central part of the LogMan.io.
Production setup
The production setup is that LogMan.io Collector (lmio-collector) connects over HTTPS via NGINX server to LogMan.io Receiver (lmio-receiver).
graph LR
lmio-collector -- "websocket & SSL" --> n[NGINX]
n[NGINX] --> lmio-receiverDiagram: Production setup
For more info, continue to the NGINX section.
Non-production setup
The direct connection from lmio-collector to lmio-receiver is also supported.
It is suitable for non-production setups such as testing or development.
graph LR
lmio-collector -- "websocket & SSL" --> lmio-receiverDiagram: Non-production setup
High availability
TeskaLabs LogMan.io Receiver is designed to run in multiple instances, independent to LogMan.io tenants. The recommended setup is to operate one TeskaLabs LogMan.io Receiver on each node of the central LogMan.io cluster with the deployed NGINX.
TeskaLabs LogMan.io Collector uses DNS round-robin ballancing to connect to one of NGINX servers. The NGINX forwards the incoming communication links to the receiver instance, with the preference of the receiver running on the same node as the NGINX.
More than one lmio-receiver instance can be operated on the cluster node, for example if the performance of the single instance of lmio-receiver become the bottleneck.
Example of the high availability configuration
graph LR
c1[lmio-collector] -.-> n1[NGINX]
c1[lmio-collector] --> n2[NGINX]
c1[lmio-collector] -.-> n3[NGINX]
subgraph Node 3
n1[NGINX] --> r1[lmio-receiver]
end
subgraph Node 2
n2[NGINX] --> r2[lmio-receiver]
end
n2[NGINX] -.-> r1[lmio-receiver]
n2[NGINX] -.-> r3[lmio-receiver]
subgraph Node 1
n3[NGINX] --> r3[lmio-receiver]
endFailure recovery scenarios
- The
lmio-receiverinstance is terminated: NGINX rebalances commlinks to another instances of the receiver on other nodes. - The NGINX is terminated: the collector reconnects to another NGINX in the cluster.
- The whole cluster node is terminated: the collector reconnects to another NGINX in the cluster.
Receiver configuration
The receiver requires following dependencies:
- Apache ZooKeeper
- NGINX (for production deployments)
- Apache Kafka
Example
This is the minimalistic example of the LogMan.io receiver configuration:
[zookeeper]
servers=zookeeper-1:2181,zookeeper-2:2181,zookeeper-3:2181
[lifecycle]
hot=/data/ssd/receiver
warm=/data/hdd/receiver
cold=/data/nas/receiver
Zookeeper
Specify locations of the Zookeeper server in the cluster.
[zookeeper]
servers=zookeeper-1:2181,zookeeper-2:2181,zookeeper-3:2181
Hint
For non-production deployments, the use of a single Zookeeper server is possible.
Lifecycle
Each lifecycle phases needs to be specified, typically by specifying the filesystem paths.
[lifecycle]
hot=/data/ssd/receiver
warm=/data/hdd/receiver
cold=/data/nas/receiver
task_limit=20
A lifecycle phase name (i.e. 'hot', 'warm', 'cold') must not contain "_" character.
See the Lifecycle chapter for more details.
task_limit option specifies a maximum number of concurrently running lifecycle tasks on this node. 20 is a default value.
Warning
Do not change lifecycle paths after the receiver has already stored data. Changing the paths will not apply retrospectively, and the receiver will be unable to locate data for the lifecycle phase.
Web APIs
The receiver provides two Web APIs: public and private.
Public Web API
Public Web API is designed for the communication with collectors.
[web:public]
listen=3080
The default port of the public web API is tcp/3080.
This port is designed to serve as the NGINX upstream for connections from collectors. It is a recommended production setup.
Standalone Public Web API
You can operate lmio-receiver without NGINX in stand-alone non-production setup.
Warning
Don't use this mode for production deployments.
This is ideal for development and testing environments, because you don't need a NGINX.
This is the configuration example:
[web:public]
listen=3443 ssl:web:public
[ssl:web:public]
key=${THIS_DIR}/server-key.pem
cert=${THIS_DIR}/server-cert.pem
verify_mode=CERT_OPTIONAL
This is how to generate self-signed server certificate for above config:
$ openssl ecparam -genkey -name secp384r1 -out server-key.pem
$ openssl req -new -x509 -subj "/OU=LogMan.io Receiver" -key server-key.pem -out server-cert.pem -days 365
Private Web API
[web]
listen=0.0.0.0 8950
The default port of the private web API is tcp/8950.
Certificate Authority
The receiver automatically creates Certificate Authority used for a collector provisioning.
The CA artefacts are stored in the Zookeeper at /lmio/receiver/ca folder.
./lmio-receiver.py -c ./etc/lmio-receiver.conf
29-Jun-2023 19:43:50.651408 NOTICE asab.application is ready.
29-Jun-2023 19:43:51.716978 NOTICE lmioreceiver.ca.service Certificate Authority created
...
The default CA configration:
[ca]
curve=secp384r1
auto_approve=no
auto_approve option automates the collector enrollment process, every received CSR is automatically approved when set to yes.
Websocket
The default configuration of the websocket (to collectors)
[websocket]
timeout=30
compress=yes
max_msg_size=4M
Apache Kafka
The connection to Apache Kafka can be configured:
[kafka]
bootstrap_servers=kafka-1:9092,kafka-2:9092,kafka-3:9092
If the configuration is not present, then events are not forwarded to Apache Kafka.
Archive
The archive is enabled by default. Set the archive option to no to disable archive functionality.
[general]
archive=yes
Metrics
The receiver produces own telemetry and also forwards the telemetry from collectors to the configured telemetry data storage, such as InfluxDB.
[asab:metrics]
...
Signing keys
The signing key is used to digitally sign raw log archives.
You can specify the EC curve to be used for signing keys.
The default is prime256v1, also known as secp256r1.
[signing]
curve=prime256v1
Collector
Collector provisioning
The collector instance needs to be provisioned prior the collector is authorized to send logs to the TeskaLabs LogMan.io. The provisioning is done exactly once during the collector life cycle.
Note
TeskaLabs LogMan.io Receiver operates Certificate Authority. The provisioning process is the approval of the CSR finished by the issuance of the client SSL certificate for the collector. This client certificate is used by the collector for its authentication.
The provisioning starts at the collector. The minimal collector YAML configuration specifies the URL of the LogMan.io entry endpoint for commlinks.
connection:CommLink:commlink:
url: https://recv.logman.example.com/
When the collector is started, it submits its enrolment request to the receiver. The collector also prints output similar to this one
...
Waiting for an approval, the identity: 'ABCDEF1234567890'
Waiting for an approval, the identity: 'ABCDEF1234567890'
It means that the collector has an unique identity ABCDEF1234567890 and that the receiver awaits an approval of this collector.
On the receiver side, the approval is granted by a following call:
curl -X 'PUT' \
http://lmio-receiver/provision/ABCDEF1234567890 \
-H 'Content-Type: application/json' \
-d '{"tenant": "mytenant"}'
Warning
Speficy a correct tenant in the request, instead of mytenant value.
Hint
Approval can be granted also using web browser at the "Approve a CSR received from the collector" at http://lmio-receiver/doc
Mind that ABCDEF1234567890 needs to be replaced by the real identity from the output of the collector.
The tenant has to be specified in the request as well.
When this call is executed, the collector informs that it is provisioned and ready:
Waiting for an approval, the identity: 'ABCDEF1234567890'
29-Jun-2023 02:05:35.276253 NOTICE lmiocollector.commlink.identity.service The certificate received!
29-Jun-2023 02:05:35.277731 NOTICE lmiocollector.commlink.identity.service [sd identity="ABCDEF1234567890"] Ready.
29-Jun-2023 02:05:35.436872 NOTICE lmiocollector.commlink.service [sd url="https://recv.logman.example.com/commlink/v2301"] Connected.
Certificates of provisioned clients are stored in the ZooKeeper at /lmio/receiver/clients.
Info
The tenant name is stored in the generated SSL client certificate.
CSRs that are not provisioned within 2 days are removed. The provisioning procedure can be restarted once the collector submits a new CSR.
Removing the collector
For removal of the provisioned collector at the receiver side, delete the relevant entry from a ZooKeeper folder /lmio/receiver/clients.
This means that you revoked a grant of the collector to connect to a receiver.
Warning
The deletion will not affect currently connected collectors. The automated disconnection is on the product roadmap.
For removing at the collector side, delete ssl-cert.pem and ssl-key.pem when the collector is stopped.
The collector will start new enrollment under a new identity when started.
This action is called a reset of the collector identity.
Collector configuration
connection:CommLink:commlink:
url: https://recv.logman.example.com/
input:..:LogSource1:
output: logsource-1
output:CommLink:logsource-1: {}
...
Section connection:CommLink:commlink:
This section configures a communication link to the central part of the TeskaLabs LogMan.io.
The configuration can be also provided by the application configuration file.
If the section [commlink] is present, items from there are loaded before applying values from YAML.
Example
Empty YAML specification:
connection:CommLink:commlink: {}
...
URL is used from the application configuration:
[commlink]
url=https://recv.logman.example.com/
...
Option url
Mandatory value with URL of the central part of LogMan.io.
It must use https:// protocol, not http://.
Typical values are:
https://recv.logman.example.com/- for a dedicated NGINX server for receiving logshttps://logman.example.com/lmio-receiver- for a single DNS domain on NGINX server
Can be also provided in the environment variable LMIO_COMMLINK_URL.
Option insecure
Optional (default: no) boolean value that allows insecure server connections if set to yes.
This option allows a use of self-signed server SSL certificates.
Danger
Don't use insecure option in the production setups.
Tip
This is an easy way how you can specify a trusted custom CA certificate so that you don't need to set insecure: yes.
connection:CommLink:commlink: {}
url: https://recv.logman.example.com/
cadata: |
-----BEGIN CERTIFICATE-----
<PEM form of the CA certificate>
-----END CERTIFICATE-----
...
You can specify more then one CA certificate Mind the proper YAML formating, you need to indent the PEM block.
You can use also cafile and capath to specify filesystem path(s) to your CA.
Advanced SSL configuration options
The following configuration options specify the SSL (HTTPS) connection:
cert: Path to the client SSL certificatekey: Path to the private key of the client SSL certificatepassword: Private key file password (optional, default: none)cafile: Path to a PEM file with CA certificate(s) to verify the SSL server (optional, default: none)capath: Path to a directory with CA certificate(s) to verify the SSL server (optional, default: none)cadata: one or more PEM-encoded CA certificates to verify the SSL server (optional, default: none)ciphers: SSL ciphers (optional, default: none)dh_params: Diffie–Hellman (D-H) key exchange (TLS) parameters (optional, default: none)verify_mode: One of CERT_NONE, CERT_OPTIONAL or CERT_REQUIRED (optional); for more information, see: github.com/TeskaLabs/asab
Section output:CommLink:<stream>:
<stream> The stream name in the archive and in the Apache Kafka topics.
Logs will be fed into the stream name received.<tenant>.<stream>.
{} means at the end that there are no options for this output.
Note
Generic options for output: applies as well.
Such as debug: true for a troubleshooting.
Multiple sources
The collector can handle multiple log sources (event lanes) from the one instance.
For each source, add input:.. and output:CommLink:... section to the configuration.
Example
connection:CommLink:commlink:
url: https://recv.logman.example.com/
# First (TCP) log source
input:Stream:LogSource1:
address: 8888 # Listen on TCP/8888
output: tcp-8888
output:CommLink:tcp-8888: {}
# Second (UDP) log source
input:Datagram:LogSource2:
address: 8889 # Listen on UDP/8889
output: udp-8889
output:CommLink:udp-8889: {}
# Third (UDP + TCP) log source
input:Stream:LogSource3s:
address: 8890 # Listen on TCP/8890
output: p-8890
input:Datagram:LogSource3d:
address: 8890 # Listen on UDP/8890
output: p-8890
output:CommLink:p-8890: {}
Warning
Log sources collected by a one instance of the collector must share one tenant.
Delivery methods
When a collector is online, logs and other events are deliverted instantly over the Websocket.
When a collector is offline, logs are stored in the offline buffer and once the collector become online, buffered logs are synced back. This delivery method is called syncback. Buffered logs are uploaded using HTTP PUT request.
Offline buffer
When the collector is not connected to a receiver, logs are stored in the collector local buffer and uploaded to the receiver as soon as the connectivity is restored.
Buffered logs are compressed using xz when stored in the offline buffer.
The local buffer is a directory on the filesystem, the location of this folder can be configured:
[general]
buffer_dir=/var/lib/lmio-receiver/buffer
Warning
The collector monitors an available disk capacity in this folder and it will stop buffering logs when less than 5% of the disk space is free.
Reconnection during housekeeping
The collector reconnects every day during housekeeping - typically at 4:00 in the morning. This is to restore balanced distribution of connected collectors across the cluster.
Archive
The LogMan.io Receiver archive is immutable, column-oriented, append-only data storage of the received raw logs.
Each commlink feeds data into the stream.
The stream is a infinite table with fields.
The stream name is composed by the received. prefix, the name of the tenant and a commlink (ie. received.mytenant.udp-8889)
The archive stream contains following fields for each log entry:
raw: Raw log (string, digitally signed)row_id: Primary identifier of the row unique across all streams (64bit unsigned integer)collected_at: Date&time of the log collection at the collectorreceived_at: Date&time of the log receival to the receiversource: Description of the log source (string)
The source field contains:
- for TCP inputs:
<ip address> <port> S(S is for a stream) - for UDP inputs:
<ip address> <port> D(D is for a datagram) - for file inputs: a filename
- for other inputs: optional specification of the source
The source field for a log delivered over UDP
192.168.100.1 61562 D
The log was collected from IP address 192.168.100.1 and port UDP/61562.
Partition
Every stream is divided into partitions. Partitions of the same stream can be located on different receiver instances.
Info
Partitions can share identical periods of time. This means that data entries from the same span of time could be found in more than one partition.
Each partition has its number (part_no), starting from 0.
This number monotonically increases for new partitions in the archive, across streams.
The partition number is globally unique, in terms of the cluster.
The partition number is encoded into the partition name.
The partition name is 6 character name, which starts with aaaaaa (aka partition #0) and continues to aaaaab (partition #1) and so on.
The parititon can be investigated in the Zookeeper:
/lmio/receiver/db/received.mytenant.udp-8889/aaaaaa.part
partno: 0 # The partition number, translates to aaaaaa
count: 4307 # Number of rows in this partition
size: 142138 # Size of the partition in bytes (uncompressed)
created_at:
iso: '2023-07-01T15:22:53.265267'
unix_ms: 1688224973265267
closed_at:
iso: '2023-07-01T15:22:53.283168'
unix_ms: 1688224973283167
extra:
address: 192.168.100.1 49542 # Address of the collector
identity: ABCDEF1234567890 # Identity of the collector
stream: udp-8889
tenant: mytenant
columns:
raw:
type: string
collected_at:
summary:
max:
iso: '2023-06-29T20:33:18.220173'
unix_ms: 1688070798220173
min:
iso: '2023-06-29T18:25:03.363870'
unix_ms: 1688063103363870
type: timestamp
received_at:
summary:
max:
iso: '2023-06-29T20:33:18.549359'
unix_ms: 1688070798549359
min:
iso: '2023-06-29T18:25:03.433202'
unix_ms: 1688063103433202
type: timestamp
source:
summary:
token:
count: 2
type: token:rle
Tip
Because the partition name is globally unique, it is possible to move partition to a shared storage, ie. NAS or a cloud storage from a different nodes of the cluster. The lifecycle is designed in a way that partition names will not collide, so data will not be overwritten by different receivers but reassembled correctly on the "shared" storage.
Lifecycle
The partition lifecycle is defined by phases.
The ingest partitions are partitions that receives the data. Once the ingest is completed, aka rotated to the new partition, the former partition is closed. The partition cannot be reopen.
When the partition is closed, the partition lifecycle starts. Each phase is configured to point to a specific directory on the filesystem.
The lifecycle is defined on the stream level, at /lmio/receiver/db/received... entry in the ZooKeeper.
Tip
Partitions can be also moved manualy into a desired phase by the API call.
Default lifecycle
The default lifecycle consists of three phases: hot, warm and cold.
graph LR
I(Ingest) --> H[Hot];
H --1 week--> W[Warm];
W --3 months--> D(Delete);
H --immediately-->C[Cold];
C --18 months--> CD(Delete);The ingest is done into the hot phase. Once the ingest is completed and the partition is closed, the partition is copied into the cold phase. After a week, the partition is moved to the warm phase. It means that the partition is duplicated - one copy is in the cold phase storage, the second copy is in the warm phase storage.
The partition on the warm phase storage is deleted after 6 months.
The partition on the cold phase storage is compressed using xz/LZMA. The partition is deleted from the cold phase after 18 months.
Default lifecycle definition
Each stream has such a definition stored in the corresponding ZooKeeper node. That's also where you can edit the lifecycle setup.
E.g. for mongo stream in the system tenant, the corresponding ZooKeeper node carrying the configuration is /lmio/receiver/db/received.system.mongo.
define:
type: jizera/stream
ingest: # (1)
phase: hot
rotate_size: 30G
rotate_time: daily
lifecycle:
hot:
- move: # (2)
age: 1w
phase: warm
- copy: # (3)
phase: cold
warm:
- delete: # (4)
age: 3M
cold:
- compress: # (5)
type: xz
preset: 6
threads: 4
- delete: # (6)
age: 18M
- Ingest new logs into the hot phase.
- After one week, move the partition from a hot to a warm phase.
- Copy the partition into a cold phase immediately after closing of ingest.
- Delete the partition after 3 months.
- Compress the partition immediatelly on arrival to the cold phase.
- Delete the partition after 18 months from the cold phase.
The phase storage tiers recommendations:
- Hot phase should be located on SSDs
- Warm phase should be located on HDDs
- Cold phase is an archive, could be located on NAS or slow HDDs.
Note
For more information, visit the Administration manual, chapter about Disk storage.
Lifecycle rules
move: Move the partition at specifiedageto the specifiedphase.copy: Copy the partition at specifiedageto the specifiedphase.delete: Delete the partition at specifiedage.
The age can be e.g. "3h" (three hours), "5M" (five months), "1y" (one year) and so on.
Supported age postfixes:
y: year, respectively 365 daysM: month, respectively 31 daysw: weekd: dayh: hourm: minute
Note
If age is not specified, then the age is set to 0, which means that the lifecycle action is taken immediately.
Compression rule
compress: Compress the data on receival to the phase.
Currently type: xz is supported with following options:
preset: The xz compression preset.
The compression preset levels can be categorised roughly into three categories:
0 ... 2
Fast presets with relatively low memory usage. 1 and 2 should give compression speed and ratios comparable to bzip2 1 and bzip2 9, respectively.
3 ... 5
Good compression ratio with low to medium memory usage. These are significantly slower than levels 0-2.
6 ... 9
Excellent compression with medium to high memory usage. These are also slower than the lower preset levels.
The default is 6.
Unless you want to maximize the compression ratio, you probably don't want a higher preset level than 7 due to speed and memory usage.
threads: Maximum number of CPU threads used for a compression.
The default is 1.
Set to 0 to use as many threads as there are processor cores.
Manual decompression
You can use xz --decopress or unxz from XZ Utils.
You can use Z-Zip to decompress archive files on Windows.
Always work on the copy of files in the archive; copy all files out of the archive first, and don't modify (decompress) files in the archive.
Replication rule
replica: Specify the number of data copies (replicas) should be present in the phase.
Replicas are stored on a different receiver instances, so that the number of replicas should NOT be greater than the number of receivers in the cluster that operates a given phase. Otherwise the "excessive" replica will not be created because the available receiver instance is not found.
Replication in the hot phase
define:
type: jizera/stream
lifecycle:
hot:
- replica:
factor: 2
...
factor: A number of copies of the data in the phase, the default value is 1.
Rotation
A partition rotation is a mechanism that closed ingest partitions at specific conditions. When the ingest partition is closed, new data are stored in the newly created another ingest partition. This ensures more or less even slicing of the infinite stream of the data.
The rotation is configured on the stream level by:
rotate_time: the period (iedaily) the partition can be in the ingest moderotate_size: the maximum size of the partition;T,G,Mandkpostfixes are supported using base 10.
Both options can be applied simultanously.
The default stream rotation is daily and 30G.
Roadmap
Only daily option is available at the moment for rotate_time.
Data vending
The data can be extracted from the archive (ie. for third party processing, migration and so one) by copying out the data directory of partitions in scope.
Use Zookeeper to identify what partitions are in scope of the vending and where they are physically located on storages.
The raw column can be directly processed by third party tools.
When the data are compressed by the lifecycle configuration, the decompression can be needed.
Note
It means that you don't need to move partition from ie. cold phase into warm or hot phase.
Replay of the data
The archived logs can be replayed to subsequent central components.
Non-repudiation
The archive is a cryptographically secured, designed for traceability and non-repudiation. Digital signatures are used to verify the authenticity and integrity of the data, providing assurance that the logs have not been tampered with and were indeed generated by the stated log source.
This digital signature-based approach to maintaining logs is an essential aspect of secure logging practices and a cornerstone of a robust information security management system. These logs are vital tools for forensic analysis during an incident response, detecting anomalies or malicious activities, auditing, and regulatory compliance.
We use following cryptographical algorithms to ensure the security of logs: SHA256, ECDSA.
The hash function, SHA256, is applied to each raw log entry. This function takes the input raw log entry and produces a fixed-size string of bytes. The output (or hash) is unique to the input data; a slight alteration in the input will produce a dramatically different output, a characteristic known as the "avalanche effect".
This unique hash is then signed using a private signing key through the ECDSA algorithm, which generates a digital signature that is unique to both the data and the key. This digital signature is stored alongside the raw log data, certifying that the log data originated from the specified log source and has not been tampered with during storage.
Digital signatures of raw columns are stored in the ZooKeeper (the canonical location) and in the filesystem, under the filename col-raw.sig.
Each partition is also equipped with a unique SSL signing certificate, named signing-cert.der.
This certificate, in conjunction with the digital signature, can be used to verify that the col-raw.data (the original raw logs) has not been altered, thus ensuring data integrity.
Important
Please note that the associated private signing key is not stored anywhere but in the process memory for security purposes. The private key is removed as soon as the partition has finished its data ingest.
The signing certificate is issued by an internal Certificate Authority (CA).
The CA's certificate is available in ZooKeeper at /lmio/receiver/ca/cert.der.
Digital signature verification
You can verify the digital signature by using the following OpenSSL commands:
$ openssl x509 -inform der -in signing-cert.der -pubkey -noout > signing-publickey.pem
$ openssl dgst -sha256 -verify signing-publickey.pem -signature col-raw.sig col-raw.data
Verified OK
These commands extract the public key from the certificate (signing-cert.der), and then use that public key to verify the signature (col-raw.sig) against the data file (col-raw.data). If the data file matches the signature, you'll see a Verified OK message.
Additionally, verify also the signing-cert.der, this certificate has to be issued by the internal CA.
Practical example
The practical example of archive applied on the log stream from Microsoft 365.
The "cold" phase is stored on NAS, mounted to /data/nas with XZ compression enabled.
Statistics
- Date range: 3 months
- Rotation: daily (typically one partition is created per day)
- Total size: 8.3M compressed, compression ratio: 92%
- Total file count: 1062
Content of directories
tladmin@lm01:/data/nas/receiver/received.default.o365-01$ ls -l
total 0
drwxr-x--- Jul 25 20:59 aaaebd.part
drwxr-x--- Jul 25 21:02 aaaebe.part
drwxr-x--- Jul 26 21:02 aaaebg.part
drwxr-x--- Jul 27 21:03 aaaeph.part
drwxr-x--- Jul 28 21:03 aaagaf.part
drwxr-x--- Jul 29 21:04 aaagfn.part
drwxr-x--- Jul 30 21:05 aaagjm.part
drwxr-x--- Jul 31 21:05 aaagog.part
drwxr-x--- Aug 1 21:05 aaahik.part
drwxr-x--- Aug 2 21:05 aaahmb.part
drwxr-x--- Aug 3 12:49 aaaifj.part
drwxr-x--- Aug 3 17:50 aaaima.part
drwxr-x--- Aug 3 18:46 aaaiok.part
drwxr-x--- Aug 4 18:46 aaajaf.part
drwxr-x--- Aug 5 18:46 aaajbk.part
drwxr-x--- Aug 6 18:47 aaajcj.part
drwxr-x--- Aug 7 11:33 aaajde.part
drwxr-x--- Aug 7 11:34 aaajeg.part
drwxr-x--- Aug 7 12:22 aaajeh.part
drwxr-x--- Aug 7 13:51 aaajem.part
drwxr-x--- Aug 8 09:50 aaajen.part
drwxr-x--- Aug 8 09:59 aaajfk.part
drwxr-x--- Aug 8 10:06 aaajfo.part
....
drwxr-x--- Oct 25 15:44 aadcne.part
drwxr-x--- Oct 26 06:23 aadcnp.part
drwxr-x--- Oct 26 09:54 aadcof.part
drwxr-x--- Oct 27 09:54 aadcpc.part
tladmin@lm01:/data/nas/receiver/received.default.o365-01/aadcpc.part$ ls -l
total 104
-r-------- 1824 Oct 27 09:54 col-collected_at.data.xz
-r-------- 66892 Oct 27 09:54 col-raw.data.xz
-r-------- 2076 Oct 27 09:54 col-raw.pos.xz
-r-------- 72 Oct 27 09:54 col-raw.sig
-r-------- 1864 Oct 27 09:54 col-received_at.data.xz
-r-------- 32 Oct 27 09:54 col-source-token.data.xz
-r-------- 68 Oct 27 09:54 col-source-token.pos.xz
-r-------- 68 Oct 27 09:54 col-source.data.xz
-r-------- 496 Oct 27 09:54 signing-cert.der.xz
-r-------- 1299 Oct 27 09:54 summary.yaml
Forwarding to Kafka
If the Apache Kafka is configured in the configuration, every received log event is forwarded by LogMan.io Receiver to Kafka topic. The topic is created automatically, when the first message is forwarded.
The name of the Apache Kafka topic is derived from the stream name: received.<tenant>.<stream>, it is the same as the name in the archive.
Example of Kafka topics
received.mytenant.udp-8889
received.mytenant.tcp-7781
The raw log event is sent in the Kafka message body.
Following information is added to a message header:
row_id: Row Id, the globally unique identifier of the event in the archive. Not present if the archive is disabled. 64bit binary big endian unsigned integer.collected_at: The event collection date&time, Unix timestamp in microseconds as a string.received_at: The event receival date&time, Unix timestamp in microseconds as a string.source: The event source, string.tenant: The name of the tenant which received this message, string. (OBSOLETE)
Roadmap
Automated setup of the Kafka topic (such as number of Kafka partitions) will be implemented in the future releases.
NGINX configuration
We recommend to use a dedicated virtual server in the NGINX for LogMan.io Receiver respectively communication links from LogMan.io Collector to the LogMan.io Receiver.
This server shares the NGINX server process and the IP address and it is operated on the dedicated DNS domain, different to the LogMan.io Web UI.
For example, the LogMan.io Web UI runs on http://logman.example.com/ and the receiver is available at https://recv.logman.example.com/.
In this example logman.example.com and recv.logman.example.com can resolve to the same IP address(es).
Multiple NGINX servers can be configured on different cluster nodes to handle incoming connections from collectors, sharing the same DNS name. We recommend to implement this option for high availability clusters.
upstream lmio-receiver-upstream {
server 127.0.0.1:3080; # (1)
server node-2:3080 backup; # (2)
server node-3:3080 backup;
}
server {
listen 443 ssl; # (3)
server_name recv.logman.example.com;
ssl_certificate recv-cert.pem; # (4)
ssl_certificate_key recv-key.pem;
ssl_client_certificate conf.d/receiver/client-ca-cert.pem; # (5)
ssl_verify_client optional;
ssl_session_timeout 1d;
ssl_session_cache shared:SSL:50m;
ssl_session_tickets off;
ssl_protocols TLSv1 TLSv1.1 TLSv1.2;
ssl_ciphers 'EECDH+AESGCM:EECDH+AES:AES256+EECDH:AES256+EDH';
ssl_prefer_server_ciphers on;
ssl_stapling on;
ssl_stapling_verify on;
server_tokens off;
add_header Strict-Transport-Security "max-age=15768000; includeSubdomains; preload";
add_header X-Frame-Options DENY;
add_header X-Content-Type-Options nosniff;
location / { # (8)
proxy_pass http://lmio-receiver-upstream;
proxy_http_version 1.1;
proxy_set_header Upgrade $http_upgrade;
proxy_set_header Connection "Upgrade";
proxy_set_header Host $host;
proxy_set_header X-SSL-Verify $ssl_client_verify; # (6)
proxy_set_header X-SSL-Cert $ssl_client_escaped_cert;
client_max_body_size 500M; # (7)
proxy_set_header X-Forwarded-For $proxy_add_x_forwarded_for;
}
}
-
Points to a locally running
lmio-receiver, public Web API port. This is a primary destination since it saves a network traffic. -
Backup links to receivers run on other cluster nodes that runs
lmio-receiver,node-2andnode-3in this example. Backups will be used when the locally running instance is not available. In the single node installation, skip these entries completely. -
This is a dedicated HTTPS server running on https://recv.logman.example.com.
-
You need to provide SSL server key and certificate. You can use a self-signed certificate or a certificate provide by a Certificate Authority.
-
The certificate
client-ca-cert.pemis automatically created by thelmio-receiver. See "Client CA certificate" section. -
This verifies the SSL certificate of the client (
lmio-collector) and pass that info tolmio-receiver. -
lmio-collectormay upload chunks of buffered logs. -
A URL location path where the
lmio-collectorAPI is exposed.
Verify the SSL web server
After NGINX configuration is completed, always verify the SSL configuration quality using ie. Qualsys SSL Server test. You should get "A+" overall rating.
OpenSSL command for generating self-signed server certificate
openssl req -x509 -newkey ec -pkeyopt ec_paramgen_curve:secp384r1 \
-keyout recv-key.pem -out recv-cert.pem -sha256 -days 380 -nodes \
-subj "/CN=recv.logman.example.com" \
-addext "subjectAltName=DNS:recv.logman.example.com"
This command generates a self-signed certificate using elliptic curve cryptography with the secp384r1 curve.
The certificate is valid for 380 days and includes a SAN extension to specify the hostname recv.logman.example.com.
The private key and the certificate are saved to recv-key.pem and recv-cert.pem, respectively.
Client CA certificate
The NGINX needs a client-ca-cert.pem file for ssl_client_certificate option.
This file is generated by the lmio-receiver during the first launch, it is the export of the client CA certificate from the Zookeeper from lmio/receiver/ca/cert.der.
For this reason lmio-receiver needs to be started before this NGINX virtual server configuration is created.
The lmio-receiver generates this file into ./var/ca/client-ca-cert.pem folder.
docker-compose.yaml
lmio-receiver:
image: docker.teskalabs.com/lmio/lmio-receiver
volumes:
- ./nginx/conf.d/receiver:/app/lmio-receiver/var/ca
...
nginx:
volumes:
- ./nginx/conf.d:/etc/nginx/conf.d
...
Single DNS domain
The lmio-receiver can be alternativelly collocated on the same domain and port with the LogMan.io Web IU.
In this case, the lmio-receiver API is exposed on the subpath: http://logman.example.com/lmio-receiver
Snipplet from the NGINX configuration for "logman.example.com" HTTPS server.
upstream lmio-receiver-upstream {
server 127.0.0.1:3080;
server node-2:3080 backup;
server node-3:3080 backup;
}
...
server {
listen 443 ssl;
server_name logman.example.com;
...
ssl_client_certificate conf.d/receiver/client-ca-cert.pem;
ssl_verify_client optional;
...
location /lmio-receiver {
rewrite ^/lmio-receiver/(.*) /$1 break;
proxy_pass http://lmio-receiver-upstream;
proxy_http_version 1.1;
proxy_set_header Upgrade $http_upgrade;
proxy_set_header Connection "Upgrade";
proxy_set_header Host $host;
proxy_set_header X-SSL-Verify $ssl_client_verify;
proxy_set_header X-SSL-Cert $ssl_client_escaped_cert;
client_max_body_size 500M;
proxy_set_header X-Forwarded-For $proxy_add_x_forwarded_for;
}
}
In this case, the lmio-collector CommLink setup must be:
connection:CommLink:commlink:
url: https://logman.example.com/lmio-receiver/
...
Load balancing and high availability
Load balancing is configured by the upstream section of the NGINX configuration.
upstream lmio-receiver-upstream {
server node-1:3080;
server node-2:3080 backup;
server node-3:3080 backup;
}
The collector connects to a receiver via NGINX using a long-lasting WebSocket connection (Commlink). The NGINX will first try to forward the incoming connection to "node-1". If that fails, it tries to forward to one of the backups: "node-2" or "node-3". The "node-1" is preferably "localhost" so the network traffic is limited, but it can be reconfigured otherwise.
Because the WebSocket connection is persistent, the web socket stays connected to the "backup" server even if the primary server becomes online again. The collector will reconnect "on housekeeping" (daily, during the night) to resume proper balancing.
This mechanism also provides the high availability feature of the installation. When the NGINX or receiver instance is down, collectors will connect to another NGINX instance, and that instance will forward these connections to available receivers.
DNS round-robin balancing is recommended for distributing the incoming web traffic across available NGINX instances. Ensure that the DNS TTL value of related entries (A, AAAA, CNAME) is set to a low value, such as 1 minute.
Receiver internals
Architecture
Commlink
MessagePack used for log/event delivery both in instant and syncback delivery.
The CommLink is also used for a bi-directionaly delivery of JSON messages, such as collector metrics that are shipped into a InfluxDB at the central cluster.
Archive structure
- Stream: identified by Stream Name
- Partition: identified by Partition Number
- Row: identified by Row Number respectively by Row Id
- Column: identified by the name.
- Row: identified by Row Number respectively by Row Id
- Partition: identified by Partition Number
The stream is an infinite data structure divided into partitions. The partition is created and populated through the ingesting of rows. Once the partition reaches a specific size or age, it is rotated, which means the partition is closed, and a new ingesting partition is created. Once the partition is closed, it cannot be reopened and remains read-only for the rest of its lifecycle.
The partition contains rows that are further divided into columns. Column structure is fixed in one partition but can be different in other partitions in the same stream.
Archive filesystem
The stream respective partition data are stored on the filesystem in the directory that is specified by the lifecycle phase.
Content of the /data/ssd/receiver (hot phase)
+ received.mytenant.udp-8889
+ aaaaaa.part
+ summary.yaml
+ signing-cert.der
+ col-raw.data
+ col-raw.pos
+ col-raw.sig
+ col-collected_at.data
+ col-received_at.data
+ col-source.data
+ col-source-token.data
+ col-source-token.pos
+ aaaaab.part
+ summary.yaml
+ ...
+ aaaaac.part
+ summary.yaml
+ ...
+ received.mytenant.tcp-7781
...
The partition directory aaaaaa.part contains the whole data content of the partition.
The structure is the same for every phase of the lifecycle.
The file summary.yaml contains non-canonical information about the partition.
The canonical version of the information is in the Zookeeper.
The file signing-cert.der contains the SSL certificate for verification of col-*.sig digital signatures.
The signing certificate is unique for the partition.
col-*.data files contain the data for the given field.
Partition Number / part_no
Unsigned 24bit integer, range 0..16,777,216, max. 0xFF_FF_FF.
The partition number is provided by the shared counter in Zookeeper, located at /lmio/receiver/db/part.counter.
It means each partition has a unique number regardless of which stream it belongs to.
Reasoning
10[years] * 365[days-in-year] * 24[hours-in-day] * 10[safety] = 876000 partitions (5% of the max.)
The partition number is frequently displayed as a string of 6 characters, such as aaaaaa.
It is Base-16 encoded version of this integer, using abcdefghijklmnop characters.
Row Number / row_no
Position within the partition.
Unsigned 40bit unsigned integer 0xFF_FF_FF_FF_FF (range 0..1,099,511,627,775)
Reasoning
1.000.000 EPS per 24 hours * 10[safety] = 860,400,000,000
Row Id / row_id
Global 64bit unique identifier of the row within the stream.
Because the row_id is composed by the part_no, it guarantees its global uniqueness, not just within a single stream, but across all streams.
Calculation
row_id = (part_no << 24) | row_no
row_id:
+------------------------+--------------------------+
| part_no | row_no |
+------------------------+--------------------------+
Column type string
The column type string uses two types of files:
-
col-<columne name>.data: The raw byte data of the entries in the column. Each entry is sequentially added to the end of the file, hence making it append-only. As such, entries are stored without any explicit delimiters or record markers. Instead, the location of each entry is tracked in a companioncol-<columne name>.posfile. -
col-<columne name>.pos: The starting byte positions of each entry in the correspondingcol-<columne name>.datafile. Each position is stored as a 32-bit unsigned integer. The positions are stored sequentially in the order the entries are added to thecol-<columne name>.data. The Nth integer in thecol-<columne name>.posfile indicates the starting position of the Nth entry in thecol-<columne name>.datafile. The length of the Nth entry is a difference betwenn Nth integer and (N+1)th integer in thecol-<columne name>.posfile.
Sequential data access
Sequential access of data involves reading data in the order it is stored in the column files.
Below are the steps to sequentially access data:
-
Open both the
col-<column name>.posandcol-<column name>.datafiles. Read the first 32-bit integer fromcol-<column name>.pos. Initialize a current position with a value of 0. -
Read the next 32-bit integer, referred to here as the position value, from
col-<column name>.pos. Calculate the length of the data entry by subtracting the current position from the position value. After that, update the current position to the newly read position value. -
Read the data from
col-<column name>.datausing the length calculated in step 2. This length of data corresponds to the actual content of the database row. -
Repeat steps 2 and 3 to read subsequent rows. Continue this process until you reach the end of the
col-<column name>.posfile, which would indicate that all data rows have been read.
Random data access
To access the Nth row in a column, you would follow these steps:
-
Seek the
col-<column name>.posfile to the (N-1)th position or to 0 if N == 0. Each position corresponds to a 32-bit integer, so the Nth position corresponds to the Nth 32-bit integer. For example, to get to the 6th row, you would seek to the 5th integer (20 bytes from the start, because each integer is 4 bytes). -
Read one or two 32-bit integers from the
col-<column name>.posfile. If N == 0, read only one integer, the position is assumed to be 0. The first integer indicates the start position of the desired entry in thecol-<column name>.datafile. For N > 0, read two integers. The second integer indicates the start position of the next entry. The difference between the second and first integers gives the length of the desired entry. -
Seek to the position in the
col-<column name>.datafile pointed to by the first integer read in the previous step. -
Read the entry from the
col-<column name>.datafile using the calculated length from step 2.
Column type timestamp
The column type timestamp uses one type of file: col-<column name>.data.
Each entry in this column is a 64-bit Unix timestamp representing a date and time in microsecond precision.
Info
The Unix timestamp is a way to track time as a running total of seconds that have elapsed since 1970-01-01 00:00:00 UTC, not counting leap seconds.
The microsecond precision allows tracking time even more accurately.
The timestamp column summarizes the minumum and maximum timestamp in each partition.
The summary is is in the Zookeeper and in the summary.yaml file on the filesystem.
Sequential Data Access
Sequential access to a timestamp column involves reading each timestamp in the order they're stored:
- Open the
col-<column name>.datafile. - Read a 64-bit integer from the
col-<column name>.datafile. This integer is your Unix timestamp in microseconds. - Repeat step 2 until you reach the end of the file, which means you've read all timestamps.
- Close the file.
Random Data Access
To access a timestamp at a specific row (Nth position):
- Seek to the Nth position in the
col-<column name>.datafile. As each timestamp is a 64-bit (or 8-byte) integer, to get to the Nth timestamp, you would seek to the N * 8th byte. - Read a 64-bit integer from the
col-<column name>.datafile. This is your Unix timestamp in microseconds for the Nth row.
Column type token
A column of the type token is designed to store string data in an optimized format. It is particularly suited for scenarios where a column contains a relatively small set of distinct, repetitive values.
Instead of directly storing the actual string data, the token column type encodes each string into an integer. This encoding process is accomplished via an index that is constructed based on all unique string values within the column partition. Each unique string is assigned a unique integer identifier in this index, and these identifiers replace the original strings in the token column.
The index itself is represented by the position of the string in a pair of associated files: col-<column name>-token.data and col-<column name>-token.pos.
See string column type for more details.
This approach provides significant storage space savings and boosts query efficiency for columns with a limited set of frequently repeated values. Moreover, it allows faster comparison operations as integer comparisons are typically quicker than string comparisons.
Danger
Please note that this approach may not yield benefits if the number of unique string values is large or if the string values are mostly unique. The overhead of maintaining the index could outweigh the storage and performance advantages of using compact integer storage.
The column type token uses three types of files:
col-<column name>.data: The index of the column values, each represented as a 16-bit unsigned integer.col-<column name>-token.data&col-<column name>-token.pos: The index, using the same structure as the string column type. The position of a string in these files represents the encoded value of the string in the token column.
Sequential Data Access
Sequential access of a token column involves reading each token in the order they are stored.
This is accomplished using the indices stored in the col-<column name>.data file and translating them into the actual string values using the col-<column name>-token.data and col-<column name>-token.pos files.
Here are the steps to sequentially access data:
- Open the
col-<column name>.datafile. This file contains 16-bit unsigned integers that serve as indices into the token string list. - Read a 16-bit unsigned integer from the
col-<column name>.data file. This is the index of your token string. - Apply the "Random data access" from string column type on
ol-<column name>-token.dataandcol-<column name>-token.posfiles to fetch the string value. - Repeat steps 2 and 3 until you reach the end of the col-
.data file, which indicates that all tokens have been read. - Close all files.
Random Data Access
Random access in a token column allows you to retrieve any entry without needing to traverse the previous entries. This can be particularly beneficial in scenarios where you only need to fetch certain specific entries and not the entire data set.
To access a token at a specific row (Nth position):
- Seek to the Nth position in the
col-<column name>.datafile. As each index entry is a 16-bit (or 2-byte) integer, to get to the Nth entry, you would seek to the N * 2nd byte. - Read a 16-bit integer from the
col-<column name>.datafile. This is your index entry for the Nth row. - Apply the "Random data access" from string column type on
col-<column name>-token.dataandcol-<column name>-token.posfiles to fetch the string value.
Column type token:rle
A column of the type token:rle extends the token column type by adding Run-Length Encoding (RLE) to further optimize storage. This type is particularly suitable for columns that have many sequences of repeated values.
Like the token type, token:rle encodes string values into integer tokens. However, instead of storing each of these integer tokens separately, it utilizes Run-Length Encoding to compress sequences of repeated tokens into a pair of values: the token itself and the number of times it repeats consecutively.
The RLE compression is applied to the col-<column name>.data file, turning a sequence of identical token indices into a pair: (token index, repeat count).
This approach provides significant storage savings for columns where values repeat in long sequences. It also allows faster data access and query execution by reducing the amount of data to be read from disk.
Danger
Keep in mind that this approach will not yield benefits if the data doesn't contain long sequences of repeated values. In fact, it may lead to increased storage usage and slower query execution as the overhead of maintaining and processing RLE pairs might outweigh the compression benefits.
The token:rle column type uses the same three types of files as the token type:
-
col-<column name>.data: RLE compressed indices of the column values, each entry as a pair: (16-bit unsigned integer token index, 16-bit unsigned integer repeat count). -
col-<column name>-token.data&col-<column name>-token.pos: Te index, using the same structure as the string column type. The position of a string in these files represents the encoded value of the string in the token column.
Sequential data access
Sequential access of a token:rle column involves reading each RLE-compressed token pair in the order they are stored.
This is accomplished using the indices stored in the col-<column name>.data file and translating them into actual string values using col-<column name>-token.data and col-<column name>-token.pos files.
Here are the steps to sequentially access data:
- Open the
col-<column name>.datafile. This file contains pairs of 16-bit unsigned integers representing the token index and the run length. - Read a pair of 16-bit unsigned integers from the
col-<column name>.datafile. The first integer is the index of your token string, and the second integer indicates how many times this token repeats consecutively (run length). - Use the token index to locate the string in the
col-<column name>-token.dataandcol-<column name>-token.posfiles, following the process described for the string column type (Random Data Access). - Repeat the value from step 3 as many times as indicated by the run length.
- Repeat steps 2 to 4 until you reach the end of the
col-<column name>.datafile, which indicates that all tokens have been read. - Close all files.
Random data access
To access a token at a specific row (Nth position):
- Open the
col-<column name>.datafile. This file contains pairs of 16-bit unsigned integers that serve as indices into the token string list and their corresponding run lengths. - Traverse the
col-<column name>.datafile pair by pair, summing the run lengths until the sum equals or exceeds N. The pair at which this occurs corresponds to the token that you are looking for. - Read the 16-bit integer token index from this pair.
- Apply the "Random data access" from string column type on
col-<column name>-token.dataandcol-<column name>-token.posfiles to fetch the string value.
Parsec
LogMan.io Parsec
TeskaLabs LogMan.io Parsec is a microservice responsible for parsing logs from different Kafka topics. LogMan.io Parsec puts logs into a single EVENTS Kafka topic if parsing succeeds, and into an OTHERS Kafka topic if parsing fails.
Parsing is the process of analyzing the original log (which is typically in single/multiple-line string, JSON, or XML format) and transforming it into a list of key-value pairs that describe the log data (such as when the original event happened, the priority and severity of the log, information about the process that created the log, etc).
Note
LogMan.io Parsec replaces LogMan.io Parser.
A simple parsing example
Parsing takes a raw log, such as this:
<30>2023:12:04-15:33:59 hostname3 ulogd[1620]: id="2001" severity="info" sys="SecureNet" sub="packetfilter" name="Packet dropped" action="drop" fwrule="60002" initf="eth2.3009" outitf="eth6" srcmac="e0:63:da:73:bb:3e" dstmac="7c:5a:1c:4c:da:0a" srcip="172.60.91.60" dstip="192.168.99.121" proto="17" length="168" tos="0x00" prec="0x00" ttl="63" srcport="47100" dstport="12017"
@timestamp: 2023-12-04 15:33:59.033
destination.ip: 192.168.99.121
destination.mac: 7c:5a:1c:4c:da:0a
destination.port: 12017
device.model.identifier: SG230
dns.answers.ttl 63
event.action: Packet dropped
event.created: 2023-12-04 15:33:59.033
event.dataset: sophos
event.id: 2001
event.ingested: 2023-12-04 15:39:10.039
event.original: <30>2023:12:04-15:33:59 hostname3 ulogd[1620]: id="2001" severity="info" sys="SecureNet" sub="packetfilter" name="Packet dropped" action="drop" fwrule="60002" initf="eth2.3009" outitf="eth6" srcmac="e0:63:da:73:bb:3e" dstmac="7c:5a:1c:4c:da:0a" srcip="172.60.91.60" dstip="192.168.99.121" proto="17" length="168" tos="0x00" prec="0x00" ttl="63" srcport="47100" dstport="12017"
host.hostname: hostname3
lmio.event.source.id: hostname3
lmio.parsing: parsec
lmio.source: mirage
log.syslog.facility.code: 3
log.syslog.facility.name: daemon
log.syslog.priority: 30
log.syslog.severity.code: 6
log.syslog.severity.name: information
message id="2001" severity="info" sys="SecureNet" sub="packetfilter" name="Packet dropped" action="drop" fwrule="60002" initf="eth2.3009" outitf="eth6" srcmac="e0:63:da:73:bb:3e" dstmac="7c:5a:1c:4c:da:0a" srcip="172.60.91.60" dstip="192.168.99.121" proto="17" length="168" tos="0x00" prec="0x00" ttl="63" srcport="47100" dstport="12017"
observer.egress.interface.name: eth6
observer.ingress.interface.name: eth2.3009
process.name: ulogd
process.pid: 1620
sophos.action: drop
sophos.fw.rule.id: 60002
sophos.prec: 0x00
sophos.protocol: 17
sophos.sub: packetfilter
sophos.sys: SecureNet
sophos.tos: 0x00
source.bytes: 168
source.ip: 172.60.91.60
source.mac: e0:63:da:73:bb:3e
source.port: 47100
tags: lmio-parsec:v23.47
tenant: default
_id: e1a92529bab1f20e43ac8d6caf90aff49c782b3d6585e6f63ea7c9346c85a6f7
_prev_id: 10cc320c9796d024e8a6c7e90fd3ccaf31c661cf893b6633cb2868774c743e69
_s: DKNA
LogMan.io Parsec Configuration
LogMan.io Parsec dependencies:
- Apache Kafka: The source of input unparsed events and the destination of parsed events.
- Apache Zookeeper: The library content, mainly parsing rules but also other shared cluster information.
Minimal configuration with event lane
LogMan.io Parsec can be configured both with or without event lane. We recommend to use the first option.
When event lane is used, LogMan.io Parsec reads Kafka topics, path for parsing rules and optionally charset, schema and timezone from it.
This is the minimal configuration for LogMan.io Parsec with event lane:
[tenant]
name=<tenant> # (1)
[eventlane]
name=/EventLanes/<tenant>/<eventlane>.yaml #(2)
[library]
providers=
zk:///library
...
[kafka]
bootstrap_servers=kafka-1:9092,kafka-2:9092,kafka-3:9092 # (3)
[zookeeper]
servers=zookeeper-1:2181,zookeeper-2:2181,zookeeper-3:2181 # (4)
- Name of the tenant under which the service is running.
- Name of the event lane used for Kafka topics, path for parsing rules and optionally charset, schema and timezone.
- Addresses of Kafka servers in the cluster
- Addresses of Zookeeper servers in the cluster
Apache Zookeeper
Every LogMan.io microservice should advertise itself into Zookeeper.
[zookeeper]
servers=zookeeper-1:2181,zookeeper-2:2181,zookeeper-3:2181
Library
The library configuration specifies from where the Parsec declarations (definitions) are loaded.
The library can consist of one or multiple providers, typically Zookeeper or git repositories.
[library]
providers=
zk:///library
# other library layers can be included
Note
The order of layers is important. Higher layers overwrite the layers beneath them. If one file is present in multiple layers, only the one included in the highest layer is loaded.
Apache Kafka
The connection to Apache Kafka has to be configured so that events can be received from and sent to Apache Kafka:
[kafka]
bootstrap_servers=kafka-1:9092,kafka-2:9092,kafka-3:9092
Without this configuration, connection to Apache Kafka can't be properly established.
Minimal configuration without event lane
When event lane is NOT used, parsing rules, timezone and schema must be included in the configuration.
This is the configuration required for LogMan.io Parsec when event lane is not used:
[pipeline:ParsecPipeline:KafkaSource]
topic=received.<tenant>.<stream> # (1)
[pipeline:ParsecPipeline:KafkaSink]
topic=events.<tenant>.<stream> # (2)
[pipeline:ErrorPipeline:KafkaSink]
topic=others.<tenant> # (3)
[tenant]
name=<tenant> # (5)
schema=/Schemas/ECS.yaml # (6)
[parser]
name=/Parsers/<parsing rule> # (4)
[library]
providers=
zk:///library
...
[kafka]
bootstrap_servers=kafka-1:9092,kafka-2:9092,kafka-3:9092 # (7)
[zookeeper]
servers=zookeeper-1:2181,zookeeper-2:2181,zookeeper-3:2181 # (8)
- Name of the received topic from which events are consumed.
- Name of the events topic to which successfully parsed events committed.
- Name of the others topic to which unsuccessfully parsed events committed.
- Specify the parsing rule to apply.
- Name of the tenant under which this instance of Parsec is running.
- Schema should be stored in
/Schemas/folder in Library. - Addresses of Kafka servers in the cluster
- Addresses of Zookeeper servers in the cluster
Parsing rule
Each parsec must know what parsing rule to apply.
[parser]
name=/Parsers/<parsing rule>
The name of the parser specifies the path from which the parsing rule declarations are loaded.
It MUST BE stored in /Parsers/ directory.
Parsing rules are YAML files.
The standard path format is <vendor>/<type>, e.g. Microsoft/IIS or Oracle/Listener, but in case only one technology is used, only the name of the provider can be used, e.g. Zabbix or Devolutions.
Event lane configuration
This section optionally specifies significant attributes of the parsed events.
[eventlane]
timezone=Europe/Prague
charset=iso8859_2
timezone: If the log source produces logs in the specific timezone, different from the tenant default timezone, it has to be specified here.
The name of the timezone must be compliant with IANA Time Zone Database. Internally, all timestamps are converted into UTC.
charset: If the log source produces logs in the charset (or encoding) different from UTF-8, the charset must be specified here.
The list of supported charset is here.
Internally, every text is encoded in UTF-8.
Kafka topics
The specification of the topic from which original logs come and the topics where successfully parsed and unsuccessfully parsed logs are sent.
The recommended way of choosing topics is to create one 'received' and one 'events' topic for each event lane, one 'others' topic for each tenant.
[pipeline:ParsecPipeline:KafkaSource]
topic=received.<tenant>.<stream>
[pipeline:ParsecPipeline:KafkaSink]
topic=events.<tenant>.<stream>
[pipeline:ErrorPipeline:KafkaSink]
topic=events.<tenant>
Warning
The pipeline name ParsecPipeline was introduced in Parsec version v23.37. The name KafkaParserPipeline used in previous versions is deprecated. End of service life is 30 January, 2024.
Kafka Consumer Group
LogMan.io Parsec is often running in multiple instances in cluster. The set of instances which consume from the same received topic is called Consumer group. This group is identified by a unique group.id. Each event is being consumed by one and only one members of the group.
LogMan.io Parsec creates group.id automatically as follows:
- When event lane is used,
group.idhas the formlmio-parsec-<tenant>-<eventlane>. - When event lane is not used,
group.idhas the formlmio-parsec-<tenant>-<parser name>. group.idcan be overwritten inParsecPipelineconfiguration as follows:
[pipeline:ParsecPipeline:KafkaSource]
group_id=lmio-parsec-<stream>
Warning
By changing group.id, a new consumer group will be created and begin to read events from the start. (This depends on auto.offset.reset parameter of Kafka cluster, which is by default earliest.)
Metrics
Parsec produces own telemetry for monitoring and also forwards the telemetry from collectors to the configured telemetry data storage, such as InfluxDB. Read more about metrics.
Include in configuration:
[asab:metrics]
...
Event Lanes
Relation to LogMan.io Parsec
TeskaLabs LogMan.io Parsec reads important part of its configuration from event lane. This configuration covers:
- Kafka topics from which events are taken and to which topics parsed and error events are sent
- parsing rules (declarations)
- (optionally) timezone, charset and schema
group.idfor consuming fromreceivedtopic
Therefore, each instance of LogMan.io Parsec runs under exactly one eventlane (under exactly one tenant).
Note
Reading the configuration from event lanes was introduced in version v24.14.
Declaration
This is the minimal required event lane definition, located in the /EventLanes/<tenant> directory in the Library:
---
define:
type: lmio/event-lane
parsec:
name: /Parsers/path/to/parser # (1)
kafka:
received:
topic: received.tenant.stream
events:
topic: events.tenant.stream
others:
topic: others.tenant
- Path for the parsing rule. It must start with
/Parsers. The standard path format is<vendor>/<type>, e.g.Microsoft/IISorOracle/Listener, but in case only one technology is used, only the name of the provider can be used, e.g.ZabbixorDevolutions.
When Parsec is started and the event lane is loaded, two pipelines are created:
ParsecPipelinebetween received and events topicErrorPipelinetargeting to others topic
group.id used for consuming from received topic has the form: lmio-parsec-<tenant>-<eventlane>
Timezone, schema, charset
Timezone, schema and charset are read from the tenant configuration by default, but these properties can be overwritten in event lane:
---
define:
type: lmio/event-lane
timezone: UTC
charset: utf-16
schema: /Schemas/CEF.yaml
timezone: If the log source produces logs in the specific timezone, different from the tenant default timezone, it has to be specified here.
The name of the timezone must be compliant with IANA Time Zone Database. Internally, all timestamps are converted into UTC.
charset: If the log source produces logs in the charset (or encoding) different from UTF-8, the charset must be specified here.
The list of supported charset is here.
Internally, every text is encoded in UTF-8.
Output of parsing
When you use LogMan.io Parsec to analyze logs, the result of this process is what we refer to as the "parsed event." This output is an essential aspect of log management, as it transforms raw log data into a structured format that is easier to understand, analyze, and act upon.
A parsed event is not just any collection of data; it is a meticulously structured output that presents the information in a flat list format. This means that each piece of information from the original log is extracted and presented as key-value pairs. These pairs are straightforward, making it easy to identify what each piece of data represents.
Key-Value Pairs
-
Key: This is a unique identifier that describes the type of information contained in the value. Keys are predefined labels that represent specific aspects of the log data, such as time stamps, error codes, user IDs, and so on. Keys are defined by the schema.
-
Value: This is the actual data or information associated with the key. Values can vary widely, from numerical codes and timestamps to textual descriptions or user inputs. The type of the value is defined in the schema.
The output event is typically serialized as JSON object.
Example of parsed event
{
"@timestamp": 12345678901,
"event.created": 12345678902,
"event.ingested": 12345678903,
"event.original": "<1> 2023-03-01 myhost myapp: Hello world!",
"key1": "value1",
"key2": "value2",
}
Common fields of parsed events
Warning
This chapter uses ECS schema!
From the parsec (implicit):
@timestamp: If timestamp is not parsed, this field is automatically created with the time of parsing.
From the collector:
event.original: The original event in its raw format.event.created: The time when the event was collected by a LogMan.io Collector.lmio.source: The name of the log source (created by LogMan.io Collector).
From the receiver:
event.ingested: The time when the event was ingested to LogMan.io Receiver.tenant: The name of the LogMan.io tenant in which the Parsec processing that event, as specified in configuration._id: Unique identifier of the event.
Tags
Roadmap
There will be an option to add arbitrary tags to the event which will enable custom filtering.
At this time, the only tag that is automatically added to the tags field is the version of the LogMan.io Parsec.
Error events
When parsing fails or an unexpected error occurs, the event is sent to others event lane (ErrorPipeline),
where it is enriched with the information about when and why it happened.
Every error event contains:
@timestamp: The time when the event was processed with failure in UNIX timestamp (number of seconds from epoch).event.original: The original event in its raw format.error.message: The error message.error.stack_trace: The data about where in the code the exception happened.event.dataset: The name of the dataset specified in mapping or the path for the parser in the Library.event.created: The time when the event was created in LogMan.io Collector.event.ingested: The time when the event was ingested to LogMan.io Receiver.tenant: The name of the tenant this event was aimed for.
Parsing rules
Declarations
Declarations describe how the event should be parsed. They are stored as YAML files in the Library. LogMan.io Parsec interprets these declarations and creates parsing processors.
There are three types of declarations:
- Parser declaration: A parser takes an original event or a specific field of a partially parsed event as input, analyzes its individual parts, and stores them as key-value pairs to the event.
- Mapping declaration: Mapping takes a partially parsed event as input, renames the field names, and eventually converts the data types. It works together with a schema (ECS, CEF).
- Enricher declaration: An enricher supplements a partially parsed event with extra data.
Data flow
A typical, recommended parsing sequence is a chain of declarations:
- The first main parser declaration begins the chain, and additional parsers (called sub-parsers) extract more detailed data from the fields created by the previous parser.
- Then, the (single) mapping declaration renames the keys of the parsed fields according to a schema and filters out fields that are not needed.
- Last, the enricher declaration supplements the event with additional data. While it's possible to use multiple enricher files, it's recommended to use just one.
Important: Naming conventions
LogMan.io Parsec loads declarations alphabetically and creates the corresponding processors in the same order. Therefore, create the list of declaration files according to these rules:
-
Begin all declaration file names with a numbered prefix:
10_parser.yaml,20_parser_message.yaml, ...,90_enricher.yaml.It is recommended to "leave some space" in your numbering for future declarations in case you want to add a new declaration between two existing ones (e.g.,
25_new_parser.yaml). -
Include the type of declaration in file names:
20_parser_message.yamlrather than10_message.yaml. - Include the type of schema used in mapping file names:
40_mapping_ECS.yamlrather than40_mapping.yaml.
Example:
/Parsers/MyParser/:
- 10_parser.yaml
- 20_parser_username.yaml
- 30_parser_message.yaml
- 40_mapping_ECS.yaml
- 50_enricher_lookup.yaml
- 60_enricher.yaml
Parsers
A parser declaration takes an original event or a specific field of a partially parsed event as input, analyzes its individual parts, and stores them as key-value pairs to the event.
LogMan.io Parsec currently supports three types of parser declarations:
- JSON parser
- Windows Event parser
- Parsec parser
Declaration structure
In order to determine the type of the declaration, you need to specify a define section.
define:
type: <declaration_type>
For a parser declaration, specify the type as parser.
JSON parser
JSON parser is used for parsing events (or events parts) with a JSON structure.
define:
name: JSON parser
type: parser/json
field: <custom_field>
target: <custom_target>
When field is specified, parsing is applied to that field; by default, it is applied to the original event.
When target is specified, the parsed object is stored in the designated target field; by default, it is stored with json key. The custom target field must adhere to the regular expression json[0-9a-zA-Z] (beginning with "json" followed by any alphanumeric character).
Example
-
The following original event with a JSON structure is parsed by the JSON parser with the default settings:
{ "key": { "foo": 1, "bar": 2 } }10_parser.yamldefine: name: JSON parser type: parser/jsonThe result event will be:
{ "json": <JSON object>, } -
The following event includes JSON part inside, so JSON parser can be applied on this preparsed field and the result will be stored in the custom
jsonMessagefield:<14>1 2023-05-03 15:06:12 {"key": {"foo": 1, "bar": 2}}20_parser_message.yamldefine: name: JSON parser type: parser/json field: message target: jsonMessageThe result event will be:
```json { "log.syslog.priority": 14, "@timestamp": 140994182325993472, "message": "{"key": {"foo": 1, "bar": 2}}", "jsonMessage": <JSON object> } ```
Windows Event parser
Windows Events parser is used for parsing events that are produced from Microsoft Windows. These events are in XML format.
define:
name: Windows Events Parser
type: parser/windows-event
This is a complete Windows Event parser and will parse events from Microsoft Windows, separating the fields into key-value pairs.
Parsec parser
A Parsec parser is used for parsing events in plain string format. It is based on SP-Lang Parsec expressions.
For parsing original events, use the following declaration:
define:
name: My Parser
type: parser/parsec
parse:
!PARSE.KVLIST
- ...
- ...
- ...
define:
name: My Parser
type: parser/parsec
field: <custom_field>
parse:
!PARSE.KVLIST
- ...
- ...
- ...
When field is specified, parsing is applied on that field, otherwise it is applied on the original event. Therefore, it must be present in every sub-parser.
Types of field specification:
-
field: <custom_field>- regular field pre-parsed by the previous parser. -
field: json /key/foo- JSON key/key/foofrom pre-parsed JSON objectjson. Name of the JSON object and JSON key must be separated by space. JSON key is always starts with/, and every next level is separated by/. -
JSON key with specified type, by default we assume
stringtype.
field:
json: /key/foo
type: int
Examples of Parsec parser declarations
Example 1: Simple example
For the purpose of the example, let's say that we want to parse a collection of simple events:
Hello Miroslav from Prague!
Hi Kristýna from Pilsen.
{
"name": "Miroslav",
"city": "Prague"
}
{
"name": "Kristýna",
"city": "Pilsen"
}
define:
type: parser/parsec
parse:
!PARSE.KVLIST
- !PARSE.UNTIL " "
- name: !PARSE.UNTIL " "
- !PARSE.EXACTLY "from "
- city: !PARSE.LETTERS
Example 2: More complex example
For the purpose of this example, let's say that we want to parse a collection of simple events:
Process cleaning[123] finished with code 0.
Process log-rotation finished with code 1.
Process cleaning[657] started.
And we want the output in the following format:
{
"process.name": "cleaning",
"process.pid": 123,
"event.action": "process-finished",
"return.code": 0
}
{
"process.name": "log-rotation",
"event.action": "process-finished",
"return.code": 1
}
{
"process.name": "cleaning",
"process.pid": 657,
"event.action": "process-started",
}
Declaration will be the following:
define:
type: parser/parsec
parse:
!PARSE.KVLIST
- !PARSE.UNTIL " "
- !TRY
- !PARSE.KVLIST
- process.name: !PARSE.UNTIL "["
- process.pid: !PARSE.UNTIL "]"
- !PARSE.SPACE
- !PARSE.KVLIST
- process.name: !PARSE.UNTIL " "
- !TRY
- !PARSE.KVLIST
- !PARSE.EXACTLY "started."
- event.action: "process-started"
- !PARSE.KVLIST
- !PARSE.EXACTLY "finished with code "
- event.action: "process-finished"
- return.code: !PARSE.DIGITS
Example 3: Parsing syslog events
For the purpose of the example, let's say that we want to parse a simple event in syslog format:
<189> Sep 22 10:31:39 server-abc server-check[1234]: User "harry potter" logged in from 198.20.65.68
We would like the output in the following format:
{
"PRI": 189,
"timestamp": 1695421899,
"server": "server-abc",
"process.name": "server-check",
"process.pid": 1234,
"user": "harry potter",
"action": "log-in",
"ip": "198.20.65.68"
}
We will create two parsers. First parser will parse the syslog header and the second will parse the message.
define:
name: Syslog parser
type: parser/parsec
parse:
!PARSE.KVLIST
- !PARSE.EXACTLY "<"
- PRI: !PARSE.DIGITS
- !PARSE.EXACTLY ">"
- timestamp: ...
- server: !PARSE.UNTIL " "
- process.name: !PARSE.UNTIL "["
- process.pid: !PARSE.UNTIL "]"
- !PARSE.EXACTLY ":"
- message: !PARSE.CHARS
This parser
define:
type: parser/parsec
field: message
drop: yes
parse:
!PARSE.KVLIST
- !PARSE.UNTIL " "
- user: !PARSE.BETWEEN { what: '"' }
- !PARSE.EXACTLY " "
- !PARSE.UNTIL " "
- !PARSE.UNTIL " "
- !PARSE.UNTIL " "
- ip: !PARSE.CHARS
Example 4: Parsing JSON events
For the purpose of the example, let's say that we want to parse a JSON event:
{
"data": {
"action": "allow",
"backendStatusCode": "200",
"clientAddr": "89.183.114.162",
"countryCode": "cz",
"host": "www.praha.cz",
"response": {
"backendTime": "0.043",
"code": "200",
},
},
"time": "2024-03-03T01:15:03.480Z",
}
We will create two parsers. First parser will parse the original event and store it as JSON object in json field.
define:
type: parser/json
{
"json": <JSON object>
}
Next parser will parse /time field from the JSON object.
define:
type: parser/parsec
field: json /time
parse:
!PARSE.KVLIST
- "@timestamp": !PARSE.DATETIME
- year: !PARSE.DIGITS
- '-'
- month: !PARSE.MONTH "number"
- '-'
- day: !PARSE.DIGITS
- 'T'
- hour: !PARSE.DIGITS
- ':'
- minute: !PARSE.DIGITS
- ':'
- second: !PARSE.DIGITS
- microsecond: !PARSE.FRAC
base: "micro"
Result event will be:
{
"json": <JSON object>,
"@timestamp": 140994182325993472,
}
Mapping
After all declared fields are obtained from parsers, the fields typically have to be renamed according to some schema (ECS, CEF) in a process called mapping.
Why is mapping necessary?
To store event data in Elasticsearch, it's essential that the field names in the logs align with the Elastic Common Schema (ECS), a standardized, open-source collection of field names that are compatible with Elasticsearch. The mapping process renames the fields of the parsed logs according to this schema. Mapping ensures that logs from various sources have unified, consistent field names, which enables Elasticsearch to interpret them accurately.
Important
By default, mapping works as a filter. Make sure to include all fields you want in the parsed output in the mapping declaration. Any field not specified in mapping will be removed from the event.
Writing a mapping declaration
Write mapping delcarations in YAML. (Mapping declarations do not use SP-Lang expressions.)
define:
type: parser/mapping
schema: /Schemas/ECS.yaml
mapping:
<original_key>: <new_key>
<original_key>: <new_key>
...
Specify parser/mapping as the type in the define section. In the schema field, specify the filepath to the schema you're using. If you use Elasticsearch, use the Elastic Common Schema (ECS).
Standard mapping
To rename the key and change the data type of the value:
Warning
New data type must respond to the data type specified in the schema for this field.
By specifying type: auto, the data type will be automatically determined from the schema based of field name.
mapping:
<original_key>:
field: <new_key>
type: <new_type>
Find available data types here.
To rename the key and modify the value:
mapping:
<original_key>:
field: <new_key>
apply: <new_type>
apply function, you need to specify the type of the parsed value and the argument name VALUE.
mapping:
<original_key>:
field: <new_key>
value_type: <type>
apply: <new_type>
Example
Modifying a string value to an IP value using the PARSE.IP expression and renaming it to a new key:
'json /client-ip':
field: client.ip
apply: !PARSE.IP
Modifying a string value to lowercase and renaming it to a new key:
Specify the initial value type and use it as the argument VALUE in the apply function.
'json /client-hostname':
field: client.address
value_type: str
apply: !LOWER
what: !ARG VALUE
To rename the key without changing the data type of the value:
mapping:
<original_key>: <new_key>
Mapping from JSON
To rename the key stored in JSON object:
mapping:
<jsonObject> <jsonPointer>: <new_key>
/, and each subsequent level is separated by /.
To rename the key stored in JSON object with specific key-value pair:
mapping:
<jsonObject> <jsonPointer/[key:value]/jsonPointer>: <new_key>
Name of the JSON object and JSON pointer must be separated by a space. JSON pointer always starts with /, and each subsequent level is separated by /.
The specified key-value pair allows choosing the required JSON object (see example below).
To rename the key stored in JSON object and change the data type of the value:
mapping:
<jsonObject> <jsonPointer>:
field: <new_key>
type: <new_type>
As before, it is possible to change the data type by specifying the type field.
Example
Example 1: Mapping from JSON
For the purpose of the example, let's say that we want to parse a simple event in JSON format:
{
"act": "user login",
"ip": "178.2.1.20",
"usr": "harry_potter",
"id": "6514-abb6-a5f2"
}
and we would like the final output look like this:
{
"event.action": "user login",
"source.ip": "178.2.1.20",
"user.name": "harry_potter"
}
Notice that the key names in the original event differ from the key names in the desired output.
For the initial parser declaration in this case, we can use a simple JSON parser:
define:
type: parser/json
This parser will create a JSON object and will store it in json field.
To change the names of individual fields, we create this mapping delcaration file, 20_mapping_ECS.yaml, in which we describe what fields to map and how:
---
define:
type: parser/mapping # determine the type of declaration
schema: /Schemas/ECS.yaml # which schema is applied
mapping:
json /act: 'event.action'
json /ip:
field: 'source.ip'
type: auto
json /usr: 'user.name'
This declaration will produce the desired output. Data type for the source.ip field will be determined automatically based on the schema and changed accordingly.
Example 2: Mapping from JSON with specific key-value pair
Another example is a mapping for a complex event in JSON format which consists JSON object with a specific key-value pair:
{
"CreationTime": "2022-01-19T11:07:41",
"ExtendedProperties": [
{
"Name": "ResultStatusDetail",
"Value": "Redirect"
},
{
"Name": "UserAgent",
"Value": "Mozilla/5.0 (X11; Linux x86_64) AppleWebKit/537.36 (KHTML, like Gecko) MicrosoftTeams-Preview/1.4.00.26453 Chrome/85.0.4183.121 Electron/10.4.7 Safari/537.36"
},
{
"Name": "RequestType",
"Value": "OAuth2:Authorize"
}
],
}
To get a field from a JSON object that contains specific key-value pair, use the following syntax:
---
define:
type: parser/mapping # determine the type of declaration
schema: /Schemas/ECS.yaml # which schema is applied
mapping:
json /ExtendedProperties/[Name:ResultStatusDetail]/Value: 'o365.audit.ExtendedProperties.ResultStatusDetail'
json /ExtendedProperties/[Name:UserAgent]/Value: 'o365.audit.ExtendedProperties.UserAgent'
json /ExtendedProperties/[Name:RequestType]/Value: 'o365.audit.ExtendedProperties.RequestType'
Enrichers
Enrichers supplement the parsed event with extra data.
An enricher can:
- Create a new field in the event.
- Transform a field's values in some way (changing a letter case, performing a calculation, etc).
- Delete an existing field if the specified condition is met.
Enrichers are most commonly used to:
- Specify the dataset where the logs will be stored in ElasticSearch (add the field
event.dataset). - Obtain facility and severity from the syslog priority field.
define:
type: parsec/enricher
enrich:
event.dataset: <dataset_name>
new.field: <expression>
...
delete:
existing.field: <expression>
- Write enrichers in YAML.
- Specify
parsec/enricherin thedefinefield.
Note
Both enrich and delete sections are optional, but you have to use at least one of them.
Example 1: Enrich the event with new fields
The following example is enricher used for events in syslog format. Suppose you have parser for the events of the form:
<14>1 2023-05-03 15:06:12 server pid: Username 'HarryPotter' logged in.
{
"log.syslog.priority": 14,
"user.name": "HarryPotter"
}
You want to obtain syslog severity and facility, which are computed in the standard way:
(facility * 8) + severity = priority
You would also like to lower the name HarryPotter to harrypotter in order to unify the users across various log sources.
Therefore, you create an enricher:
define:
type: parsec/enricher
enrich:
event.dataset: 'dataset_name'
user.id: !LOWER { what: !GET {from: !ARG EVENT, what: user.name} }
# facility and severity are computed from 'syslog.pri' in the standard way
log.syslog.facility.code: !SHR
what: !GET { from: !ARG EVENT, what: log.syslog.priority }
by: 3
log.syslog.severity.code: !AND [ !GET {from: !ARG EVENT, what: log.syslog.priority}, 7 ]
Example 2: Delete non-suited field from the event
The following enricher deletes the host.name field from the event if its value contains the string SRV:
define:
type: parsec/enricher
delete:
host.name: !IN
what: "SRV"
where: !GET {from: !ARG EVENT, what: host.name}
Date/time fields
Handling dates and times (timestamps) is crucial when parsing events.
In order for events to be displayed in the LogMan.io application, the events must contain the @timestamp field with proper datetime and timezone.
Datetime fields, in accordance with ECS:
| Field | Meaning |
|---|---|
@timestamp |
The time when the original event occurred. Must be included in declarations. |
event.created |
The time when the original event was collected by LogMan.io Collector. |
event.ingested |
The time when the original event was received to LogMan.io Receiver. |
In normal conditions, assuming no tampering, the timestamp values should be chronological: @timestamp < event.created < event.ingested.
Usefull links and tools
- UNIX time converter
- SP-Lang date/time format: this is the output format of all parsed timestamps produced by the Parsec.
LogMan.io Parsec Key terms
Important terms relevant to LogMan.io Parsec.
Event
A unit of data that moves through the parsing process is referred to as an event. An original event comes to LogMan.io Parsec as an input and is then parsed by the processors. If parsing succeeds, it produces a parsed event, and if parsing fails, it produces an error event.
Original event
An original event is the input that LogMan.io Parsec recieves - in other words, an unparsed log. It can be represented by a raw (possibly encoded) string or structure in JSON or XML format.
Parsed event
A parsed event is the output from successful parsing, formatted as an unordered list of key-value pairs serialized into JSON structure. A parsed event always contains a unique ID, the original event, and typically the information about when the event was created by the source and received by Apache Kafka.
Error event
An error event is the output from unsuccessful parsing, formatted as an unordered list of key-value pairs serialized into JSON structure. It is produced when parsing, mapping, or enrichment fails, or when another exception occurs in LogMan.io Parsec. It always contains the original event, the information about when the event was unsuccessfully parsed, and the error message describing the reason why the process of parsing failed. Despite unsuccessful parsing, the error event will always be in JSON format, key-value pairs.
Library
Your TeskaLabs LogMan.io Library holds all of your declaration files (as well as many other types of files). You can edit your declaration files in your Library via Zookeeper.
Declarations
Declarations describe how the event will be transformed. Declarations are YAML files that LogMan.io Parsec can interpret to create declarative processors. There are three types of declarations in LogMan.io Parsec: parsers, enrichers, and mappings. See Declarations for more.
Parser
A parser is the type of declaration that takes the original event or a specific field of a partially-parsed event as input, analyzes its individual parts, and then stores them as key-value pairs to the event.
Mapping
A mapping declaration is the type of declaration that takes a partially parsed event as input, renames the field names, and eventually converts the data types. It works together with a schema (ECS, CEF). It also works as a filter to leave out data that is not needed in the final parsed event.
Enricher
An enricher is the type of declaration that supplement a partially parsed event with additional data.
Migration to Parsec with event lanes
For migrating from LogMan.io Parser or LogMan.io Parsec version less than v24.14, which does not use event lanes, use the following migration guide.
Prerequisites
- LogMan.io Depositor >
v24.11-beta - LogMan.io Baseliner >
v24.11-beta - LogMan.io Correlator >
v24.11-beta
Migration steps
-
Create new event lane YAML file
/EventLanes/<tenant>/<eventlane>.yamlin the Library. -
Add the following properties to the eventlane:
/EventLanes/tenant/eventlane.yaml--- define: type: lmio/event-lane parsec: name: /Parsers/path/to/parser kafka: received: topic: received.<tenant>.<stream> events: topic: events.<tenant>.<stream> others: topic: others.<tenant> elasticsearch: events: index: lmio-<tenant>-events-<eventlane> others: index: lmio-<tenant>-others(Replace
<tenant>,<stream>,<eventlane>and/path/to/parserwith the specific values.) -
Create configuration for LogMan.io Parsec:
lmio-parsec.conf[tenant] name=<tenant> [eventlane] name=/EventLanes/<tenant>/<eventlane>.yaml [library] providers= zk:///library ... [kafka] bootstrap_servers=kafka-1:9092,kafka-2:9092,kafka-3:9092 [zookeeper] servers=zookeeper-1:2181,zookeeper-2:2181,zookeeper-3:2181 -
Use either the old Consumer group or create a new one. First, open kafdrop, search for the corresponding
receivedtopic, see Consumers and find Group ID of the old LMIO Parser/LMIO Parsec. Decide, whether to keep the oldgroup.idor create a new one.Warning
By creating new
group.id, a new consumer group will be created and begin to read events from the start. (This depends onauto.offset.resetparameter of Kafka cluster, which is by defaultearliest.)In case you want to keep the old
group.id, add the following section to the configuration:lmio-parsec.conf[pipeline:ParsecPipeline:KafkaSource] group_id=<your group id>Otherwise,
group.idwill be automatically created based on the event lane name:lmio-parsec-<tenant>-<eventlane>. -
Start the service. Ensure it is running by looking at its logs.
You should see no error logs. If so, see troubleshooting. You should also see notice logs similar to these:
NOTICE lmioparsec.app Event Lane /EventLanes/default/linux-syslog-rfc3164-10001.yaml loaded successfully. NOTICE lmioparsec.app [sd timezone="Europe/Prague" charset="utf-8" schema="/Schemas/ECS.yaml" parser="/Parsers/Linux/Common"] Configuration loaded. NOTICE lmioparsec.declaration_loader [sd parsers="3" mappings="1" enrichers="1"] Declarations loaded. NOTICE lmioparsec.parser.pipeline [sd source_topic="received.default.linux-syslog-rfc3164-10001" events_topic="events.default.linux-syslog-rfc3164-10001" others_topic="others.default" group.id="custom-group-id"] ParsecPipeline is ready.There you should see the correct Kafka topics,
group.id,charset,schemaandtimezone. -
Ensure the service is consuming from the right topic with the group id. Open once again kafdrop and find the received topic. Check whether either the new consumer group was created or whether the Combined Lag of the old group starts decreasing.
-
Check if new messages are incoming into Kafka events topic.
events topic is not created
Check for others topic. If new messages are coming there, the parsing rule is not correct. Check once again if you are using the proper parser name in event lane:
yaml "eventlane.yaml"
parsec:
name: /Parsers/path/to/parser
If so, then parsing rules are incorrect and should be changed.
-
Check if LogMan.io Depositor is running. Open events topic and check if Depositor is consuming from it (in Combined Lag).
-
Check if messages are visible in Discover screen on LogMan.io UI.
Messages are not visible at all
If you cannot find data on Discover screen, wait for some time (cca 1-2 minutes), the process might take some time. Then, check if the proper events topic exists and whether the event lane is properly configured. If so, check if messages are not incoming with incorrect timezone by setting time range to (-1 day, +1 day).
Messages are visible in incorrect timezone
If timezone or used schema is incorrect, you can overwrite it inside event lane:
```yaml title="/EventLanes/<tenant>/<eventlane>.yaml"
define:
type: lmio/event-lane
timezone: UTC
schema: /Schemas/ECS.yaml
```
Troubleshooting for LogMan.io Parsec
Timezone
Critical Logs
CRITICAL lmio-parsec.app Missing 'zookeeper' section in configuration.
Add the [zookeeper] section in configuration:
[zookeeper]
servers=zookeeper-1:2181,zookeeper-2:2181,zookeeper-3:2181
CRITICAL lmioparsec.app Missing configuration option '[tenant] name'.
Add tenant name to the configuration:
[tenant]
name=my-tenant
CRITICAL lmioparsec.app Configuration option '[eventlane] name' must start with '/EventLanes/'.
Modify event lane name so it starts with /EventLanes:
[eventlane]
name=/EventLanes/<tenant>/<eventlane>.yaml
CRITICAL lmioparsec.app Configuration option '[parser] name' must start with '/Parsers/'.
Make sure that path for parsing rules starts with /Parsers.
define:
type: lmio/event-lane
parsec:
name: /Parsers/path/to/parsers
CRITICAL lmioparsec.app Cannot find file '/EventLanes/tenant/eventlane.yaml' in Library, exiting.
Make sure that the file /EventLanes/tenant/eventlane.yaml exists and its enabled for given tenant.
CRITICAL lmioparsec.app Cannot read '/EventLanes/tenant/eventlane.yaml' declaration: <error description>, exiting.
There is a syntax error in /EventLanes/tenant/eventlane.yaml file. Try to correct it inspired by the error description.
Error Logs
ERROR: lmioparsec.declaration_loader Cannot construct pipeline: no declarations found.
Make sure you have configured the proper path for parsing rules in event lane file.
Warning Logs
WARNING lmioparsec.declaration_loader Missing 'schema' section in /Parsers/Linux/Common/50_enricher.yaml
Every enricher rule that stands behind mapping should contain schema in define section:
define:
type: parser/enricher
schema: /Schemas/ECS.yaml
Parser
Cascade Parser
Example
---
define:
name: Syslog RFC5424
type: parser/cascade
field_alias: field_alias.default
encoding: utf-8 # none, ascii, utf-8 ... (default: utf-8)
target: parsed # optional, specify the target of the parsed event (default: parsed)
predicate:
!AND
- !CONTAINS
what: !EVENT
substring: 'ASA'
- !INCLUDE predicate_filter
parse:
!REGEX.PARSE
what: !EVENT
regex: '^(\w{1,3}\s+\d+\s\d+:\d+:\d+)\s(?:(\d{1,3}\.\d{1,3}\.\d{1,3}\.\d{1,3})|([^\s]+))\s%ASA-\d+-(.*)$'
items:
- rt:
!DATETIME.PARSE
value: !ARG
format: '%b %d %H:%M:%S'
flags: Y
- dvchost
Section define
This section contains the common definition and meta data.
Item name
Shorter human-readable name of this declaration.
Item type
The type of this declaration, must be parser/cascade.
Item field_alias
Name of the field alias lookup to be loaded, so that alias names of event attributes can be used in the declaration alongside their canonical names.
Item encoding
Encoding of the incoming event.
Item target (optional)
Default target pipeline of the parsed event, unless specified differently in context.
The options include: parsed, lookup, unparsed
Item description (optional)
Longed, possibly multiline, human-readable description of the declaration.
Section predicate (optional)
The predicate filters incoming events using an expression.
If the expression returns True, the event will enter parse section.
If the expression returns False, then the event is skipped.
Other returned values are undefined.
This section can be used to speed-up parsing by skipping lines with obviously non-relevant content.
Include of nested predicate filters
Predicate filters are expressions located in a dedicated file, that can be included in many different predicates as their parts.
If you want to include an external predicate filter, located either in include or filters folder
(this one is a global folder located at the top hierarchy of the LogMan.io library),
use !INCLUDE statement:
!INCLUDE predicate_filter
where predicate_filter is the name of the file plus .yaml extension.
The content of predicate_filter.yaml is an expression to be included, like:
---
!EQ
- !ITEM EVENT category
- "MyEventCategory"
Section parse
This section specifies the actual parsing mechanism.
It expects a dictionary to be returned or None, which means that the parsing was not successful.
Typical statements in parse section
!FIRST statement allows to specify a list of parsing declarations, which will be evaluated in the order (top-down), the first declaration which returns non-None value stops the iteration and this value is returned.
!REGEX.PARSE statement allows to transform the log line into a dictionary structure. It also allows to attach sub-parsers to further decompose substrings.
Output routing
To indicate that the parser will not parse the event it received so far,
an attribute target needs to be set to unparsed within the context.
Then, other parsers in the pipeline may receive and parse the event.
In the same way, the target can be set to different destination groups,
such as parsed.
To set the target in the context, the !CONTEXT.SET is used:
- !CONTEXT.SET
what: <... expression ...>
set:
target: unparsed
Example of use in the parser. If no regex matches the incoming event,
event is posted to unparsed target, so other parsers in the row
may process it.
!FIRST
- !REGEX.PARSE
what: !EVENT
regex: '^(one)\s(two)\s(three)$'
items:
- one
- two
- three
- !REGEX.PARSE
what: !EVENT
regex: '^(uno)\s(duo)\s(tres)$'
items:
- one
- two
- three
# This is where the handling of partially parsed event starts
- !CONTEXT.SET
set:
target: unparsed
- !DICT
set:
unparsed: !EVENT
Complex Event Parser
Complex Event Parser parses incoming complex events such as lookup events
(i. e. create, update, delete of a lookup) and puts them into lmio-output topic
in Kafka.
From there, the parsed complex events are also posted to input topic
by LogMan.io Watcher instances, so that correlators and dispatchers
may react to the events as well.
Sample declaration
The sample YAML declaration for lookup events in Complex Event Parser may look as follows:
p00_json_preprocessor.yaml
---
define:
name: Preprocessor for JSON with tenant extraction
type: parser/preprocessor
tenant: JSON.tenant
function: lmiopar.preprocessor.JSON
p01_lookup_event_parser.yaml
---
define:
name: Lookup Event Parser
type: parser/cascade
predicate:
!AND
- !ISNOT
- !ITEM CONTEXT JSON.lookup_id
- !!null
- !ISNOT
- !ITEM CONTEXT JSON.action
- !!null
parse:
!DICT
set:
"@timestamp": !ITEM CONTEXT "JSON.@timestamp"
end: !ITEM CONTEXT "JSON.@timestamp"
deviceVendor: TeskaLabs
deviceProduct: LogMan.io
dvc: 172.22.0.12
dvchost: lm1
deviceEventClassId: lookup:001
name: !ITEM CONTEXT JSON.action
fname: !ITEM CONTEXT JSON.lookup_id
fileType: lookup
categoryObject: /Host/Application
categoryBehavior: /Modify/Configuration
categoryOutcome: /Success
categoryDeviceGroup: /Application
type: Base
tenant: !ITEM CONTEXT JSON.tenant
customerName: !ITEM CONTEXT JSON.tenant
The declarations should always be part of LogMan.io Library.
LogMan.io Parser Configuration
First it is needed to specify which library to load the declarations from, which can be either ZooKeeper or File.
Also, every running instance of the parser must know which groups to load from the libraries, see below:
# Declarations
[declarations]
library=zk://zookeeper:12181/lmio/library.lib ./data/declarations
groups=cisco-asa@syslog
include_search_path=filters/parser;filters/parser/syslog
raw_event=event.original
count=count
tenant=tenant
timestamp=end
groups - names of groups to be used from the library separated by spaces; if the group
is located within a folder's subfolder, use slash as a separator, f. e. parsers/cisco-asa@syslog
If the library is empty or the groups are not specified,
all events, including their context items, are dumpted
into lmio-others Kafka topic and processed by LogMan.io Dispatcher
as they were not parsed.
include_search_path - specifies folders to search for YAML files to be later used in !INCLUDE expression
statement (such as !INCLUDE myFilterYAMLfromFiltersCommonSubfolder) in declarations, separated by ;.
By specifying asterisk * after a slash in the path, all subdirectories will be recursively included.
!INCLUDE expression expects file name without path and without extension as input.
The behavior is similar to -I include attribute when building C/C++ code.
raw_event - field name of the input event log message (aka raw)
tenant - field name of tenant/client is stored to
count - field name the count of events is stored to, defaults to 1
timestamp - field name of timestamp attribute
Next, it is needed to know which Kafka topics to use at the input and output, if the parsing was successful or unsuccessful. Kafka connection needs to be also configured to know which Kafka servers to connect to.
# Kafka connection
[connection:KafkaConnection]
bootstrap_servers=lm1:19092;lm2:29092;lm3:39092
[pipeline:ParsersPipeline:KafkaSource]
topic=collected
# group_id=lmioparser
# Kafka sinks
[pipeline:EnrichersPipeline:KafkaSink]
topic=parsed
[pipeline:ParsersPipeline:KafkaSink]
topic=unparsed
The last mandatory section specifies which Kafka topic to use for the information about changes in lookups (i. e. reference lists) and which ElasticSearch instance to load them from.
# Lookup persistent storage
[asab:storage] # this section is used by lookups
type=elasticsearch
[elasticsearch]
url=http://elasticsearch:9200
# Update lookups pipelines
[pipeline:LookupChangeStreamPipeline:KafkaSource]
topic=lookups
[pipeline:LookupModificationPipeline:KafkaSink]
topic=lookups
Installation
Docker Compose
lmio-parser:
image: docker.teskalabs.com/lmio/lmio-parser
volumes:
- ./lmio-parser:/data
Configuring new LogMan.io Parser instance
To create a new parser instance for a new data source (files, lookups, SysLog etc.) the following three steps must be taken:
- Creation of a new Kafka topic to load the collected data to
- Configuration of associated LogMan.io Parser instances in site-repository
- Deployment
Creation of a new Kafka topic to load the collected data to
First, it is needed to create a new collected events topic.
Collected events topics are specific for every data source type and tenant (customer). The standard for naming such Kafka topics is as follows:
collected-<tenant>-<type>
where tenant is the lowercase tenant name and type is the data source type. Examples include:
collected-railway-syslog
collected-ministry-files
collected-johnandson-databases
collected-marksandmax-lookups
Collected topic for all tenants can have the following format:
collected-default-lookups
To create a new Kafka topic:
1.) Enter any Kafka container via docker exec -it o2czsec-central_kafka_1 bash
2.) Use the following command to create the topic using /usr/bin/kafka-topics:
/usr/bin/kafka-topics --zookeeper lm1:12181,lm2:22181,lm3:32181 --create --topic collected-company-type -partitions 6 --replication-factor 1
The number of partitions are dependant on the expected amount of data and number of instances of LogMan.io Parser. Since in most deployment there are three running servers in the cluster, it is recommended to use at least three partitions.
Configuration of associated LogMan.io Parser instances in site-repository
Enter the site repository with configurations for LogMan.io cluster. To learn more about the site repository, please refer to the Naming Standards in Reference section.
Then in every server folder (such as lm1, lm2, lm3) create the following entry in
docker-compose.yml file:
<tenant>-<type>-lmio-parser:
restart: on-failure:3
image: docker.teskalabs.com/lmio/lmio-parser
network_mode: host
depends_on:
- kafka
- elasticsearch-master
volumes:
- ./<tenant>-<type>/lmio-parser:/data
- ../lookups:/lookups
- /data/hdd/log/<tenant>-<type>/lmio-parser:/log
- /var/run/docker.sock:/var/run/docker.sock
replace <tenant> with tenant/customer name (such as railway) and <type> with data type (such as lookups),
examples include:
railway-lookups-lmio-parser
default-lookups-lmio-parser
hbbank-syslog-lmio-parser
When the Docker Compose entry is included in docker-compose.yml, follow these steps:
1.) In every server folder (lm1, lm2, lm3), create <tenant>-<type> folder
2.) In <tenant>-<type> folders, create lmio-parser folder
3.) In the created lmio-parser folders, create lmio-parser.conf file
4.) Modify the lmio-parser.conf and enter the following configuration:
[asab:docker]
name_prefix=<server_name>-
socket=/var/run/docker.sock
# Declarations
[declarations]
library=zk://lm1:12181,lm2:22181,lm3:32181/lmio/library.lib ./data/declarations
groups=<group>
raw_event=raw_event
count=count
tenant=tenant
timestamp=@timestamp
# API
[asab:web]
listen=0.0.0.0 0
[lmioparser:web]
listen=0.0.0.0 0
# Logging
[logging:file]
path=/log/log.log
backup_count=3
rotate_every=1d
# Kafka connection
[connection:KafkaConnection]
bootstrap_servers=lm1:19092,lm2:29092,lm3:39092
[pipeline:ParsersPipeline:KafkaSource]
topic=collected-<tenant>-<type>
group_id=lmio_parser_<tenant>_<type>
# Kafka sinks
[pipeline:EnrichersPipeline:KafkaSink]
topic=lmio-events
[pipeline:ParsersPipeline:KafkaSink]
topic=lmio-others
[pipeline:ErrorPipeline:KafkaSink]
topic=lmio-others
[asab:zookeeper]
servers=lm1:12181,lm2:22181,lm3:32181
path=/lmio/library.lib
[zookeeper]
urls=lm1:12181,lm2:22181,lm3:32181
servers=lm1:12181,lm2:22181,lm3:32181
path=/lmio/library.lib
# Lookup persistent storage
[asab:storage] # this section is used by lookups
type=elasticsearch
[elasticsearch]
url=http://<server_name>:9200/
username=<secret_username>
password=<secret_password>
# Update lookups pipelines
[pipeline:LookupChangeStreamPipeline:KafkaSource]
topic=lmio-lookups
group_id=lmio_parser_<tenant>_<type>_<server_name>
[pipeline:LookupModificationPipeline:KafkaSink]
topic=lmio-lookups
# Metrics
[asab:metrics]
target=influxdb
[asab:metrics:influxdb]
url=http://lm4:8086/
db=db0
username=<secret_username>
password=<secret_password>
where replace every occurrence of:
<group> with parser declaration group loaded in ZooKeeper;
for more information refer to Library in Reference section of this documentation
<server_name> with root server folder name such as lm1, lm2, lm3
<tenant> with your tenant name such as hbbank, default, railway etc.
<type> with your data source type such as lookups, syslog, files, databases etc.
<secret_username> and <secret_password> with ElasticSearch and InfluxDB technical account credentials,
which can be seen in other configurations in the site repository
For more information about what each of the configuration section means, please refer to Configuration section in the side menu.
Deployment
To deploy the new parser, please:
1.) Go to each of the LogMan.io servers (lm1, lm2, lm3)
2.) Do git pull in the site repository folder, which should be located in /opt directory
3.) Run docker-compose up -d <tenant>-<type>-lmio-parser to start the LogMan.io Parser instance
4.) Deploy and configure SyslogNG, LogMan.io Ingestor etc. to send the collected data to collected-<tenant>-<type> Kafka topic
4.) See logs in /data/hdd/log/<tenant>-<type>/lmio-parser folder for any errors to debug
(replace <tenant> and <type> accordingly)
Notes
To create data stream for lookups, please use lookups as type and refer to Lookups section in the side menu
to properly create the parsing declaration group.
DNS Enricher
DNS Enricher enriches event with information loaded from DNS server(s), such as hostnames.
Example
Declaration
---
define:
name: DNSEnricher
type: enricher/dns
dns_server: 8.8.8.8,5.5.4.8 # optional
attributes:
device.ip:
hostname: host.hostname
source.ip:
hostname:
- host.hostname
- source.hostname
Input
{
"source.ip": "142.251.37.110",
}
Output
{
"source.ip": "142.251.37.110",
"host.hostname": "prg03s13-in-f14.1e100.net",
"source.hostname": "prg03s13-in-f14.1e100.net"
}
Section define
This section defines the name and the type of the enricher,
which in the case of DNS Enricher is always enricher/dns.
Item name
Shorter human-readable name of this declaration.
Item type
The type of this declaration, must be enricher/dns.
Item dns_server
The list of DNS servers to ask for information, separated by comma ,.
Section attributes
Specify dictionary with attribues to load the IP address or other DNS-lookup information from.
Each attribute should be followed by another dictionary with the list of keys to extract from the DNS server.
Then the value of every key is either string with the name of the event attribute to store the looked up value in, or a list, if the value should be inserted into more than one event attribute.
Field Alias Lookup & Enricher
Lookup
Field Alias lookup contains information about canonical names of event attributes, together with their possible aliases (like short names etc.).
Field Alias lookup ID must contain the following substring: field_alias
The lookup record has the following structure:
key: canonical_name
value: {
"aliases": [
alias1, # f. e. short name
alias2, # f. e. long name
...
]
}
The field aliases can be specified in parsers', standard enrichers' and correlators'
define section, so that alias names used in the declarative file (like !ITEM EVENT alias)
are translated to canonical names, when accessing an existing element
(i. e. !ITEM EVENT alias or !ITEM EVENT canonical_name).
Also, the lookup should be used in Field Alias enricher to transform all aliases into canonical names after successful parsing in LogMan.io Parser.
Enricher
Field Alias enriches the event with canonical names of the existing attributes, that are named by one of the specified aliases, while deleting the alias attributes in the event.
Declaration
---
define:
name: FieldAliasEnricher
type: enricher/fieldalias
lookup: field_alias.default
Section define
This section defines the name and the type of the enricher,
which in the case of Field Alias is always enricher/fieldalias.
Item name
Shorter human-readable name of this declaration.
Item type
The type of this declaration, must be enricher/fieldalias.
IP2Location Enricher (OBSOLETE)
This enricher is obsoleted, please use IPEnricher instead.
IP2Location enriches the event with specified location attributes based on IPV4 or IPV6 value.
Example
Declaration
---
define:
name: IP2Location
type: enricher/ip2location
zones:
- myLocalZone
- ip2location
- ...
attributes:
ip_addr1:
country_short: firstCountry
city: firstCity
L: firstL
ip_addr2:
country_short: secondCountry
city: secondCity
L: secondL
...
Input
Feb 5 10:50:01 0:0:0:0:0:ffff:1f1f:e001 %ASA-1-105043 test
Output
{
'rt': 1580899801.0,
'msg': 'test',
'ip_addr1': '0:0:0:0:0:ffff:1f1f:e001',
'firstCountry': 'CZ',
'firstCity': 'Brno',
'firstL': {
'lat': 49.195220947265625,
'lon': 16.607959747314453
}
}
Section define
This section defines the name and the type of the enricher,
which in the case of IP2Location is always enricher/ip2location.
Item name
Shorter human-readable name of this declaration.
Item type
The type of this declaration, must be enricher/ip2location.
Value enricher/geoip is obsoleted equivalent.
Section zones
Specify a list of zones (database files or streams), which are going to be used by the enricher. First zone that successfully performs the lookup is used, so order them by priority.
Section attributes
Specify dictionary with event IPV6 attributes to search the lookup for, such as dvchost.
Inside the dictionary, mention fields/attributes from the lookup that are going to be loaded
plus the attribute name in the event after it. For example:
ip_addr1:
country_short: firstCountry
city: firstCity
L: firstL
will search the IP to GEO lookup for IP stored event["ip_addr1"],
load country_short, city, L from the lookup (if present) and map them to
event["firstCountry"], event["firstCity"], event["firstL"]
Lookup attributes
The following lookup attributes, if present in the lookup's zone, may be used for further mapping:
country_short: string
country_long: string
region: string
city: string
isp: string
L: dictionary (includes: lat: float, lon: float)
domain: string
zipcode: string
timezone: string
netspeed: string
idd_code: string
area_code: string
weather_code: string
weather_name: string
mcc: string
mnc: string
mobile_brand: string
elevation: float
usage_type: string
High Performance Parsing
High performance parsing is a parsing that is compiled directly to the machine code, thus ensuring highest possible speed of parsing incoming events.
All built-in preprocessors as well as declarative expressions !PARSE and !DATETIME.PARSE
offer high performance parsing.
Procedural parsing
In order for the machine/instruction code to be compiled via LLVM and C, all expressions need to provide definition of the procedural parsing, meaning that each character(s) in the parsing input string needs have defined the output length and output type.
While for preprocessors the procedure is transparent and not shown to the user,
in !PARSE and !DATETIME.PARSE expressions, the exact procedure needs with types and format to be defined in the format attribute:
!DATETIME.PARSE
what: "2021-06-11 17"
format:
- year: {type: ui64, format: d4}
- '-'
- month: {type: ui64, format: d2}
- '-'
- day: {type: ui64, format: d2}
- ' '
- hour: {type: ui64, format: d2}
First item in the format attribute corresponds to the first character(s) in the incoming message,
here year is formed from first four characters and traslated to integer (2021).
If only a single character is specified, it is skipped and not stored in the output parsed structure.
High Performance Expressions
!DATETIME.PARSE
!DATETIME.PARSE implicitly creates a datetime from the parsed structure,
which has following attributes:
-
year -
month -
day -
hour(optional) -
minute(optional) -
second(optional) -
microsecond(optional)
Format - long version
The attributes need to be specified in the format inlet:
!DATETIME.PARSE
what: "2021-06-11 1712X000014"
format:
- year: {type: ui64, format: d4}
- '-'
- month: {type: ui64, format: d2}
- '-'
- day: {type: ui64, format: d2}
- ' '
- hour: {type: ui64, format: d2}
- minute: {type: ui64, format: d2}
- 'X'
- microsecond: {type: ui64, format: dc6}
Format - short version
The format can use shortened notation with %Y, %m, %d, %H, %M, %S and %u (microsecond) placeholders,
which represent unsigned numbers based on the format in the example above:
!DATETIME.PARSE
what: "2021-06-16T11:17Z"
format: "%Y-%m-%dT%H:%MZ"
The format statement can be simplified, if the datetime format is standardized, such as RFC3339 or iso8601:
!DATETIME.PARSE
what: "2021-06-16T11:17Z"
format: iso8601
If timezone is different from UTC, also it needs to be explicitly specified:
!DATETIME.PARSE
what: "2021-06-16T11:17Z"
format: iso8601
timezone: Europe/Prague
Available types
Integer
-
{type: ui64, format: d2}- exactly 2 characters to unsigned integer -
{type: ui64, format: d4}- exactly 4 characters to unsigned integer -
{type: ui64, format: dc6}- 1 to 6 characters to unsigned integer
IP Enricher
IP Enricher extends events with geographic and other data associated with the given IPv6 or IPv4 address. This module replaces the IP2Location Enricher and the GeoIP Enricher, which are now obsolete.
Declaration
Section define
This section defines the name and the type of the enricher.
Item name
Short human-readable name of this declaration.
Item type
There are four types of IP Enricher available, differing in IP version (IPv4 or IPv6) and IP address representation (integer or string). Using the integer input is the faster, preferred option.
enricher/ipv6processes IPv6 addresses in 128-bit decimal integer format (such as 281473902969579).enricher/ipv4processes IPv4 addresses in 32-bit decimal integer format (such as 3221226219).enricher/ipv6strprocesses IPv6 addresses in colon-separated hexadecimal string format (such as 2001:db8:0:0:1:0:0:1) as defined in RFC 5952. It can also convert and process IPv4 string addresses (likeenricher/ipv4str).enricher/ipv4strprocesses IPv4 addresses in dotted decimal string format (such as 192.168.16.0) as defined in RFC 4001.
Item base_path
Specifies the base URL path which contains lookup zone files.
It can point to:
* local filesystem directory, e.g. /path/to/files/
* a location in zookeeper, e.g. zk://zookeeper-server:2181/path/to/files/
* an HTTP location, e.g. http://localhost:3000/path/to/files/
Section tenants
IP Enricher can be configured for multitenant settings. This section lists tenants which should be considered by the enricher in creating tenant-specific lookups. Events annotated with a tenant that is not listed in this section will only get global enrichment (see below).
Section zones
Specifies a list of lookup zones to be used by the enricher, plus the information whether they are global or tenant-specific.
Global lookups can enrich any event, regardless of its tenant. Tenant-specific lookups can only enrich events with matching tenant context.
Lookup zones should be ordered by their priority, highest to lowest, as the lookup iterates over the zones sequentially and stops as soon as the first match is found.
zones:
- tenant: lookup-zone-1.pkl.gz
- tenant: lookup-zone-2.pkl.gz
- global: lookup-zone-glob.pkl.gz
The zone names must match the corresponding file names including the extension.
The global lookup files need to exist directly in the base_path directory.
The tenant lookup files need to be organized under base_path into folders
by their respective tenant. For example, assuming we have declared
first_tenant and second_tenant, the zones declaration above expects
the following file structure:
/base_path/
- first_tenant/
- lookup-zone-1.pkl.gz
- lookup-zone-2.pkl.gz
- second_tenant/
- lookup-zone-1.pkl.gz
- lookup-zone-2.pkl.gz
- lookup-zone-glob.pkl.gz
An incoming event whose contxt is second_tenant will first try to match
in lookup second_tenant/lookup-zone-1.pkl.gz, then in
second_tenant/lookup-zone-2.pkl.gz and finally in lookup-zone-glob.pkl.gz
Section attributes
This section specifies which event attributes contain the IP address and what attributes shall be added to the event if a match is found. It has the following dictionary structure:
ip_address:
lookup_attribute_name: event_attribute_name
The IP address is extracted from the event attribute ip_address.
If it matches any lookup zone, the value of lookup_attribute_name is saved
into event_attribute_name. For example:
source_ip:
country_code: source_country
This will try to match the event based on its source_ip attribute and
store the corresponding country_code value into source_country event field.
Zone name enrichment
It may be useful to record the name of the lookup zone where the match happened.
To add the zone name into the event, use zone as the lookup attribute name, e.g.:
source_ip:
zone: source_zone_name
This will add the name of the matched lookup into the event field source_zone_name.
Note that if there is a field called "zone" in the lookup, its value will be used instead of the lookup name.
The lookup name is set at the creation of the lookup file.
It defaults to the name of the source file, but it can be configured to some other value.
See the lmiocmd ipzone from-csv command in LogMan.io Commander for details.
Example usage
Declaration file
---
define:
name: IPEnricher
type: enricher/ipv6
tenants:
- some-tenant
- another-tenant
zones:
- tenant: lookup-zone-1.pkl
- global: ip2location.pkl.gz
attributes:
ip_addr1:
country_code: sourceCountry
city_name: sourceCity
L: sourceLocation
ip_addr2:
country_code: destinationCountry
city_name: destinationCity
L: destinationL
...
Here, the enricher reads the IP address from the event attribute ip_addr1.
Then it tries to find the address in its lookup ojects: first in
lookup-zone-1.pkl, then in ip2location.pkl.gz.
If it finds a match, it retrieves the lookup values country_code,
city_name and L, and saves them in their respective event fields
sourceCountry, sourceCity and sourceLocation.
It proceeds analogically for the second address ip_addr2.
The result can be seen below.
Input
Feb 5 10:50:01 0:0:0:0:0:ffff:1f1f:e001 %ASA-1-105043 test
The line above may be parsed into the following dictionary.
{
'rt': 1580899801.0,
'msg': 'test',
'ip_addr1': '0:0:0:0:0:ffff:1f1f:e001'
}
This is passed to the IP Enricher we declared above.
Output
{
'rt': 1580899801.0,
'msg': 'test',
'ip_addr1': '0:0:0:0:0:ffff:1f1f:e001',
'sourceCountry': 'CZ',
'sourceCity': 'Brno',
'sourceLocation': (49.195220947265625, 16.607959747314453)
}
IP zone lookup file
The IP lookup file is a pickled Python dictionary.
It can be simply created from CSV file using the lmiocmd ipzone from-csv
command found in LogMan.io Commander.
The CSV needs to contain a header row with column names.
There needs to be an ip_from and an ip_to column, and at least one other
column with desired lookup values.
For example:
ip_from,ip_to,zone_info,latitude,longitude
127.61.100.0,127.61.111.255,my secret base,48.224673,-75.711505
127.61.112.0,127.61.112.255,my submarine,22.917923,267.490378
NOTE The zones defined in one lookup file must not overlap.
NOTE The IP zones in the CSV file are treated as closed intervals, i.e. both ip_from and ip_to fields are
included in the zone they delimit.
IP2Location
This command is also able to create a lookup file from IP2Location™ CSV databases. Note that these files don't include column names, so the header row needs to be added to the CSV file manually before creating the lookup.
IP Resolve Enricher & Expression
IP Resolve enriches the event with canonical hostname and/or IP based on either IP address AND network/space, or any hostname AND network connected to the IP address in the lookup.
IP Resolve lookup ID must contain the following substring: ip_resolve
The lookup record has the following structure:
key: [IP, network]
value: {
"hostnames": [
canonical_hostname,
hostname2,
hostname3
...
]
}
Example
Declaration #1 - Enricher
---
define:
name: IPResolve
type: enricher/ipresolve
lookup: lmio_ip_resolve # optional
source:
- ip_addr_and_network_try1
- ip_addr_and_network_try2
- hostname_and_network_try3
- [!IP.PARSE ip4, !ITEM EVENT network4]
...
ip: ip_addr_try1
hostname: host_name
Declaration #2 - Expression
!IP.RESOLVE
source:
- ip_addr_and_network_try1
- ip_addr_and_network_try2
- hostname_and_network_try3
- [!IP.PARSE ip4, !ITEM EVENT network4]
...
ip: ip_addr_try1
hostname: host_name
with: !EVENT
lookup: lmio_ip_resolve # optional
Input
Feb 5 10:50:01 0:0:0:0:0:ffff:1f1f:e001 %ASA-1-105043 test
Output
{
'rt': 1580899801.0,
'msg': 'test',
'ip_addr_try1': 281471203926017,
'host_name': 'my_hostname'
}
Section define
This section defines the name and the type of the enricher,
which in the case of IP Resolve is always enricher/ipresolve.
Item name
Shorter human-readable name of this declaration.
Item type
The type of this declaration, must be enricher/ipresolve.
Section source
Specify a list of attributes to lookup. Every attribute should be in the following format:
[IP, network]
[hostname, network]
If network is not specified, global will be used.
The first successful lookup returns the output values (ip, hostname).
Section ip
Specify the attribute to store the lookuped IP address in.
Section hostname
Specify the attribute to store the lookuped canonical hostname in.
Canonical hostname is the first in the lookup value's hostnames.
Loading the lookup from a file
The IP Resolve lookup data can be loaded from a file using LogMan.io Collector
input:FileBlock.
Hence, the data are available in the LogMan.io Parser, where they should be
posted to lookup target. Thus the lookup will not enter the input topic,
but the lookups topic, from where it is going to be processed
by LogMan.io Watcher to update data in ElasticSearch.
The LogMan.io Watcher expects the following event format:
{
'action': 'full',
'data': {
'items': [{
'_id': [!IP.PARSE 'MyIP', 'MyNetwork'],
'hostnames': ['canonical_hostname', 'short_hostname', 'another_short_hostname']
}
]
},
'lookup_id': 'customer_ip_resolve'
}
where action equals full signifies, that the existing lookup content should be
replaced with the items in data
To create this structure, use the following declarative example of Cascade Parser:
---
define:
name: Demo of IPResolve parser
type: parser/cascade
target: lookup
parse:
!DICT
set:
action: full
lookup_id:
!JOIN
items:
- !ITEM CONTEXT filename
- ip_resolve
delimiter: '_'
data:
!DICT
set:
items:
!FOR
each:
!REGEX.SPLIT
what: !EVENT
regex: '\n'
do:
!FIRST
- !CONTEXT.SET
set:
_temp:
!REGEX.SPLIT
what: !ARG
regex: ';'
- !DICT
set:
_id:
- !IP.PARSE
value: !ITEM CONTEXT _temp.0
- MyNetworkOrSpace
hostnames:
!LIST
append:
- !ITEM CONTEXT _temp.1
- !ITEM CONTEXT _temp.2
Parsing lookups
When a lookup is received from LogMan.io Collector via LogMan.io Ingestor, it can either be a whole lookup content (full frame), or just one record (delta frame).
Preprocessing
Based on the input lookup file format, a preprocessor should be used in order to simplify following declarations and optimize the speed of lookup loading. Usually, either JSON, XML or CSV preprocessor will be used:
---
define:
name: Preprocessor for CSV
type: parser/preprocessor
function: lmiopar.preprocessor.CSV
Thus, the parsed file content is stored in CONTEXT, where it can be accessed from.
Full frame
In order to store the entire lookup in ElasticSearch through LogMan.io Watcher,
and notify other instances of LogMan.io Parser and LogMan.io Correlator about the change
in the entire lookup, a Cascade Parser declaration should be used with target: lookup configuration.
Thus, the lookup will not enter the input topic,
but the lookups topic, from where it is going to be processed
by LogMan.io Watcher to update data in ElasticSearch.
The LogMan.io Watcher expects the following event format:
{
'action': 'full',
'data': {
'items': [{
'_id': 'myId',
...
}
]
},
'lookup_id': 'myLookup'
}
where action equals full signifies, that the existing lookup content should be
replaced with the items in data.
To create this structure, use the following declarative example of Cascade Parser.
Sample declaration
---
define:
name: Demo of lookup loading parser
type: parser/cascade
target: lookup
parse:
!DICT
set:
action: full
lookup_id: myLookup
data:
!DICT
set:
items:
!FOR
each: !ITEM CONTEXT CSV
do:
!DICT
set:
_id: !ITEM ARG myId
...
When the lookup content enters the LogMan.io Parser, the parsed lookup is being sent to LogMan.io Watcher to store it in ElasticSearch.
Delta frame
In order to update ONE item in an existing lookup in ElasticSearch through LogMan.io Watcher,
and notify other instances of LogMan.io Parser and LogMan.io Correlator about the change
in the lookup, a Cascade Parser declaration should be used with target: lookup configuration.
Thus, the lookup item will not enter the input topic,
but the lookups topic, from where it is going to be processed
by LogMan.io Watcher to update data in ElasticSearch.
The LogMan.io Watcher expects the following event format:
{
'action': 'update_item',
'data': {
'_id': 'existingOrNewItemId',
...
},
'lookup_id': 'myLookup'
}
where action equals update_item signifies, that the existing lookup item content should be
replaced items in data, or a new lookup item should be created.
To create this structure, use the following declarative example of Cascade Parser.
Sample declaration
---
define:
name: Demo of lookup item loading parser
type: parser/cascade
target: lookup
parse:
!DICT
set:
action: update_item
lookup_id: myLookup
data:
!DICT
set:
_id: !ITEM CONTEXT CSV.0.myID
...
When the lookup content enters the LogMan.io Parser, the parsed lookup is being sent to LogMan.io Watcher to store it in ElasticSearch.
MAC Vendor Enricher
MAC Vendor enriches event with specified vendor attributes based on their MAC address value (only first 6 characters are considered to detect the vendor).
Example
Declaration
---
define:
name: MACVendor
type: enricher/macvendor
lookup: lmio_mac_vendor # optional
attributes:
MAC1: detectedVendor1
MAC2: detectedVendor2
...
Input
Feb 5 10:50:01 0:0:0:0:0:ffff:1f1f:e001 %ASA-1-105043 5885E9001183
Output
{
'rt': 1580899801.0,
'MAC1': '5885E9001183',
'detectedVendor1': 'Realme Chongqing Mobile Telecommunications Corp Ltd',
}
Section define
This section defines the name and the type of the enricher,
which in the case of Mac Vendor is always enricher/macvendor.
Item name
Shorter human-readable name of this declaration.
Item type
The type of this declaration, must be enricher/macvendor.
Section attributes
Specify dictionary with event's MAC attributes to search the lookup for, such as MAC1.
Inside the dictionary, mention the attribute name in the event for the detected vendor to be stored in.
For example:
MAC1:
detectedVendor1
will search the Mac Vendor lookup for MAC stored event["MAC1"],
load the vendor to event["detectedVendor1"], if successfully looked up.
Lookup files
MAC Vendor enricher lookup files are based on OUI standard: standards-oui.ieee.org/oui.txt
The files are stored in the default path directory (/lookups/macvendor),
which can be overridden in configuration:
[lookup:lmio_mac_vendor]
path=...
lmio_mac_vendor is the provided lookup ID in the enricher definition, which defaults to lmio_mac_vendor
Parser Builder
The builder is a tool for an easy creation of parser/enricher declarations.
To start a builder, run:
python3 builder.py -w :8081 ./example/asa-parser
The path argument(s) specify the folder (or folders) with parsers and enrichers declarations (aka YAML files). It is recommended to point into a YAML library.
YAML files are loaded in the order as specified by the command-line and then by sorting *.yaml files found in a respective directory in alphabetical order.
-I argument allows to specify folders that will be used as a base for !INCLUDE directive. Multiple entries are allowed.
-w argument is to specify the HTTP port.
Parser preprocessor
The parser preprocessor allows to preprocess the input event by a imperative code, e.g. Python, Cython, C etc.
Example
---
define:
name: Demo of the build-in Syslog preprocessor
type: parser/preprocessor
tenant: Syslog_RFC5424.STRUCTURED_DATA.soc@0.tenant # (optional)
count: CEF.cnt # (optional)
function: lmiopar.preprocessor.Syslog_RFC5424
tenant specifies the tenant attribute to be read and passed to context['tenant']
for further distribution of parsed and unparsed events to tenant specific
indices/storages in LogMan.io Dispatcher
count specifies the count attribute
with count of events to be read and passed to context['count']
Built-in preprocessors
lmiopar.preprocessor module contains following commonly used preprocessors.
There preprocessors are optimized for high performace deployments.
Syslog RFC5425 built-in preprocessor
function: lmiopar.preprocessor.Syslog_RFC5424
This is a preprocessor for the Syslog protocol (new) according to RFC5425.
The input for this preprocessor is a valid Syslog entry, e.g.:
<165>1 2003-10-11T22:14:15.003Z mymachine.example.com evntslog 10 ID47 [exampleSDID@32473 iut="3" eventSource="Application" eventID="1011"] An application event log entry.
The output is, a message part of the log in the event and parsed elements in the context.syslog_rfc5424.
event: An application event log entry.
context:
Syslog_RFC5424:
PRI: 165
FACILITY: 20
PRIORITY: 5
VERSION: 1
TIMESTAMP: 2003-10-11T22:14:15.003Z
HOSTNAME: mymachine.example.com
APP_NAME: evntslog
PROCID: 10
MSGID: ID47
STRUCTURED_DATA:
exampleSDID@32473:
iut: 3
eventSource: Application
eventID: 1011
...
Syslog RFC3164 built-in preprocessor
function: lmiopar.preprocessor.Syslog_RFC3164
This is a preprocessor for the BSD syslog Protocol (old) according to RFC3164.
The Syslog RFC3164 preprocessor can be configured in the define section:
define:
type: parser/preprocessor
year: 1999
timezone: Europe/Prague
year specifies the numeric representation of the year that will be applied to the timestamp of the logs.
Also, you may specify smart (default) for the advanced selection of the year based on the month.
timezone specifies the timezone of the logs, the default is UTC.
The input for this preprocessor is a valid Syslog entry, e.g.:
<34>Oct 11 22:14:15 mymachine su[10]: 'su root' failed for lonvick on /dev/pts/8
The output is, a message part of the log in the event and parsed elements in the context.syslog_rfc3164.
event: "'su root' failed for lonvick on /dev/pts/8"
context:
Syslog_RFC3164:
PRI: 34
PRIORITY: 2
FACILITY: 4
TIMESTAMP: '2003-10-11T22:14:15.003Z'
HOSTNAME: mymachine
TAG: su
PID: 10
TAG and PID are optional parameters.
CEF built-in preprocessor
function: lmiopar.preprocessor.CEF
This is a preprocessor for the CEF or Common Event Format.
define:
type: parser/preprocessor
year: 1999
timezone: Europe/Prague
year specifies the numeric representation of the year that will be applied to the timestamp of the logs.
Also, you may specify smart (default) for the advanced selection of the year based on the month.
timezone specifies the timezone of the logs, the default is UTC.
The input for this preprocessor is a valid CEF entry, e.g.:
CEF:0|Vendor|Product|Version|foobar:1:2|Failed password|Medium| eventId=1234 app=ssh categorySignificance=/Informational/Warning categoryBehavior=/Authentication/Verify
The output is, a message part of the log in the event and parsed elements in the context.CEF:
context:
CEF:
Version: 0
DeviceVendor: Vendor
DeviceProduct: Product
DeviceVersion: Version
DeviceEventClassID: 'foobar:1:2'
Name: Failed password
Severity: Medium
eventId: '1234'
app: ssh
categorySignificance: /Informational/Warning
categoryBehavior: /Authentication/Verify
CEF can contain also a Syslog header. This is supported by chaining relevant Syslog preprocessor with a CEF preprocessor. Please refer to a preprocessor chaining chapter for details.
Apache HTTP Server log formats built-in preprocessor
There are high performance preprocessors for common Apache HTTP server access logs.
function: lmiopar.preprocessor.Apache_Common_Log_Format
This is a preprocessor for the Apache Common Log Format.
function: lmiopar.preprocessor.Apache_Combined_Log_Format
This is a preprocessor for the Apache Combined Log Format.
Apache Common Log example
Input:
127.0.0.1 - frank [10/Oct/2000:13:55:36 -0700] "GET /apache_pb.gif HTTP/1.0" 200 2326
Output:
context:
Apache_Access_Log:
HOST: '127.0.0.1'
IDENT: '-'
USERID: 'frank'
TIMESTAMP: '2000-10-10T20:55:36.000Z'
METHOD: 'GET'
RESOURCE: '/apache_pb.gif'
PROTOCOL: 'HTTP/1.0'
STATUS_CODE: 200
DOWNLOAD_SIZE: 2326
Apache Combined Log example
Input:
127.0.0.1 - frank [10/Oct/2000:13:55:36 -0700] "GET /apache_pb.gif HTTP/1.0" 200 2326 "http://www.example.com/start.html" "Mozilla/4.08 [en] (Win98; I ;Nav)"
Output:
context:
Apache_Access_Log:
HOST: '127.0.0.1'
IDENT: '-'
USERID: 'frank'
TIMESTAMP: '2000-10-10T20:55:36.000Z'
METHOD: 'GET'
RESOURCE: '/apache_pb.gif'
PROTOCOL: 'HTTP/1.0'
STATUS_CODE: 200
DOWNLOAD_SIZE: 2326
REFERE': http://www.example.com/start.html
USER_AGENT: Mozilla/4.08 [en] (Win98; I ;Nav)
Microsoft ULS built-in preprocessor
function: lmiopar.preprocessor.Microsoft_ULS
This is a preprocessor for the Microsoft_ULS according to Microsoft Docs.
For Microsoft SharePoint ULS logs, that do not contain server name nor correlation fields, a dedicated preprocessor is provided:
function: lmiopar.preprocessor.Microsoft_ULS_Sharepoint
The Microsoft SharePoint ULS preprocessor can be configured in the define section:
define:
type: parser/preprocessor
year: 1999
timezone: Europe/Prague
year specifies the numeric representation of the year that will be applied to the timestamp of the logs.
Also, you may specify smart (default) for the advanced selection of the year based on the month.
timezone specifies the timezone of the logs, the default is UTC.
The input for this preprocessor is a valid Microsoft ULS Sharepoint entry, e.g.:
04/28/2021 12:31:57.69 mssdmn.exe (0x38E0) 0x4D10 SharePoint Server Search Connectors:SharePoint dvt6 High SetSTSErrorInfo ErrorMessage = Error from SharePoint site: WebExceptionStatus: SendFailure The underlying connection was closed: An unexpected error occurred on a send. hr = 90141214 [sts3util.cxx:6994] search\native\gather\protocols\sts3\sts3util.cxx 3aeca97a-a9db-4010-970e-fe01483bfd4f
The output is, a message part of the log in the event and parsed elements in the context.Microsoft_ULS.
event: Message included in the log.
context:
Microsoft_ULS:
TIMESTAMP 1619613117.69
PROCESS: mssdmn.exe (0x38E0)
THREAD: 0x4D10
PRODUCT: SharePoint Server Search
CATEGORY: Connectors:SharePoint
EVENTID: dvt6
LEVEL: High
Query String preprocessor
function: lmiopar.preprocessor.Query_String
This is a preprocessor for the query string (key=value&key=value...) such as meta information from LogMan.io Collector
Example of input:
file_name=log.log&search=true
The output is, a message part of the log in the event and parsed elements in the context.QUERY_STRING.
event: Message included in the log.
context:
QUERY_STRING:
file_name: log.log
search: true
JSON built-in preprocessor
function: lmiopar.preprocessor.JSON
This is a preprocessor for the JSON format. It expects the input in a binary or textual format, the output dictionary is placed in the event.
Hence, the input for this preprocessor is a valid JSON entry.
XML built-in preprocessor
function: lmiopar.preprocessor.XML
This is a preprocessor for the XML format. It expects the input in a binary or textual format, the output dictionary is placed in the event.
Hence, the input for this preprocessor is a valid XML entry, e.g.:
<?xml version="1.0" encoding="UTF-8"?>
<Event xmlns="http://schemas.microsoft.com/win/2004/08/events/event">
<System>
<Provider Name="Schannel" Guid="{1f678132-5938-4686-9fdc-c8ff68f15c85}" />
<EventID>36884</EventID>
<Version>0</Version>
<Level>2</Level>
<Task>0</Task>
<Opcode>0</Opcode>
<Keywords>0x8000000000000000</Keywords>
<TimeCreated SystemTime="2020-06-26T07:12:01.331577900Z" />
<EventRecordID>30286</EventRecordID>
<Correlation ActivityID="{8e20742a-4b06-0002-c274-208e064bd601}" />
<Execution ProcessID="788" ThreadID="948" />
<Channel>System</Channel>
<Computer>XX</Computer>
<Security UserID="S-1-5-21-1627182167-2524376360-74743131-1001" />
</System>
<UserData>
<EventXML xmlns="LSA_NS">
<Name>localhost</Name>
</EventXML>
</UserData>
<RenderingInfo Culture="en-US">
<Message>The certificate received from the remote server does not contain the expected name. It is therefore not possible to determine whether we are connecting to the correct server. The server name we were expecting is localhost. The TLS connection request has failed. The attached data contains the server certificate.</Message>
<Level>Error</Level>
<Task />
<Opcode>Info</Opcode>
<Channel>System</Channel>
<Provider />
<Keywords />
</RenderingInfo>
</Event>
The output of the preprocessor in the event:
{
"System.EventID": "36884",
"System.Version": "0",
"System.Level": "2",
"System.Task": "0",
"System.Opcode": "0",
"System.Keywords": "0x8000000000000000",
"System.EventRecordID": "30286",
"System.Channel": "System",
"System.Computer": "XX",
"UserData.EventXML.Name": "localhost",
"RenderingInfo.Message": "The certificate received from the remote server does not contain the expected name. It is therefore not possible to determine whether we are connecting to the correct server. The server name we were expecting is localhost. The TLS connection request has failed. The attached data contains the server certificate.",
"RenderingInfo.Level": "Error",
"RenderingInfo.Opcode": "Info",
"RenderingInfo.Channel": "System"
}
CSV built-in preprocessor
function: lmiopar.preprocessor.CSV
This is a preprocessor for the CSV format. It expects the input in a binary or textual format, the output dictionary is placed in the event.
Hence, the input for this preprocessor is a valid CSV entry, e.g.:
user,last_name\njack,black\njohn,doe
The output of the preprocessor in the context["CSV"]:
{
"lines": [
{"user": "jack", "last_name": "black"},
{"user": "john", "last_name": "doe"}
]
}
Parameters
In define section of the CSV preprocessor,
the following parameters may be set for CSV reading:
delimiter: (default: ",")
escapechar: escape character
doublequote: allow doublequote (default: true)
lineterminator: line terminator character, either \n or \r (default is the operation system line separator)
quotechar: default quote character (default: "\"")
quoting: type of quoting
skipinitialspace: skip initial space (default: false)
strict: strict mode (default: false)
Custom preprocessors
A custom preprocessors can be called from the parser, the respective code has to be accessible by a parser microservice thru a common Python import way.
---
define:
name: Demo of the custom Python preprocessor
type: parser/preprocessor
function: mypreprocessors.preprocessor
mypreprocessors is a module respective a folder with __init__.py that contains a function preprocessor().
The parser specifies a function to call.
It uses Python notation and it will automatically import the module.
The signature of the function:
def preprocessor(context, event):
...
return event
Preprocessor may (1) modify the event (!EVENT) and/or (2) modify the context (!CONTEXT).
The output of the preprocessor function will be passed to a subsequent parsers.
Preprocessor parser doesn't produce parsed events directly.
If the function returns None, the parsing of the eveny is silently terminated.
If the funtion raises the exception, the exception will be logged and the event will be forwarded into unparsed output.
Chaining of preprocessors
Preprocessors can be chained in order to parse more complex input formats. The output (aka event) of the first preprocessor is fed as an input of the second preprocessor (and so on).
For example, the input is a CEF format with Syslog RFC3164 header:
<14>Jan 28 05:51:33 connector-test CEF_PARSED_LOG: CEF:0|Vendor|Product|Version|foobar:1:2|Failed password|Medium| eventId=1234 app=ssh categorySignificance=/Informational/Warning categoryBehavior=/Authentication/Verify
The pipeline contains two preprocessors:
p01_parser.yaml:
---
define:
name: Preprocessor for Syslog RFC5424 part of the message
type: parser/preprocessor
tenant: Syslog_RFC5424.STRUCTURED_DATA.soc@0.tenant
function: lmiopar.preprocessor.Syslog_RFC5424
p02_parser.yaml:
---
define:
name: Preprocessor for CEF part of the message
type: parser/preprocessor
function: lmiopar.preprocessor.CEF
and final parser p03_parser.yaml:
---
define:
name: Finalize by parsing the event into a dictionary
type: parser/cascade
parse:
!DICT
set:
Syslog_RFC5424: !ITEM CONTEXT Syslog_RFC5424
CEF: !ITEM CONTEXT CEF
Message: !EVENT
Output example:
context:
CEF:
Version: 0
DeviceVendor: Vendor
DeviceProduct: Product
DeviceVersion: Version
DeviceEventClassID: 'foobar:1:2'
Name: Failed password
Severity: Medium
eventId: '1234'
app: ssh
categorySignificance: /Informational/Warning
categoryBehavior: /Authentication/Verify
Syslog_RFC3164:
PRI: 14
FACILITY: 1
PRIORITY: 6
HOSTNAME: connector-test'
TAG: CEF_PARSED_LOG
TIMESTAMP': '2020-01-28T05:51:33.000Z'
Message: ''
Cisco ASA built-in preprocessor
function: lmiopar.preprocessor.CiscoASA
Warning
This preprocessor will be replaced by SP-Lang based parser.
Standard Enricher
Standard Enricher enriches the parsed event with additional fields. The enrichment takes place after one of the cascade parsers within the parsing group successfully matched and parsed the original input.
Example
---
define:
name: Example of standard enricher
type: enricher/standard
field_alias: field_alias.default
enrich:
- !DICT
with: !EVENT
set:
myEnrichedField:
!LOWER
what: "You Have Been Enriched"
Section define
This section contains the common definition and meta data.
Item name
Shorter human-readable name of the enricher's declaration.
Item type
The type of this declaration, must be enricher/standard.
Item field_alias
Name of the field alias lookup to be loaded, so that alias names of event attributes can be used in the declaration alongside their canonical names.
Item description (optional)
Longed, possibly multiline, human-readable description of the declaration.
Section enrich
This section specifies the actual enrichment of the incoming event. It expects a dictionary to be returned.
Typical statements in enrich section
!DICT statement allows to add fields / attributes to the already parsed event
Testing of parsers
It is important to test parsers to verify their functionality with various inputs. LogMan.io offers tools for manual and automated testing of parsers.
LogMan.io Parse Utility
This utility is meant for manual execution of parsers from command-line. It is useful for testing, since it applies selected parser groups on the input and unprocessed events are stored in a dedicated file so that parser can be improved till this "unparsed" output is empty. It is designed for parsing a very large inputs.
The parse utility is a command-line program. It is started by following command:
python3 ./parse.py -i input-syslog.txt -u unparsed-syslog.txt ./example/syslog_rfc5424-parser
-i, --input-file specifies the file with input lines for parsing
-u, --unparsed-file specifies the file to store the unparsed events from the input in
and then follow the parsers group(s) from a library, where to load the declarative parsers from.
The following application runs the parsing on a given input file with records divided by new lines, such as:
Feb 5 10:50:01 192.168.1.1 %ASA-1-105043 test1
Feb 5 10:55:10 192.168.1.1 %ASA-1-105043 test2
Feb 10 8:25:00 192.168.A1.1 X %ASA-1-105044 test3
and produces a file with only unparsed events, which has the same structure:
Feb 10 8:25:00 192.168.A1.1 X %ASA-1-105044 test3
Parser Unit test
The LogMan.io parses provides the tool for unit test execution over the library of parser and enricher declarations.
To start:
python3 ./test.py ./example [--config ./config.json]
The tool seeks for tests in the library, loads them and then execute them in the order.
Format of unit tests
Unit test file has to be placed in test directory and the name of the file has to comply with test*.yaml template. One YAML test file can contain one or more YAML documents with a test specification.
---
input: |
line 1
line 2
...
groups:
# This means that everything from input will be parsed
unparsed: []
parsed:
- msg: line
num: 1
- msg: line
num: 2
Extending a parser's pipeline
We ship LogMan.io Library with standard parsers organized into pre-defined groups. However, sometimes you will want to extend the parsing process with custom parsers or enrichers.
Consider the following input event to be parsed with parsers from LogMan.io Library with group ID lmio_parser_default_syslog_rfc3164:
<163>Feb 22 14:12:56 vmhost01 2135: ERR042: Something went wrong.
Such event will be parsed into a structured event that looks like this:
{
"@timestamp": 1614003176,
"ecs.version": "1.6.0",
"event.kind": "event",
"event.dataset": "syslog.rfc3164",
"message": "ERR042: Something went wrong.\n",
"host.name": "vmhost01",
"tenant": "default",
"log.syslog.priority": 163,
"log.syslog.facility.code": 20,
"log.syslog.severity.code": 3,
"event.ingested": 1614004510.4724128,
"_s": "SzOe",
"_id": "[ID]",
"log.original": "<163>Feb 22 14:12:56 vmhost01 2135: ERR042: Something went wrong.\n"
}
The input event, however, contains another keyword of interest - an error code "ERR042", that is not part of the structured event. We can extract the value into a custom field of the structured event by adding an enricher (a type of a parser) that slices the "message" part of the event and picks up the error code.
Locate The Parsers Group To Extend
In the example above we use parsers with group ID lmio_parser_default_syslog_rfc3164. So let's navigate to this group's folder in the LogMan.io Library:
$ cd /opt/lmio-ecs # ... or your other location of lmio-ecs
$ cd syslog_rfc3164-parser
Create A New Declaration File
By default, with no extensions, there are these files in the parsers group's folder:
$ ls -l
p01-parser.YAML p02-parser.YAML
These files contain parsers' declarations.
For a declaration of the new enricher, create file e01-enricher.yaml.
- The "e" stands for "enricher"
- The "01" stands for the priority this enricher will be given
- The "-enricher" can be replaced with anything meaningful to you
- "yaml" is the mandatory extension
Add Contents To The Declaration File
Define
The Declaration is a YAML file with a YAML header (empty in our case) and a mandatory definition block. We are adding a standard enricher with the name "Error Code Enricher".
Append the following to the declaration file:
---
define:
name: Error Code Enricher
type: enricher/standard
Predicate
We want our enricher to be applied to selected messages only, so we need to declare a Predicate using the declarative language.
Let's apply the enrichment to messages from host vmhost01.
Append the following to the declaration file:
predicate:
!EQ
- !ITEM EVENT host.name
- "vmhost01"
Enrich
Looking at the "message" of the example event, we want to split the message by colons, take the value of the first item of results and store it as "error.code" (or another ECS field).
We can achieve that again with declarative language.
Append the following to the declaration file:
enrich:
!DICT
with: !EVENT
set:
error.code: !CUT
what: !ITEM EVENT message
delimiter: ':'
field: 0
The result event passed to the parsers pipeline will consist of all fields from the original event and of one other field "error.code", the value of which is a result of !CUTting the "message" field from the original event (!ITEM EVENT message) using : as delimiter and picking up the item at index 0.
This is how the contents of e01-enricher.yaml look like as a result:
---
define:
name: Error Code Enricher
type: enricher/standard
predicate:
!EQ
- !ITEM EVENT host.name
- "vmhost01"
enrich:
!DICT
with: !EVENT
set:
error.code: !CUT
what: !ITEM EVENT message
delimiter: ':'
field: 0
Apply changes
The new declaration should be kept in version control. The lmio-parser instance that uses the parsers' group ID must be restarted.
Conclusion
We added a new enricher into the lmio_parser_default_syslog_rfc3164's parsers pipeline.
New events from the host vmhost01 will now be parsed and enriched resulting in this output event:
{
"@timestamp": 1614003176,
"ecs.version": "1.6.0",
"event.kind": "event",
"event.dataset": "syslog.rfc3164",
"message": "ERR042: Something went wrong.\n",
"host.name": "vmhost01",
"tenant": "default",
"log.syslog.priority": 163,
"log.syslog.facility.code": 20,
"log.syslog.severity.code": 3,
"event.ingested": 1614004510.4724128,
"_s": "SzOe",
"_id": "[ID]",
"log.original": "<163>Feb 22 14:12:56 vmhost01 2135: ERR042: Something went wrong.\n",
"error.code": "ERR042"
}
Depositor
LogMan.io Depositor
TeskaLabs LogMan.io Depositor is a microservice responsible for storing events in Elasticsearch, and setting up Elasticsearch artifacts (like index templates and ILM policies) based on event lane declarations.
LogMan.io Depositor stores the successfully parsed or correlated events and other events in their proper Elasticsearch indices.
Note
LogMan.io Depositor replaces LogMan.io Dispatcher.
Important notes
Prerequisites and configuration
- Depositor requires a specific Elasticsearch setting with node roles provided, see Prerequisites
- Depositor's default lifecycle policy requires node roles to be set in Elasticsearch's configuration, see Prerequisites
- Depositor by default stops sending data to Elasticsearch if cluster health is below
50 %, see Configuration - Depositor considers all event lane files regardless of if they are disabled for the given tenant in the UI or not
Index management
- Depositor creates its own index template and lifecycle policy (ILM) for each index specified in the
eventsandotherssections within the event lane declaration, see Event Lane - Depositor's default index template has 6 shards and 1 replica
- The field mapping (types of the fields) in the index template are based on the event lane schema, see Event Lane
Lifecycle details
- Depositor's default lifecycle policy has limit of 16 GB per primary shard per index (the default maximum index size is thus 6 shards * 16 GB * 2 for replica = 192 GB)
- Depositor's default lifecycle policy has shrinking enabled when entering the warm phase
- Depositor's default lifecycle policy deletes data after 180 days
Migration
- When migrating LogMan.io Dispatcher to LogMan.io Depositor, see the Migration section
Depositor prerequisites
LogMan.io Depositor has the following dependencies:
- Elasticsearch
- Apache ZooKeeper
- Apache Kafka
- LogMan.io Library with an
/EventLanesfolder and a schema in the/Schemasfolder
Elasticsearch configuration
The Elasticsearch cluster needs to be configured in the following way in order for LogMan.io Depositor to work properly.
The following is a Docker Compose entry of Elasticsearch nodes, when using a 3-node cluster architecture with lm1, lm2, and lm3 server nodes.
Note
Please note that, in the Docker Compose file, the proper node roles are assigned to Elasticsearch nodes based on the ILM. For example, hot nodes for the ILM hot phase must contain node roles data_hot and data_content.
When creating Docker Compose records for Elasticsearch nodes, the following attributes must be changed:
- NODE_ID: The name of the server where the Elasticsearch instance is running
- INSTANCE_ID: The name of the Elasticsearch instance. Make sure its postfix
-1is changed to-2at the second instance of this service etc. INSTANCE_ID is thus a unique identifier for each of the instances. - network.host: The name of the server where the Elasticsearch instance is running
- node.attr.rack_id: The name of the server rack (for large deployments) or the name of the server where the Elasticsearch instance is running
- discovery.seed_hosts: The server host names and ports of all Elasticseach master nodes
- xpack.security.transport.ssl.certificate: The path to the certificate specific for the given Elasticsearch instance
- xpack.security.transport.ssl.key: The path to the certificate key specific for the given Elasticsearch instance
- volumes: The path to the given Elasticsearch instance's data
elasticsearch-master-1:
network_mode: host
user: "1000:1000"
image: docker.elastic.co/elasticsearch/elasticsearch:7.17.9
environment:
- NODE_ID=lm1
- SERVICE_ID=elasticsearch
- INSTANCE_ID=elasticsearch-master-1
- network.host=lm1 # (1)
- node.attr.rack_id=lm1 # (2)
- node.name=elasticsearch-master-1
- node.roles=master,ingest
- cluster.name=lmio-es # (3)
- cluster.initial_master_nodes=elasticsearch-master-1,elasticsearch-master-2,elasticsearch-master-3 # (6)
- discovery.seed_hosts=lm1:9300,lm2:9300,lm3:9300
- http.port=9200
- transport.port=9300 # (4)
- "ES_JAVA_OPTS=-Xms4g -Xmx4g" # (5)
- ELASTIC_PASSWORD=$ELASTIC_PASSWORD
- xpack.security.enabled=true
- xpack.security.transport.ssl.enabled=true
- xpack.security.transport.ssl.verification_mode=certificate
- xpack.security.transport.ssl.certificate_authorities=certs/ca/ca.crt
- xpack.security.transport.ssl.certificate=certs/elasticsearch-master-1/elasticsearch-master-1.crt
- xpack.security.transport.ssl.key=certs/elasticsearch-master-1/elasticsearch-master-1.key
volumes:
- /data/ssd/elasticsearch/elasticsearch-master-1/data:/usr/share/elasticsearch/data
- ./elasticsearch/certs:/usr/share/elasticsearch/config/certs
restart: always
-
The node will bind to the public address and will also use it as its publish address.
-
Rack ID or datacenter name. This is meant for ES to effectively and safely manage replicas. For smaller installations, a hostname is fine.
-
The name of the Elasticsearch cluster. There is only one Elasticsearch cluster in LogMan.io.
-
Ports for internal communication among nodes.
-
Memory allocated by this Elasticsearch instance. 31 GB is the maximum recommended value, and the server node must have adequate memory available (if there are three Elasticsearch nodes with 31 GB and one master with 4 GB, there must be at least 128 GB available).
-
Intial master nodes are the instance IDs of all Elasticsearch master nodes available in the LogMan.io cluster. The master nodes' names must be aligned with node.name. In LogMan.io (as defined by Maestro), it is the same as INSTANCE_ID.
elasticsearch-hot-1:
network_mode: host
user: "1000:1000"
image: docker.elastic.co/elasticsearch/elasticsearch:7.17.9
depends_on:
- es-master
environment:
- NODE_ID=lm1
- SERVICE_ID=elasticsearch
- INSTANCE_ID=elasticsearch-hot-1
- network.host=lm1 # (1)
- node.attr.rack_id=lm1 # (2)
- node.attr.data=hot # (3)
- node.name=elasticsearch-hot-1
- node.roles=data_hot,data_content # (6)
- cluster.name=lmio-es # (4)
- cluster.initial_master_nodes=elasticsearch-master-1,elasticsearch-master-2,elasticsearch-master-3 # (8)
- discovery.seed_hosts=lm1:9300,lm2:9300,lm3:9300
- http.port=9201
- transport.port=9301 # (5)
- "ES_JAVA_OPTS=-Xms31g -Xmx31g" # (7)
- ELASTIC_PASSWORD=$ELASTIC_PASSWORD
- xpack.security.enabled=true
- xpack.security.transport.ssl.enabled=true
- xpack.security.transport.ssl.verification_mode=certificate
- xpack.security.transport.ssl.certificate_authorities=certs/ca/ca.crt
- xpack.security.transport.ssl.certificate=certs/elasticsearch-hot-1/elasticsearch-hot-1.crt
- xpack.security.transport.ssl.key=certs/elasticsearch-hot-1/elasticsearch-hot-1.key
volumes:
- /data/ssd/elasticsearch/elasticsearch-hot-1/data:/usr/share/elasticsearch/data
- ./elasticsearch/certs:/usr/share/elasticsearch/config/certs
-
The node will bind to the public address and will also use it as its publish address.
-
Rack ID or datacenter name. This is meant for ES to effectively and safely manage replicas. For smaller installations a hostname is fine.
-
Attributes
node.attr.dataare in the configuration because of backward compatibility for legacy ILM, where custom allocation bynode.attr.datais used. This applies for installations of LogMan.io before 01/2024. -
The name of the Elasticsearch cluster. There is only one Elasticsearch cluster in LogMan.io.
-
Ports for internal communication among nodes.
-
Node roles are here for ILM default allocation to work properly.
-
Memory allocated by this Elasticsearch instance. 31 GB is the maximum recommended value and the server node must have adequate memory available (if there are three Elasticsearch nodes with 31 GB and one master with 4 GB, there must be at least 128 GB available).
-
Intial master nodes are the instance IDs of all Elasticsearch master nodes available in the LogMan.io cluster. The master nodes names must be aligned with node.name. In LogMan.io (as defined by Maestro), it is the same as INSTANCE_ID.
elasticsearch-warm-1:
network_mode: host
user: "1000:1000"
image: docker.elastic.co/elasticsearch/elasticsearch:7.17.9
depends_on:
- es-master
environment:
- NODE_ID=lm1
- SERVICE_ID=elasticsearch
- INSTANCE_ID=elasticsearch-warm-1
- network.host=lm1 # (1)
- node.attr.rack_id=lm1 # (2)
- node.attr.data=warm # (3)
- node.name=elasticsearch-warm-1
- node.roles=data_warm # (6)
- cluster.name=lmio-es # (4)
- cluster.initial_master_nodes=elasticsearch-master-1,elasticsearch-master-2,elasticsearch-master-3 # (8)
- discovery.seed_hosts=lm1:9300,lm2:9300,lm3:9300
- http.port=9202
- transport.port=9302 # (5)
- "ES_JAVA_OPTS=-Xms31g -Xmx31g" # (7)
- ELASTIC_PASSWORD=$ELASTIC_PASSWORD
- xpack.security.enabled=true
- xpack.security.transport.ssl.enabled=true
- xpack.security.transport.ssl.verification_mode=certificate
- xpack.security.transport.ssl.certificate_authorities=certs/ca/ca.crt
- xpack.security.transport.ssl.certificate=certs/elasticsearch-warm-1/elasticsearch-warm-1.crt
- xpack.security.transport.ssl.key=certs/elasticsearch-warm-1/elasticsearch-warm-1.key
volumes:
- /data/hdd/elasticsearch/elasticsearch-warm-1/data:/usr/share/elasticsearch/data
- ./elasticsearch/certs:/usr/share/elasticsearch/config/certs
-
The node will bind to the public address and will also use it as its publish address.
-
Rack ID or datacenter name. This is meant for ES to effectively and safely manage replicas. For smaller installations a hostname is fine.
-
Attributes
node.attr.dataare in the configuration because of backward compatibility for legacy ILM, where custom allocation bynode.attr.datais used. This applies for installations of LogMan.io before 01/2024. -
The name of the Elasticsearch cluster. There is only one Elasticsearch cluster in LogMan.io.
-
Ports for internal communication among nodes.
-
Node roles are here for ILM default allocation to work properly.
-
Memory allocated by this Elasticsearch instance. 31 GB is the maximum recommended value and the server node must have adequate memory available (if there are three Elasticsearch nodes with 31 GB and one master with 4 GB, there must be at least 128 GB available).
-
Intial master nodes are the instance IDs of all Elasticsearch master nodes available in the LogMan.io cluster. The master nodes names must be aligned with node.name. In LogMan.io (as defined by Maestro), it is the same as INSTANCE_ID.
elasticsearch-cold-1:
network_mode: host
user: "1000:1000"
image: docker.elastic.co/elasticsearch/elasticsearch:7.17.9
depends_on:
- es-master
environment:
- NODE_ID=lm1
- SERVICE_ID=elasticsearch
- INSTANCE_ID=elasticsearch-cold-1
- network.host=lm1
- node.attr.rack_id=lm1 # (2)
- node.attr.data=cold # (3)
- node.name=elasticsearch-cold-1
- node.roles=data_cold # (6)
- cluster.name=lmio-es # (4)
- cluster.initial_master_nodes=elasticsearch-master-1,elasticsearch-master-2,elasticsearch-master-3 # (8)
- discovery.seed_hosts=lm1:9300,lm2:9300,lm3:9300
- http.port=9203
- transport.port=9303 # (5)
- "ES_JAVA_OPTS=-Xms31g -Xmx31g" # (7)
- ELASTIC_PASSWORD=$ELASTIC_PASSWORD
- xpack.security.enabled=true
- xpack.security.transport.ssl.enabled=true
- xpack.security.transport.ssl.verification_mode=certificate
- xpack.security.transport.ssl.certificate_authorities=certs/ca/ca.crt
- xpack.security.transport.ssl.certificate=certs/elasticsearch-cold-1/elasticsearch-cold-1.crt
- xpack.security.transport.ssl.key=certs/elasticsearch-cold-1/elasticsearch-cold-1.key
volumes:
- /data/hdd/elasticsearch/elasticsearch-cold-1/data:/usr/share/elasticsearch/data
- ./elasticsearch/certs:/usr/share/elasticsearch/config/certs
-
The node will bind to the public address and will also use it as its publish address.
-
Rack ID or datacenter name. This is meant for ES to effectively and safely manage replicas. For smaller installations a hostname is fine.
-
Attributes
node.attr.dataare in the configuration because of backward compatibility for legacy ILM, where custom allocation bynode.attr.datais used. This applies for installations of LogMan.io before 01/2024. -
The name of the Elasticsearch cluster. There is only one Elasticsearch cluster in LogMan.io.
-
Ports for internal communication among nodes.
-
Node roles are here for ILM default allocation to work properly.
-
Memory allocated by this Elasticsearch instance. 31 GB is the maximum recommended value and the server must have adequate memory available (if there are three Elasticsearch nodes with 31 GB and one master with 4 GB, there must be at least 128 GB available).
-
Intial master nodes are the instance IDs of all Elasticsearch master nodes available in the LogMan.io cluster. The master nodes names must be aligned with node.name. In LogMan.io (as defined by Maestro), it is the same as INSTANCE_ID.
Index templates
LogMan.io Depositor creates its own index templates with the events index from the event lane's elasticsearch configuration, adding the postfix -template. All previous index templates, if present, must have a different name and their priority set to 0.
Depositor configuration
Configuration sample
This is the most basic configuration required for LogMan.io Depositor:
[zookeeper]
servers=zookeeper-1:2181,zookeeper-2:2181,zookeeper-3:2181
[library]
providers=zk:///library
[kafka]
bootstrap_servers=kafka-1:9092,kafka-2:9092,kafka-3:9092
[elasticsearch]
url=http://es01:9200
Zookeeper
Specify locations of the Zookeeper server in the cluster.
[zookeeper]
servers=zookeeper-1:2181,zookeeper-2:2181,zookeeper-3:2181
Hint
For non-production deployments, the use of a single Zookeeper server is possible.
Library
Specify the path(s) to the library to load declarations from.
[library]
providers=zk:///library
Hint
Since ECS.yaml schema in /Schemas is utilized by default, consider using the LogMan.io Common Library.
Kafka
Specify bootstrap servers of the Kafka cluster.
[kafka]
bootstrap_servers=kafka-1:9092,kafka-2:9092,kafka-3:9092
Hint
For non-production deployments, the use of a single Kafka server is possible.
Elasticsearch
Specify URLs of Elasticsearch master nodes.
The ESConnection section is used for setting advanced parameters of the connection (see below).
The elasticsearch section is used for storing URLs and authorization items.
The asab:storage section is used to explicitly allow the storage initialization.
[asab:storage]
type=elasticsearch
[connection:ESConnection]
precise_error_handling=true
bulk_out_max_size=1582912
output_queue_max_size=5
loader_per_url=1
cluster_status_throttle=red
cluster_status_unthrottle=green
active_shards_percent_throttle=50
retry_errors=unavailable_shards_exception
throttle_errors=circuit_breaking_exception
[elasticsearch]
url=http://es01:9201
username=MYUSERNAME
password=MYPASSWORD
Hint
The URL should point to the Elasticsearch hot node on the same server the Depositor is deployed to.
Elasticsearch Connection Advanced Settings
precise_error_handling
Specifies Elasticsearch should return information about which events caused the issue together with the error.
bulk_out_max_size
Size of a single bulk being sent to Elasticsearch in bytes.
Events are grouped into bulks to lower the number of requests sent to Elasticsearch.
output_queue_max_size
Maximum queue size for Elasticsearch bulks.
If the number is exceeded, the given pipeline is throttled.
loader_per_url
Number of tasks/loaders per URL. It specifies the number of requests which can be sent simultaneously to every URL specified in the URL attribute.
cluster_status_throttle
The state the cluster must enter in order to stop/throttle the Depositor. Can be set to none.
Default: red
Options: red, yellow, none
cluster_status_unthrottle
The state the cluster must enter in order to resume/unthrottle the Depositor, if throttled.
Default: green
Options: red, yellow, green
active_shards_percent_throttle
The minimum percentage of total shards that must be active/available in order for Depositor to send events.
The value, which is a percentage, should be set to 100 / (number of replicas + 1).
Default: 50
retry_errors
List of retryable errors, separated by comma, which cause the retry of the event to be sent again to the events index specified in the event lane.
Note
This configuration option is unnecessary in most cases, so it is recommended to exclude it from your configuration file.
throttle_errors
List of errors, separated by comma, that cause the throttle of Dispatcher until resolved.
Note
This configuration option is unnecessary in most cases, so it is recommended to exclude it from your configuration file.
Declarations
Optional section to specify where to load the declarations of event lanes from and which schema is going to be used by default (if it is not specified in the given event lane declaration).
[declarations]
path=/EventLanes/
schema=/Schemas/ECS.yaml
Hint
Make sure to change the schema if you are using a schema other than ECS in your deployment as your default. Changing the path for event lanes is discouraged.
Event Lanes
TeskaLabs LogMan.io Depositor reads all event lanes from the library and creates Kafka-to-Elasticsearch pipelines based on kafka and elasticsearch sections.
Note
All deployed instances of TeskaLabs LogMan.io Depositor share the same Group ID within Kafka. All instances distribute consumption from Kafka partitions among themselves and thus provide scalability natively.
Declaration
This is an example of event lane sections relevant for LogMan.io Depositor:
---
define:
type: lmio/event-lane
kafka:
events:
topic: events.<tenant>.<stream> # Kafka topic for parsed events
others:
topic: others.<tenant>.<stream> # Kafka topic for unparsed events
elasticsearch:
events:
index: lmio-<tenant>-events-<stream> # Index alias for events
others:
index: lmio-<tenant>-others # Index alias for others
When LogMan.io Depositor is started and the event lane is loaded, two pipelines are created.
Events pipeline consumes messages from Kafka topic defined in kafka/events/topic option and stores them in Elasticsearch index, using index alias defined in elasticsearch/events/index option.
Others pipeline similarly consumes messages from topic defined in kafka/others/topic and stores them in index using alias defined in elasticsearch/others/index.
Index vs. index alias
In Elasticsearch, an index is a collection of documents that share the same structure and are stored together. It is the primary unit of data storage and retrieval.
An index alias is a virtual name that can point to one or multiple indices. It allows to view and manipulate with data of the same logical stream.
In event lane, index alias is specified. LogMan.io Depositor creates indices based on that alias.
For example, when the index alias is defined as lmio-tenant-events-stream, _LogMan.io Depositor creates indices
lmio-tenant-events-stream-000001
lmio-tenant-events-stream-000002
lmio-tenant-events-stream-000003
...
Complex event lanes
LogMan.io Depositor does not natively read from the events.<tenant>.complex Kafka topic and skips complex event lanes.
Note
Depositor considers ALL event lane files regardless of if they are disabled for the given tenant in the UI or not. Depositor is not a tenant-specific service.
Index template
LogMan.io Depositor creates and updates index template of each event lane.
The mappings in the index template are based on the event lane schema. Default schema for event lane is /Schemas/ECS.yaml. It can be changed in event lane declaration:
---
define:
type: lmio/event-lane
schema: /Schemas/CEF.yaml
It is also possible to specify number_of_shards and number_of_replicas in the settings section in elasticsearch:
---
define:
type: lmio/event-lane
elasticsearch:
events:
settings:
number_of_shards: 6
number_of_replicas: 1
The default number_of_shards is 6 and number_of_replicas is 1.
Note
Please consider carefully before changing the default settings and schema. Changing the defaults usually causes issues such as non-matching detection rules for the given event lane that uses a different schema.
Warning
Changes to the index template will only take effect after the next index rollover if an index already exists in Elasticsearch.
Lifecycle Policy
LogMan.io Depositor configures Index Lifecycle Policy of each event lane.
Default
The default lifecycle policy contains four phases: hot, warm, cold, and delete.
-
The default hot phase for the given index ends when primary shard size exceeds 16 GB or is older than 7 days.
-
The default warm phase for the given index starts either when hot ends, or after 7 days, and turns on shrinking.
-
The default cold phase for the given index starts after 14 days.
-
The delete phase deletes the index after 180 days.
Custom
The default ILM can be changed, even though it is not recommended for most cases. You can do so by specifying the lifecycle section within the event lane's elasticsearch section:
---
define:
type: lmio/event-lane
elasticsearch:
events:
lifecycle:
hot:
min_age: "0ms"
actions:
rollover:
max_primary_shard_size: "25gb" # We want bigger primary shards than default
max_age: "30d"
set_priority:
priority: 100
warm:
min_age: "7d"
actions:
shrink:
number_of_shards: 1
set_priority:
priority: 50
cold:
min_age: "14d"
actions:
set_priority:
priority: 0
delete:
min_age: 180d
actions:
delete:
delete_searchable_snapshot: true
Set complete ILM policy.
Even if you aim to change just one of all the phases, you need to specify whole lifecycle policy. Custom ILM overrides the default configuration completely.
No delete phase
If you don't want to setup delete phase, just omit the section delete in event lane. Use this only if you really know what you are doing!
Dispatcher migration to Depositor
Warning
This section is relevant for non-automated installations of TeskaLabs LogMan.io that operates with LogMan.io Dispatcher.
The migration from LogMan.io Dispatcher to LogMan.io Depositor needs to be done one event lane at a time following the steps mentioned below.
Warning
Before starting the migration, you must follow the Prerequisites, making sure to properly configure node roles for Elasticsearch nodes in the cluster.
Migration steps
Select one event lane to be migrated and follow this guide:
1. In Kibana, go to Management > Stack Management, then Index Management. Click on Index Templates and find the index template associated with the event lane being migrated. Usually, the name is in the format of lmio-tenant-events-eventlane-template. In the Actions column (three dots) on the right, click on Clone.
2. In Clone, Change the Name to backup-lmio-tenant-events-eventlane-template, and set the Priority to 0.
3. Go to Review template and click Create template.
4. Check that the backup-lmio-tenant-events-eventlane-template template exists in the Index Template tab.
5. Delete the original lmio-tenant-events-eventlane-template, and keep only the backup you just created.
6. Go to the LogMan.io UI, to the Library section and the /EventLanes folder
7. If the event lane file does not exist already, create the new event lane file with the name fortigate.yaml (replace "fortigate" with your event lane name) in the /EventLanes/tenant folder (replace "tenant" with the name of your tenant). If the /EventLanes/tenant folder does not exist already, you need to create it in ZooKeeper UI.
8. Create the kafka and elasticsearch sections for the given event lane with both events and others sections specified (see Event Lane). The default schema for field mapping is /Schemas/ECS.yaml, unless specified in the event lane.
9. If not deployed, deploy LogMan.io Depositor with kafka, elasticsearch, zookeeper, and library sections specified (see Configuration).
10. Check LogMan.io Depositor logs for warnings. Please check both Docker logs and file logs (if file logs are configured). The Docker logs can be accessed via the following command:
docker logs -f -n 1000 <lmio-depositor>
Replace <lmio-depositor> with the LogMan.io Depositor Docker container name in your deployment.
11. In Kibana, go to Management > Stack Management, then Index Management, and check that the new lmio-tenant-events-eventlane-template and lmio-tenant-others-template index templates were created by Depositor. Click on the index template and check its settings and mappings. The default settings include 6 shards and 1 replica (see Event Lane).
12. In Kibana, go to Management > Stack Management, then Index Lifecycle Policies and check if lmio-tenant-events-eventlane-ilm and lmio-tenant-others-ilm were created. Click on their name to check the hot, warm, cold, and delete phase settings.
13. If LogMan.io is not deployed or configured for this purpose already, deploy or configure Parsec to send data to the Kafka event topic specified in the event lane declaration (here: fortigate.yaml ). Please see the Parsec Configuration section.
14. In Kibana, go to Management > Dev Tools and run index rollover, replacing tenant and eventlane with the name of your tenant and your event lane:
POST /lmio-tenant-eventlane/_rollover
15. Check that the new index written in the response in the box on the right side of the screen was created. Go to Management > Stack Management, then Index Management, to the tab Indices and find the index lmio-tenant-events-eventlane-0000x.
16. Click on lmio-tenant-events-eventlane-0000x, check that it is connected to the proper lifecycle policy, which should be lmio-tenant-events-eventlane-ilm, and also check that Current phase is hot. Then, click on Settings and Mappings to check the number of shards (default is 6) and fields mapping that is loaded from the schema. The default schema is /Schemas/ECS.yaml, unless specified in the event lane.
17. In Kibana, go to Analysis > Discover and check that the data is coming to the given event lane.
18. In LogMan.io UI, go to Discover and check that the data is coming to the given event lane.
19. Repeat steps 1 to 18 for all remaining event lanes (their events index). Only then you can finish the migration by doing the same procedure for the others indices.
Hint
In the following days, periodically check that all indices are connected to the lifecycle policy (step 16). Also, make sure the indices in hot phase are allocated to the hot Elasticsearch nodes, which can be seen in Kibana in Management > Stack Monitoring > Indices.
Note
When you can confirm that everything is working properly after a week, you can delete the original backup index template backup-lmio-tenant-events-eventlane-template.
Troubleshooting
Advice for addressing the most commonly encountered issues:
After index rollover, the data is not coming through
After a rollover, Elasticsearch usually takes a few minutes to display the data.
Once a few minutes have passed, check the lmio-tenant-others data in Kibana's Discover or LogMan.io UI's Discover. If there is no related data, check the others.tenant topic in Kafka UI. The error messages in the logs should be specific enough to describe why the data could not be stored in Elasticsearch. It usually means that the wrong schema is being used. See the Event Lane section or step 8 in the Migration section.
For advanced users: When you set the index template priority in backup-lmio-tenant-events-eventlane-template (from step 4 in Migration) from 0 to 2 or more and do an index rollover, this old backup index template will be used to create new indices, while the new index template created by Depositor will be disregarded. This should give you more time to investigate the issue in production environments. Do not forget then to lower the priority in backup-lmio-tenant-events-eventlane-template back to 0.
The SSD storage is becoming full due to Elasticsearch
In this case, you need to adjust the lifecycle policy in the given event lane declaration (for example, fortigate.yaml) to move data from the hot to warm phase sooner. By default, the data becomes warm in 3 days. For more information on how to set custom lifecycle policy, see the Event Lane section.
What is the maximum index size, and how can I change it?
Depositor's default lifecycle policy has limit of 16 GB per primary shard per index, so the default maximum index size is thus 6 shards * 16 GB * 2 for replica = 192 GB per index.
To change the maximum index size, you need to specify a custom lifecycle policy within the event lane declaration (for example, fortigate.yaml), where you specify the max_primary_shard_size attribute. For more information on how to set a custom lifecycle policy, see the Event Lane section.
There is only lmio-tenant-events index with no number postfix, and it is not linked to any lifecycle policy
Every index managed by Depositor must end with -00000x, for instance lmio-tenant-events-eventlane-000001.
If it is not the case, please check both Docker logs and file logs (if file logs are configured). The Docker logs can be accessed via the following command:
docker logs -f -n 1000 <lmio-depositor>
Warning
There is no simple way to rename a preexisting index called lmio-tenant-events with no lifecycle policy to lmio-tenant-events-eventlane-000001. Hence, stop Depositor, delete the index lmio-tenant-events, then restart Depositor. Always check the logs every time you restart Depositor.
There is an index with "Index lifecycle error" and "no_node_available_exception", what happened?
This issue usually happens when Elasticsearch is restarted during the index's shrinking phase. The exact message is then: """NoNodeAvailableException[could not find any nodes to allocate index [myindex] onto prior to shrink]
In order to resolve the issue:
1. In Kibana, go to Management > Stack Management > Index management, then Indices, and select your index by clicking on its name.
2. In the index detail, click on Edit settings.
3. Inside, set the following values to null:
index.routing.allocation.require._name: null
index.routing.allocation.require._id: null
4. Click Save.
5. Go to Management > Dev Tools and run the following command, replacing myindex with the name of your index:
POST /myindex/_ilm/retry
6. Go back to Stack Management > Index management, Indices and check that the ILM error has disappeared for the given index.
There are many logs in others, and I cannot find the ones with the interface attribute
Kafka Console Consumer can be used to obtain events from multiple topics, here from all topics starting with events.
Next, you can grep the field in quotation marks:
/usr/bin/kafka-console-consumer --bootstrap-server localhost:9092 --whitelist "events.*" | grep '"interface"'
This command gives you all incoming logs with the interface attribute from all events topics.
Others Schema
Others schema specifies the schema for error events that occurred during parsing or storage process. It is derived from ECS schema naming.
---
define:
name: Others Schema
type: lmio/schema
fields:
_id:
type: "str"
representation: "base85"
docs: Unique identifier for the event, encoded in base85 format
'@timestamp':
type: "datetime"
docs: Timestamp when the others event occurred (this should be the current time)
event.ingested:
type: "datetime"
docs: Timestamp when the event was ingested
event.created:
type: "datetime"
docs: Timestamp when the event was created
event.original:
type: "str"
elasticsearch:
type: "text"
docs: Original unparsed event message
event.dataset:
type: "str"
docs: Dataset name for the event
error.code:
type: "str"
docs: https://www.elastic.co/guide/en/ecs/current/ecs-error.html#field-error-code
error.id:
type: "str"
docs: Unique identifier for the error
error.message:
type: "text"
elasticsearch:
type: "text"
docs: Error message details
error.stack_trace:
type: "text"
elasticsearch:
type: "text"
docs: Stack trace information for the error
error.type:
type: "str"
docs: Type of error encountered
tenant:
type: "str"
docs: Identifier for the tenant
Depositor internals
Translation table
The translation table from SP-Lang types to ElasticSearch types is part of the Depositor repository and container in lmiodepositor/elasticsearchartifacts/translation_table.json.
Datetime conversion
Depositor checks for fields in the events that have the type datetime in the schema.
If the value of the field is in SP-Lang datetime integers, the date is transformed to ISO format suitable for ElasticSearch.
However, before deployment, make sure the translation table mentioned above contains proper format definition.
Baseliner
LogMan.io Baseliner
TeskaLabs LogMan.io Baseliner is a microservice that, based on declarations, detects deviation from a calculated activity baseline.
A baseline is a set of calculated statistical metrics about the activity of a given entity for a given time period.
Examples of entities include: user, device, host server, dataset etc.
Note
If you upgrade baseliner to v24.07-beta or newer, the Baseliner will start the learning phase again. This is required due to the changed approach to database. The following updates from v24.07-beta will not require the learning phase to start again.
LogMan.io Baseliner configuration
LogMan.io Baseliner requires following dependencies:
- Apache ZooKeeper
- NGINX (for production deployments)
- Apache Kafka
- MongoDB with
/data/dbfolder mapped to SSD (/data/ssd/mongo/data) - Elasticsearch
- SeaCat Auth
- LogMan.io Library with
/Baselinesfolder and a schema in/Schemasfolder
MongoDB data folder location
When using Baseliner, MongoDB MUST have its data folder located on SSD/fast drive, not HDD. Having the MongoDB data folder located on HDD will result in all services using MongoDB slowing down.
Example
This is the most basic configuration required for each instance of LogMan.io Baseliner:
[declarations]
# The /Baselines is a default path
groups=/Baselines
[tenants]
ids=default
[pipeline:BaselinerPipeline:KafkaSource]
topic=^events.tenant.*
[pipeline:OutputPipeline:KafkaSink]
topic=complex.tenant
[zookeeper]
servers=zookeeper-1:2181,zookeeper-2:2181,zookeeper-3:2181
[library]
providers=zk:///library
[kafka]
bootstrap_servers=kafka-1:9092,kafka-2:9092,kafka-3:9092
[elasticsearch]
url=http://es01:9200/
[mongodb.storage]
mongodb_uri=mongodb://mongodb1,mongodb2,mongodb3/?replicaSet=rs0
mongodb_database=baseliners
[auth]
multitenancy=yes
public_keys_url=http://localhost:8081/openidconnect/public_keys
Zookeeper
Specify locations of the Zookeeper server in the cluster:
[zookeeper]
servers=zookeeper-1:2181,zookeeper-2:2181,zookeeper-3:2181
Hint
For non-production deployments, the use of a single Zookeeper server is possible.
Library
Specify the path(s) to the Library to load declarations from:
[library]
providers=zk:///library
Hint
Since ECS.yaml schema in /Schemas is utilized by default, consider using the LogMan.io Common Library.
Kafka
Define the Kafka cluster's bootstrap servers:
[kafka]
bootstrap_servers=kafka-1:9092,kafka-2:9092,kafka-3:9092
Hint
For non-production deployments, the use of a single Kafka server is possible.
ElasticSearch
Specify URLs of Elasticsearch master nodes.
Elasticsearch is necessary for using lookups, e.g. as a !LOOKUP expression or a lookup trigger.
[elasticsearch]
url=http://es01:9200
username=MYUSERNAME
password=MYPASSWORD
MongoDB
Specify the URL of the MongoDB cluster with a replica set.
MongoDB stores the baselines and counters of incoming events.
[mongodb.storage]
mongodb_uri=mongodb://mongodb1,mongodb2,mongodb3/?replicaSet=rs0
mongodb_database=baseliners
Auth
The Auth section enables multitenancy, restricting baseline access to only users with access to the specified tenant:
[auth]
multitenancy=yes
public_keys_url=http://localhost:8081/openidconnect/public_keys
Input
The events for the baselines are read from the Kafka topics:
[pipeline:BaselinerPipeline:KafkaSource]
topic=^events.tenant.*
Declarations (optional)
Define the path for baseline declarations. The default path is /Baselines, and the default fallback schema is /Schemas/ECS.yaml.
If you are using a schema other than ECS (the Elastic Common Schema), you can customize the schema path.
[declarations]
groups=/Baselines
schema=/Schemas/ECS.yaml
Tenants
Specify the tenant for which to create the baseline. You can list multiple tenants, separating IDs with a comma, but it is recommended to have just one tenant per baseline.
[tenants]
ids=tenant1
tenant_url=http://localhost:8080/tenant
It is recommended to run at least one instance of Baseliner per tenant. In most cases, a single instance per tenant is appropriate.
Output
If triggers are utilized, you can change the default topic for the output pipeline:
[pipeline:OutputPipeline:KafkaSink]
topic=complex.tenant
Web APIs
The Baseliner provides one web API.
The Web API is designed for communication with the UI.
[web]
listen=0.0.0.0 8999
The default port of the public web API is tcp/8999.
This port is designed to serve as the NGINX upstream for connections from Collectors.
Declarations for defining baselines
The declarations for baselines are loaded from the Library from the folder specified in the configuration, such as /Baseliners.
Note
The Baseliner uses /Schemas/ECS.yaml by default, so /Schemas/ECS.yaml must also be present in the Library.
Declaration
This is an example of a baseline definition, located in the /Baseliners folder in the Library:
---
define:
name: Dataset
description: Creates baseline for each dataset and trigger alarms if the actual number deviates
type: baseliner
baseline:
region: Czech Republic
period: day
learning: 4
classes: [workdays, weekends, holidays]
evaluate:
key: event.dataset
timestamp: "@timestamp"
analyze:
test:
!AND
- !LT
- !ARG VALUE
- 1
- !GT
- !ARG MEAN
- 10.0
trigger:
- event:
# Threat description
# https://www.elastic.co/guide/en/ecs/master/ecs-threat.html
threat.framework: "MITRE ATT&CK"
threat.indicator.sightings: !ITEM EVENT value
threat.indicator.confidence: "High"
threat.indicator.name: !ITEM EVENT dimension
- notification:
type: email
to: ["myemail@example.co"]
template: "/Templates/Email/Notification_baseliner_dimension.md"
variables:
name: "Logs are not coming to the dataset within the given UTC hour."
dimension: !ITEM EVENT dimension
hour: !ITEM EVENT hour
Sections
baseline
baseline: # (1)
region: Czech Republic #(2)
period: day # (3)
learning: 4 # (4)
classes: [workdays, weekends, holidays] # (5)
- Defines how the given baseline is built.
- Defines in which region the activity is happening (for calculating holidays and so on).
- Defines the timespan for the baseline. The period can be either
dayorweek. - Defines the number of periods (here day) that occur from the baseliner beginning to receive input until the user can see the baseline analysis. Additional details below.
- Define which days in the week we want to monitor. Classes can include any/all:
workdays,weekends, andholidays.
learning
The learning field defines the learning phase.
The learning phase is the time from the first occurrence of the dimension value in the input of the Baseliner instance until the point when the baseline is shown to the user and the analysis takes place. In the declaration, learning is the number of periods. The learning phase is calculated separately for holidays, weekends and working days. Baselines are rebuilt overnight (housekeeping).
In this example, the period is day, so learning is 4 days. Considering the calendar, a learning phase of 4 days beginning on Friday means 4 working days, and thus ends on Wednesday night.
predicate (optional)
The predicate section filters incoming events to be considered as activity in the baseline.
Write filters with TeskaLabs SP-Lang. Visit Predicates or the SP-Lang documentation for details.
evaluate
This section specifies which attributes from the event are going to be used in the baseline build.
evaluate:
key: event.dataset # (1)
timestamp: "@timestamp" # (2)
- Specifies the attribute/entity to monitor.
- Specifies the attribute in which the time dimension of the event activity is stored in.
analyze
The test section in analyze specifies when to run the trigger, if the actual activity (!ARG VALUE) deviates from the baseline. Write tests in SP-Lang.
analyze:
test:
!AND #(1)
- !LT #(2)
- !ARG VALUE # (3)
- 1
- !GT # (4)
- !ARG MEAN # (5)
- 10.0
- All expressions nested under
ANDmust be true for the test to pass. Here, if the value is less than 1 and the mean is greater than 10, the trigger is run. - "Less than"
- Get (
!ARG) the value (VALUE). If the value is less than1as specified, the!LTexpression is true. - "Greater than"
- Get (
!ARG) the mean (MEAN). If the mean is greater than10.0as specified, the!GTexpression is true.
The following attributes are available, used in SP-Lang notation:
TENANT: "str",
VALUE: "ui64",
STDEV: "fp64",
MEAN: "fp64",
MEDIAN: "fp64",
VARIANCE: "fp64",
MIN: "ui64",
MAX: "ui64",
SUM: "ui64",
HOUR: "ui64",
KEY: "str",
CLASS: "str",
trigger
The trigger section defines the activity that is triggered to run after a successful analysis. (More about triggers.)
Baseliner creates events
Upon every analysis (every hour), Baseliner creates an event to summarize its analysis. These Baseliner-created events are available to use (as EVENT) with expressions such as !ARG and !ITEM, meaning you can pull values from the events for your trigger activities.
These Baseliner-created events include the fields:
tenant
The name of the tenant the baseline belogs to.
dimension
The dimension the baseline belongs to, as specified in evaluate.
class
The class the baseline was calculated from.
Options include: workdays, weekends, and holidays
hour
The number of the UTC hour the analysis happend in.
value
The value of the current counter of events for the given UTC hour.
Notification trigger
A notification trigger sends a message, such as an email. See Email notifications for more details about sending email notifications and using email templates.
An example of a notification trigger:
trigger:
- notification:
type: email #(1)
to: ["myemail@example.co"] # (2)
template: "/Templates/Email/Notification_baseliner_dimension.md" # (3)
variables: # (4)
name: "Logs are not coming to the dataset within the given UTC hour."
dimension: !ITEM EVENT dimension # (5)
hour: !ITEM EVENT hour
- Specifies an email notification
- Recipient address
- Filepath to the email template in the LogMan.io Library
- Begins the section that gives directions for how to fill the blank fields from the email template. The blank fields in the template being used in this example are
name,dimension, andhour. - Uses SP-Lang to get information (
!ITEM) from the Baseliner-createdEVENT(detailed below). In this case, the template fielddimensionwill be filled with the value ofdimensiontaken from the Baseliner-created event.
Event trigger
You can use an event trigger to create a log or event, which you'll be able to see in the TeskaLabs LogMan.io UI.
Example of an event trigger:
- event: # (1)
threat.framework: "MITRE ATT&CK"
threat.indicator.sightings: !ITEM EVENT value
threat.indicator.confidence: "High"
threat.indicator.name: !ITEM EVENT dimension
- This new event is a threat description using threat fields from Elasticsearch
Analysis in UI
By default, the LogMan.io UI provides displays of analyses for user and host.
Specify the analysis in the schema (default: /Schemas/ECS.yaml) like this:
host.id:
type: "str"
analysis: host
user.id:
type: "str"
analysis: user
...
If then the tenant is configured to use this schema (ECS by default), the host.id and user.id fields in Discover will show a link to the given baseline.
Analysis host uses the baseline named Host by default:
---
define:
name: Host
Analysis user uses the baseline named User by default:
---
define:
name: User
If a specific analysis cannot locate its associated baseline, the UI will display an empty screen for that analysis.
Note
Both baselines needed for analysis are distributed as part of the LogMan.io Common Library.
Correlator
LogMan.io Correlator
TeskaLabs LogMan.io Correlator is a microservice responsible for performing detections and finding patters in data based on correlation rules.
LogMan.io Correlator is always deployed for a given tenant.
Important notes
-
Each correlator has mandatory sections in the configuration files, see Configuration section.
-
Correlator cannot work with correlation rules. See Window Correlator section for more information on how to create correlation rules.
LogMan.io Correlator Configuration
First it is needed to specify which library to load the declarations from, which can be either ZooKeeper or File.
[library]
providers=zk://library
ZooKeeper Library layer requires zookeeper configuration section.
[zookeeper]
servers=zookeeper-1:2181,zookeeper-2:2181,zookeeper-3:2181
Also, every running instance of the parser must know which groups to load from the libraries and which tenant it belongs to, see below:
# Tenant
[tenant]
ids=mytenant
# Declarations
[declarations]
groups=Firewall Common Authentication
# Complex event lane (optional)
[eventlane]
path=/EventLanes/mytenant/complex.yaml
groups - names of groups to be used from the library separated by spaces; if the group
is located within a folder's subfolder, use slash as a separator, f. e. /Correlators/Firewall
Next, it is needed to know which Kafka topics to use at the default fallback input and output (unless specified in the correlations in logsources section and complex event lane).
Kafka connection needs to be also configured to know which Kafka servers to connect to.
# Kafka connection
[kafka]
bootstrap_servers=lm1:19092;lm2:29092;lm3:39092
# The default Kafka topic to read from when no logsource is specified in the correlation rule (optional)
[pipeline:CorrelatorsPipeline:KafkaSource]
topic=lmio-events
group_id=lmio_correlator_firewall
# The default kafka topic for event trigger unless there is a complex event specified (optional)
[pipeline:OutputPipeline:KafkaSink]
topic=lmio-output
The last mandatory section specifies which Elasticsearch setting that allow to work with Lookups. For more information, see Lookups section.
# Lookup persistent storage
[elasticsearch]
url=http://elasticsearch:9200
Installation
Docker Compose
lmio-correlator:
image: docker.teskalabs.com/lmio/lmio-correlator:VERSION
volumes:
- ./lmio-correlator:/conf
- /data/ssd/lookups:/lookups
- /data/hdd/log/lmio-correlator:/log
- /data/ssd/correlators/lmio-correlator:/data
Replace lmio-correlator with the name of the correlator's instance.
The correlator needs to know its configuration path, path to lookups (the folder can be empty, depens if the lookups are used), logging path and the path to store its data.
Warning
The data path is mandatory and must be located on the fast drive, that is SSD.
Window Correlator
Window correlator detects incoming events based on the predicate section and stores them in data structures based on the evaluate section. If then the test rule in analyze section is matched, trigger section is called.
The following sample correlation detects more than or equal to 5 error connections between two IP addresses:
Sample
---
define:
name: "Network T1046 Network Service Discovery"
description: "Detects more than or equal to 5 error connections between two IP addresses"
type: correlator/window
logsource:
type: "Network"
mitre:
technique: "T1046"
tactic: "TA0007"
predicate:
!OR
- !EQ
- !ITEM EVENT log.level
- "error"
- !EQ
- !ITEM EVENT log.level
- "critical"
- !EQ
- !ITEM EVENT log.level
- "emergency"
evaluate:
dimension: [source.ip, destination.ip]
by: "@timestamp"
resolution: 60
analyze:
  window: hopping
aggregate: sum
span: 10
test:
!GE
- !ARG
- 5
trigger:
  - event:
threat.indicator.confidence: "Medium"
threat.indicator.ip: !ITEM EVENT source.ip
threat.indicator.port: !ITEM EVENT source.port
threat.indicator.type: "ipv4-addr"
Section define
This section contains the common definition and meta data.
Item name
Shorter human-readable name of this declaration.
Item type
The type of this declaration, must be correlator/window.
Item description (optional)
Longed, possibly multiline, human-readable description of the declaration.
Section logsource
Specifies the types of event lanes that should the incoming events be read from.
Section predicate
The predicate filters incoming events using an expression.
If the expression returns True, the event will enter evaluate section.
If the expression returns False, then the event is skipped.
Other returned values are undefined.
Include of nested predicate filters
Predicate filters are expressions located in a dedicated file, that can be included in many different predicates as their parts.
If you want to include an external predicate filter, located either in the library,
use !INCLUDE statement:
!INCLUDE /predicate_filter.yaml
where /predicate_filter is the path of the file in the library.
The content of predicate_filter.yaml is an expression to be included, like:
---
!EQ
- !ITEM EVENT category
- "MyEventCategory"
Section evaluate
The evaluate section specifies primary key, resolution and other attributes that are applied on the incoming event.
The evaluate function is to add the event into the two dimensional structure, defined by a time and a primary key.
Item dimension
Specifies simple or compound primary key (or dimension) for the event.
The dimension is defined by names of the input event fields.
Example of the simple primary key:
evaluate:
dimension: [source.ip]
Note
Tenant is added automatically to the dimension list.
Example of the compound primary key:
evaluate:
dimension: [source.ip, destination.ip]
If exactly one dimension like DestinationHostname is a list in the original event
and the correlation should happen for each one of the dimension values, the dimension should be wrapped in [ ]:
evaluate:
dimension: [source.ip, destination.ip, [DestinationHostname] ]
Item by
Specified the name of the field of the input event that contains a date/time information, which will be used for evaluation. Default is: @timestamp.
Item event_count (optional)
Name of the attribute, that specifies the count for correlation within one event, hence influencing the "sum of events" in analysis. Defaults to 1.
Item resolution
Specifies the resolution of the time aggregation of the correlator. The unit is seconds.
evaluate:
resolution: 3600 # 1 hour
Default value: 3600
Item saturation (optional)
Specifies the duration of the silent time interval after the trigger is fired.
It is specific for the dimension.
The unit is resolution.
Default value: 3
Section analyze (optional)
The section analyze contains the configuration of the time window that is applied on the input events.
The result of the time window analysis is subjected to the configurable test. When the test is successful (aka returns True), the trigger is fired.
Note: The section is optional, the default behavior is to fire the trigger when there is at least one event in the tumbling of the span equals 2.
Item when (optional)
Specifies when the analysis of the events in the windows should happen.
Options:
event(default): Analysis happens after an event comes and is evaluated, usually useful for match and arithmetic correlationperiodic/...: Analysis happens after a specified interval in seconds, such asperiodic/10(every 10 seconds),periodic/1h(every 3600 seconds / one hour) etc. Usually useful for UEBA evaluation.
Periodic analysis requires the time window resolution and span to be set properly, so the analysis does not happen too often.
Item window (optional)
Specifies what kind of time window to use.
Options:
tumbling: Fixedspan(duration), non-overlapping, gap-less contiguous time intervalshopping: Fixedspan(duration), overlapping windows contiguous time intervals
Default value: hopping
Item span
Specifies the width of the window.
The unit is resolution.
Item aggregate (optional)
Specifies what aggregation functions to be applied on events in the window.
Aggegate functions
sum: Summationmedian: Medianaverage: The (weighted) averagemean: The arithmetic meanstd: The standard deviationvar: The variancemean spike: For spike detection. The baseline is mean value, return the percentage.median spike: For spike detection. The baseline is median value, return the percentage.unique count: For a unique count of the event attribute(s):dimensionhas to be provided.
Default value: sum
Example of the unique count:
analyze:
window: hopping
aggregate: unique count
dimension: client.ip
span: 6
test:
!GE
- !ARG
- 5
Trigger when 5 and more unique client.ips are observed.
Item test (optional)
The test is an expression that is applied on the output of the aggregate calculation.
If the expression returns True, the trigger will be fired if a dimension is not already saturated.
If the expression returns False, then no action is taken.
Other returned values are undefined.
Section trigger
The trigger section specifies what kinds of actions to be taken when the trigger is fired by test in the analyze section.
See correlator triggers chapter for details.
Stashing Correlator
In the field of cybersecurity, a stashing correlator is a tool that collects and temporarily stores related events based on specific identifiers, such as message IDs. This process helps track and analyze sequences of events over time, allowing for the identification of patterns or anomalies that may indicate security threats. By grouping related events, the stashing correlator enhances the ability to monitor and respond to potential cyber incidents, providing a comprehensive view of activities that may not be apparent when examining individual events alone.
Analogy for Better Understanding
Think of the stashing correlator as a detective piecing together clues from different sources. Imagine a detective gets two notes: one with a person's name and another with their location. Individually, these notes don't give much information, but the detective notices both notes have the same case number (ID). The detective combines them to understand who is where. Similarly, the stashing correlator joins related events using a common attribute, like an ID, to create a complete picture for further analysis.
Example Scenario
Imagine you receive two pieces of mail: one telling you who sent a letter and the other telling you who received it. Individually, these pieces of mail don't provide the full picture. The stashing correlator is like a smart assistant that notices both pieces have the same tracking number (message ID) and combines them into one comprehensive record, showing both the sender and the recipient. This helps in understanding the full context of the communication.
Consider the following logs from a Postfix event lane for a given tenant:
June 14 09:19:21 alice postfix/qmgr[59833]: F3710A248D: from=<alice@example.com>, size=304, nrcpt=1 (queue active)
June 14 09:19:21 alice postfix/local[60446]: F3710A248D: to=<bob@example.com>, orig_to=<alice>, relay=local, delay=0.04, delay>
These logs are processed separately by LogMan.io Parsec. The first log indicates who sent the email (alice@example.com), and the second log shows the recipient (bob@example.com). The parsed logs look like this:
# Log #1
{
"email.message_id": "F3710A248D",
"email.from.address": ["alice@example.com"],
...
}
# Log #2
{
"email.message_id": "F3710A248D",
"email.to.address": ["bob@example.com"],
...
}
To connect all the information for future analysis, it is necessary to consolidate the events into a single log that contains both the sender and recipient information. The stashing correlator performs this task by joining the parsed events using a common attribute, such as the message ID (F3710A248D). If no other event with the same message ID arrives within the send_after_seconds period, a new event is created that includes all the gathered information:
# Stashed log
{
"email.message_id": "F3710A248D",
"email.from.address": ["alice@example.com"],
"email.to.address": ["bob@example.com"],
...
}
This consolidated log can then be analyzed by other detection correlators, such as the Window Correlator, to further investigate and respond to potential security incidents.
Sample
The following sample stashes events by their message IDs and sends them after 10 seconds of no activity:
---
define:
name: "Stashing events by message ID"
description: "Example for stashing events by message ID"
type: correlator/stashing
logsource:
vendor: [WietseVenama]
predicate:
!IN
what: message.id
where: !EVENT
stash:
dimension: message.id
send_after_seconds: 10 # Send the stashed message after seconds with no activity
Section define
This section contains the common definition and metadata.
Item name
Shorter human-readable name of this declaration.
Item type
The type of this declaration, must be correlator/stashing.
Item description (optional)
Longer, possibly multiline, human-readable description of the declaration.
Section logsource
Specifies the sources of the logs, indicating the vendors or products whose events coming from event lanes will be processed.
Section predicate
The predicate filters incoming events using an expression. If the expression returns !!true, the event will enter the stash section. If !!false, the event is skipped.
Include of nested predicate filters
Predicate filters are expressions located in a dedicated file, that can be included in many different predicates as their parts.
To include an external predicate filter:
!INCLUDE /predicate_filter.yaml
where /predicate_filter is the path of the file in the library.
Section stash
Specifies the stashing behavior, including the dimension for grouping events and the timeout for sending stashed events after inactivity.
Item dimension
Specifies the primary key (or dimension) for the event. Defined by names of the input event fields.
Example of a primary key:
stash:
dimension: [message.id]
Item send_after_seconds
Specifies the timeout for sending stashed events after a period of inactivity. The unit is seconds.
stash:
send_after_seconds: 10 # 10 seconds
Summary
In summary, the stashing correlator acts as a smart organizer, collecting and joining related events to create a full picture for further analysis. This helps in identifying patterns and anomalies in cybersecurity, providing a more effective way to monitor and respond to potential incidents.
Entity Correlator
Window correlator detects incoming events based on the predicate section and stores them in data structures based on the evaluate section. If the dimension detected from the event does not produce any data, lost in the triggers section is called, otherwise seen in triggers section is called.
Example
define:
name: Detection of user entity behavior
description: Detection of user entity behavior
type: correlator/entity
span: 5
delay: 5m # analysis time = delay + resolution
logsource:
vendor: "Microsoft"
predicate:
!AND
- !EQ
- !ITEM EVENT message
- "FAIL"
- !EQ
- !ITEM EVENT device.vendor
- "Microsoft"
- !EQ
- !ITEM EVENT device.product
- "Exchange Server"
evaluate:
dimension: [source.user]
by: @timestamp # Name of event field with an event time
resolution: 60 # unit is second
lookup_seen: active_users
lookup_lost: inactive_users
triggers:
lost:
- event:
severity: "Low"
seen:
- event:
severity: "Low"
Section define
This section contains the common definition and meta data.
Item name
Shorter human-readable name of this declaration.
Item type
The type of this declaration, must be correlator/entity.
Item span
Specifies the width of the window.
The unit is resolution.
Item delay (optional)
Analysis happens after a specified period in seconds and this period is based on resolution.
If there is a need to prolong the period and hence delay the analysis, delay option can be specified, such as 300 (300 seconds), 1h (3600 seconds / one hour) etc.
Item aggregation_count_field
Name of the attribute, that specifies the number of events within one aggregated event, hence influencing the sum of events in analysis. Defaults to 1.
Item description (optional)
Longed, possibly multiline, human-readable description of the declaration.
Section logsource
Specifies the types of event lanes that should the incoming events be read from.
Section predicate (optional)
The predicate filters incoming events using an expression.
If the expression returns True, the event will enter evaluate section.
If the expression returns False, then the event is skipped.
Other returned values are undefined.
Section evaluate
The evaluate section specifies primary key, resolution and other attributes that are applied on the incoming event.
The evaluate function is to add the event into the two dimensional structure, defined by a time and a primary key.
Item dimension
Specifies simple or compound primary key (or dimension) for the event.
The dimension is defined by names of the input event fields.
Example of the simple primary key:
evaluate:
dimension: [source.ip]
Note
Tenant is added automatically to the dimension list.
Example of the compound primary key:
evaluate:
dimension: [source.ip, destination.ip]
If exactly one dimension like DestinationHostname is a list in the original event
and the correlation should happen for each one of the dimension values, the dimension should be wrapped in [ ]:
evaluate:
dimension: [source.ip, destination.ip, [DestinationHostname] ]
Item by
Specified the name of the field of the input event that contains a date/time information, which will be used for evaluation. Default is: @timestamp.
Item resolution (optional)
Specifies the resolution of the time aggregation of the correlator. The unit is seconds.
evaluate:
resolution: 3600 # 1 hour
Default value: 3600
Item lookup_seen
lookup_seen specifies the lookup ID where to write seen entities with the last seen time
Item lookup_lost
lookup_lost specifies the lookup ID where to write lost entities with the last analysis time
Section triggers
The triggers section specifies kinds of actions to be taken when the periodic analysis happens.
The supported actions are lost and seen.
See correlator triggers chapter for details.
seen triggers
Seen triggers are executed when the analysis finds events, that entered the window in the analyzed time.
The dimension (entity name) can be obtained via !ITEM EVENT dimension.
Timestamp of the last event, that came to the window in the specified dimension, can be obtained via !ITEM EVENT last_event_timestamp (entity updated).
Example:
seen:
- lookup: user_inventory
key: !ITEM EVENT dimension
set:
last_seen: !ITEM EVENT last_event_timestamp
lost triggers
Lost triggers are executed when the analysis discovers, that no events came to the specified dimension in the analyzed time (entity drop).
The dimension (entity name) can be obtained via !ITEM EVENT dimension.
Example:
lost:
- event:
severity: "Low"
dimension: !ITEM EVENT dimension
Match Correlator
Match correlator detects incoming events based on the predicate section. If the event matches the predicate filter, trigger section is called.
Hint
Always consider using Window Correlator instead of Match Correlator, as Match Correlator produces one output event per one input event and so does not do any grouping of incoming events based on time.
Sample
---
define:
name: "Network T1046 Network Service Discovery"
description: "Detects a connection between two IP addresses"
type: correlator/match
logsource:
type: "Network"
mitre:
technique: "T1046"
tactic: "TA0007"
predicate:
!OR
- !EQ
- !ITEM EVENT log.level
- "error"
- !EQ
- !ITEM EVENT log.level
- "critical"
- !EQ
- !ITEM EVENT log.level
- "emergency"
trigger:
  - event:
threat.indicator.confidence: "Medium"
threat.indicator.ip: !ITEM EVENT source.ip
threat.indicator.port: !ITEM EVENT source.port
threat.indicator.type: "ipv4-addr"
Section define
This section contains the common definition and meta data.
Item name
Shorter human-readable name of this declaration.
Item type
The type of this declaration, must be correlator/match.
Item description (optional)
Longed, possibly multiline, human-readable description of the declaration.
Section logsource
Specifies the types of event lanes that should the incoming events be read from.
Section predicate
The predicate filters incoming events using an expression.
If the expression returns True, the event will enter trigger section.
If the expression returns False, then the event is skipped.
Other returned values are undefined.
Section trigger
The trigger section specifies what kinds of actions to be taken when the trigger is fired by success result in predicate section.
See correlator triggers chapter for details.
Triggers
Triggers define output of correlators, baselines etc.
They live in the trigger section of the correlator.
Each rule in the library can define many triggers (it is a list).
The trigger can access the original event by !EVENT statement, it is the last event that passed evaluation test.
The value from the aggregator function is availabe at !ARG.
event trigger
This trigger inserts a new event into the complex event lane.
Example of the event trigger:
trigger:
- event:
threat.indicator.confidence: "Medium"
threat.indicator.ip: !ITEM EVENT source.ip
threat.indicator.port: !ITEM EVENT source.port
threat.indicator.type: "ipv4-addr"
There may be up to 5 results, like in mean spike aggregator:
trigger:
- event:
events: !ARG EVENTS
MeanSpike:
!GET
from: !ARG RESULTS
what: 0
MeanSpikeLastCount:
!GET
from: !ARG RESULTS
what: 1
MeanSpikeMean:
!GET
from: !ARG RESULTS
what: 2
lookup trigger
Lookup trigger manipulates with the content of the lookup. It means that it can add (set), increment (add), decrement (sub) and remove (delete) an entry in the lookup.
The entry is identified by a key, which is a unique primary key.
Example of the trigger that adds an entry to the lookup user_list:
trigger:
- lookup: user_list
key: !ITEM EVENT user.name
set:
score: 1
Example of the trigger that removes an entry from the lookup user_list:
trigger:
- lookup: user_list
delete: !ITEM EVENT user.name
Example of the trigger that increments a counter (field my_counter) in the entry of the lookup user_list:
trigger:
- lookup: user_list
key: !ITEM EVENT user.name
add: my_counter
Example of the trigger that decrements a counter (field my_counter) in the entry of the lookup user_list:
trigger:
- lookup: user_list
key: !ITEM EVENT user.name
sub: my_counter
If the counter field does not exist, it is created with the default value of 0.
notification trigger
This trigger inserts a new notification into the primary data path, that is read by asab-iris.
Example of the notification trigger:
- notification:
type: email
template: "/Templates/Email/notification_4728.md"
to: eliska.novotna@teskalabs.com
variables:
name: "brute-force"
events: !ARG
Alerts
LogMan.io Alerts
TeskaLabs LogMan.io Alerts is a microservice responsible for managing alert/incident tickets, providing an API and Kafka handler through the lmio-alerts topic.
LogMan.io Alerts configuration
LogMan.io Alerts has the following dependencies:
- Apache ZooKeeper
- NGINX (for production deployments)
- Apache Kafka
- MongoDB
- Elasticsearch
- TeskaLabs SeaCat Auth
- LogMan.io Library with an
/Alertsfolder and a schema in the/Schemasfolder
Example
This example is the most basic configuration required for LogMan.io Alerts:
[zookeeper]
servers=zookeeper-1:2181,zookeeper-2:2181,zookeeper-3:2181
[library]
providers=zk:///library
[kafka]
bootstrap_servers=kafka-1:9092,kafka-2:9092,kafka-3:9092
[elasticsearch]
url=http://es01:9200/
[asab:storage]
mongodb_uri=mongodb://mongodb1,mongodb2,mongodb3/?replicaSet=rs0
[auth]
multitenancy=yes
public_keys_url=http://localhost:8081/openidconnect/public_keys
Zookeeper
Specify locations of Zookeeper servers in the cluster.
[zookeeper]
servers=zookeeper-1:2181,zookeeper-2:2181,zookeeper-3:2181
Hint
For non-production deployments, the use of a single Zookeeper server is possible.
Library
Specify the path(s) to the Library from which to load declarations.
[library]
providers=zk:///library
Hint
Since the ECS.yaml schema in /Schemas is utilized by default, consider using the LogMan.io Common Library.
Kafka
Specify bootstrap servers of the Kafka cluster.
[kafka]
bootstrap_servers=kafka-1:9092,kafka-2:9092,kafka-3:9092
Hint
For non-production deployments, the use of a single Kafka server is possible.
ElasticSearch
Specify URLs of Elasticsearch master nodes.
Elasticsearch is used to load events associated with a ticket.
[elasticsearch]
url=http://es01:9200/
username=MYUSERNAME
password=MYPASSWORD
MongoDB
Specify the URL of the MongoDB cluster with replica set.
Tickets are stored to MongoDB.
[asab:storage]
type=mongodb
mongodb_uri=mongodb://mongodb1,mongodb2,mongodb3/?replicaSet=rs0
Auth
The Auth section ensures that users can access only their own assigned tenants to set up alerts, supporting multitenancy.
It also checks for the resources mentioned in the alert/incident workflow declaration.
[auth]
multitenancy=yes
public_keys_url=http://localhost:8081/openidconnect/public_keys
Input
The Alerts microservice contains a Kafka interface that reads incoming alerts from the lmio-alerts topic. The topic name or the group ID can be changed using:
[pipeline:TicketPipeline:KafkaSource]
topic=lmio-alerts
group_id=lmio-alerts
Note
Changing the input topic for alerts is discouraged to avoid unnecessary complications.
Output for event trigger
[pipeline:OutputPipeline:KafkaSink]
topic=lmio-events-complex
Warning
The event trigger should not be used in any alert's workflow declarations. Use notifications instead.
Worfklow
The location of workflows for alerts and incidents is always /Alerts/Workflow.
Web APIs
Alerts provides one web API.
The web API is designed for communication with the UI.
[web]
listen=0.0.0.0 8953
The default port of the public web API is tcp/8953.
This port is designed to serve as the NGINX upstream for connections from collectors.
Workflow
Workflow in Alerts
TeskaLabs LogMan.io Alerts reads the following workflows:
/Alerts/Workflow/alert.yaml: Workflow used for tickets with the typealert/Alerts/Workflow/incident.yaml: Workflow used for tickets with the typeincident
Declaration
This is the most basic possible example of a workflow definition, located in the /Alerts/Workflow folder in the Library:
---
define:
type: alerts/workflow
workflow:
open:
label: "Open"
transitions:
triaged:
resources: lmio:alert:triaged-to-new
closed: {}
triaged:
label: "Triaged"
transitions:
closed: {}
closed:
label: "Closed"
trigger:
...
The workflow specifies the states the given ticket may enter, with the first one being the one the newly created ticket is assigned with.
Each state (here open, triaged, and closed) contains the following attributes:
Label
The label attribute is a string shown to the user in the UI.
Transitions
Defines possible transitions to other states. The states are listed below with either an empty braces {} dictionary as the value, or the name or list of the resource(s) the given user must be assigned to in order to move the ticket to the state specified by the transition.
When a ticket changes its state, a trigger (if specified) section is called.
Taxonomy of alerts
TeskaLabs LogMan.io provides a taxonomy for organizing and managing the various artifacts generated within the system, making it easier for cybersecurity analysts to prioritize their workload and respond effectively to security threats.
The taxonomy is organized into following tree:
- Event
- Log
- Complex
- Ticket
- Alert
- Incident
Here is the explanation of each category and their subcategories:
Event
Events are records of activities that occur within an organization's network, systems, or applications.
Events can be further classified into:
Log
Logs are basic records generated by various devices, systems, or applications that store information about their activity. Examples include firewall logs, server logs, or application logs. These logs help analysts understand what is happening within the organization's environment and can be used for detecting security threats and anomalies.
Complex
Complex events refer to correlated or aggregated events that may indicate a security incident or require further analysis. They are generated by correlators and other detectors that gather events from various sources, analyze them, and create alerts based on predefined rules or machine learning algorithms.
Ticket
Tickets are created by cyber security analysts or automated correlators and detectors to track and manage security events that require attention. The ticket can refer to zero, one or more events.
Tickets can be further classified into:
Alert
Alerts are generated when a specific event, series of events, or anomaly is detected that may indicate a potential security threat. Alerts typically require immediate attention from cybersecurity analysts to triage, investigate, and determine if the ticket is a genuine security incident.
Incident
Incidents are confirmed security events that have been investigated and classified as genuine threats. They represent a higher level of severity than alerts and often involve a coordinated response from multiple teams, such as incident response or network administration, to contain, remediate, and recover from the threat.
Lookups
Lookups
Lookups are dictionaries of entities with attributes that are relevant either for parsing or for detection of cybersecurity incidents.
Lookups can be:
- A simple list of suspicious IP addresses, active VPN connections, etc.
- Dictionaries of user names with user attributes like user.id, user.email, etc.
- Dictionaries of compound keys like IP address and user name combinations for monitoring user activity.
What do lookups do?
Lookups, being like dictionaries, contain additional useful information about the data you already have that can make your logs more informative and valuable.
A simple example:
Your organization has logs about sent emails, which include the email address of the sender.
However, you want the logs in your LogMan.io UI to include the sender’s name, not just their email address.
So, you have a lookup in which each item is an employee's email address with the employee's name associated.
If you use this lookup in the enrichment part of the parsing process, the parser “looks up” the employee’s name based on their email address in this dictionary-like lookup and includes the employee’s name in the log.
Quickstart
In order to set up lookups:
- Create a lookup declaration in the LogMan.io Library (the lookup description)
- Create the lookup and its content in the Lookups section in the UI (the lookup content)
- Add the lookup to the relevant parsing and/or correlation rules in the Library (the lookup application)
Note
Make sure all relevant components are deployed, see Deployment.
Declarations
All lookups are defined by their declarations stored in the /Lookups folder.
The naming convention for declarations is lookupname.yaml, for instance myuserlookup.yaml:
---
define:
type: lookup
name: myuserlookup
keys:
- name: userid
type: str
fields:
username:
type: str
In define, specify the lookup type, lookup name (tenant information will be added automatically), keys with their names (optional) and types and fields in the output record structure. The record structure is NOT based on a schema and should NOT contain periods.
Note
Names of keys and fields cannot contain special characters like a period, etc.
Lookup types
Generic lookups
Generic lookups serve to create list of keys or key-value pairs. The type in the declaration in the define section is just lookup:
---
define:
type: lookup
...
When it comes to parsing, generic lookups can be used only in the standard enricher with the !LOOKUP expression.
For more information about generic Lookups, see Generic Lookups.
IP address lookups
IP address Range Lookup
IP address Range Lookup uses the IP address ranges, such as 192.168.1.1 to 192.168.1.10, as keys.
The declaration of an IP address range lookup must contain type lookup/ipaddressrange in the define section and two keys with type ip in the keys section:
define:
type: lookup/ipaddressrange
name: mylookup
group: mygroup
keys:
- name: range1
type: ip
- name: range2
type: ip
fields:
...
Single IP address lookup
A single IP address lookup is a lookup that has exactly one IP address key with type ip that can be associated with an optional and variable number of attributes, defined by none or multiple values under fields.
In order to use single IP lookups together with the following enrichers, the type of the lookup in the define section must always be lookup/ipaddress.
---
define:
type: lookup/ipaddress
name: mylookup
group: mygroup
keys:
- name: sourceip
type: ip
fields:
...
For more information about IP address lookups, see IP Address Lookups.
MAC address lookups
MAC address range lookup
The MAC address range lookup uses the MAC address ranges, such as 0c:12:30:00:00:01 to 0c:12:30:00:00:ff, as keys.
The declaration of an MAC address range lookup must contain type lookup/macaddressrange in the define section and two keys with type mac in the keys section:
define:
type: lookup/macaddressrange
name: mylookup
group: mygroup
keys:
- name: range1
type: mac
- name: range2
type: mac
fields:
...
Single MAC address lookup
A single MAC address lookup is a lookup that has exactly one MAC address key with type mac that can be associated with an optional and variable number of attributes, defined by none or multiple values under fields.
In order to use single MAC lookups together with the following enrichers, the type of the lookup in the define section must always be lookup/macaddress.
---
define:
type: lookup/macaddress
name: mylookup
group: mygroup
keys:
- name: sourcemac
type: mac
fields:
...
For more information about MAC address lookups, see MAC Address Lookups.
Deployment
Design
lmio-watcher
LogMan.io Watcher manages the content of lookups in Elasticsearch. Watcher reads the lookup events from HTTP(S) API and Kafka.
lmio-lookupbuilder
LogMan.io Lookup Builder takes generic lookup contents from Elasticsearch and lookup declarations from the Library and builds lookup binary files. The lookup binary files are then used by other microservices such as LogMan.io Parsec, LogMan.io Correlator, etc.
lmio-ipaddrproc
LogMan.io IP Address Processor takes IP address lookup contents from Elasticsearch and lookup declarations from thè Library and builds IP lookup binary files. The IP lookup binary files are then used by other microservices such as LogMan.io Parsec, LogMan.io Correlator, etc. It also downloads built-in lookups from Azure storage from the internet.
Step-by-step guide
In order to work with lookups, follow these deployment steps. For more information about what lookups are and what they are used for, go to Lookups.
-
At every machine within the LogMan.io cluster, deploy one instance of LogMan.io Watcher.
-
At every machine within the LogMan.io cluster, deploy one instance of
lmio-lookupbuilder.The information about configuration and records in Docker Compose is located in the Configuration section.
-
At every machine within the LogMan.io cluster, deploy one instance of
lmio-ipaddrprocThe information about configuration and records in Docker Compose is located in the Configuration section.
-
Add the path to the
/lookupsfolder to the Docker Compose volumes section of every instance of LogMan.io Parsec, LogMan.io Correlator, LogMan.io Alerts, and LogMan.io Baseliner. The path is by default:volumes: - /data/ssd/lookups:/lookups -
Include LogMan.io Watcher in the configuration file of every NGINX instance as a location record to
/api/lmio-lookups:location /api/lmio-lookup { auth_request /_oauth2_introspect; rewrite ^/api/lmio-lookup/(.*) /$1 break; proxy_pass http://lmio-watcher; }Notice the proxy_pass that points to
lmio-watcherupstream, which should be defined at the top of each NGINX configuration file:upstream lmio-watcher { server HOSTNAME_OF_FIRST_SERVER_IN_THE_CLUSTER:8952 max_fails=0 fail_timeout=30s; server HOSTNAME_OF_SECOND_SERVER_IN_THE_CLUSTER:8952 max_fails=0 fail_timeout=30s; server HOSTNAME_OF_THIRD_SERVER_IN_THE_CLUSTER:8952 max_fails=0 fail_timeout=30s; }Replace
HOSTNAME_OF_FIRST_SERVER_IN_THE_CLUSTER,HOSTNAME_OF_SECOND_SERVER_IN_THE_CLUSTER,HOSTNAME_OF_THIRD_SERVER_IN_THE_CLUSTERwith the hostnames of the servers that LogMan.io Watcher is deployed to in the LogMan.io cluster environment.That's it! Now you are ready to create lookup declarations and lookup content. Go back to Lookups for next steps.
Configuration
lmio-lookupbuilder
LogMan.io Lookup Builder takes generic lookup contents from Elasticsearch and lookup declarations from Library and builds lookup binary files. The lookup binary files are then used by other microservices such as LogMan.io Parsec, LogMan.io Correlator, etc.
LogMan.io Lookup Builder has the following dependencies:
- Elasticsearch
- Zookeeper
- Library
- Tenants to build lookups for
Docker Compose
lmio-lookupbuilder:
network_mode: host
image: docker.teskalabs.com/lmio/lmio-lookupbuilder:VERSION
volumes:
- ./lmio-lookupbuilder:/conf
- /data/ssd/lookups:/lookups
restart: always
logging:
options:
max-size: 10m
Configuration file
This is the most basic required configuration:
[tenants]
ids=mytenant
[elasticsearch]
url=http://es01:9200/
username=MYUSERNAME
password=MYPASSWORD
[zookeeper]
servers=zookeeper-1:2181,zookeeper-2:2181,zookeeper-3:2181
[library]
providers=zk:///library
Alternatively, instead of specifying tenant ids directly you can add all tenants from the LogMan.io cluster with the following configuration:
[tenants]
tenant_url=http://<SEACAT_AUTH_NODE>:3081/tenant
Replace <SEACAT_AUTH_NODE> with the hostname where SeaCat Auth service runs.
lmio-ipaddrproc
LogMan.io IP Address Processor takes IP adress lookup contents from Elasticsearch and lookup declarations from the Library and builds IP lookup binary files. The IP lookup binary files are then used by other microservices such as LogMan.io Parsec, LogMan.io Correlator, etc. It also downloads built-in lookups from Azure storage from the internet.
LogMan.io IP Address Processor has the following dependencies:
- ElasticSearch
- Zookeeper
- Library
- Tenants to build lookups for
Docker Compose
lmio-ipaddrproc:
network_mode: host
image: docker.teskalabs.com/lmio/lmio-ipaddrproc:VERSION
volumes:
- ./lmio-ipaddrproc:/conf
- /data/ssd/lookups:/lookups
restart: always
logging:
options:
max-size: 10m
Configuration file
This is the most basic required configuration:
[tenants]
ids=mytenant
[elasticsearch]
url=http://es01:9200/
username=MYUSERNAME
password=MYPASSWORD
[zookeeper]
servers=zookeeper-1:2181,zookeeper-2:2181,zookeeper-3:2181
[zookeeper]
servers=zookeeper-1:2181,zookeeper-2:2181,zookeeper-3:2181
[library]
providers=zk:///library
Alternatively, instead of specifying tenant ids directly you can add all tenants from the LogMan.io cluster with the following configuration:
[tenants]
tenant_url=http://<SEACAT_AUTH_NODE>:3081/tenant
Replace <SEACAT_AUTH_NODE> with the hostname where SeaCat Auth service runs.
Generic lookups
TeskaLabs LogMan.io generic lookups serve to create lists of keys or key-value pairs. The type in the declaration in the define section is just lookup:
---
define:
type: lookup
...
When it comes to parsing, generic lookups can be used only in the standard enricher with the !LOOKUP expression.
Creating a generic lookup
There are always three steps to enable lookups:
- Create a lookup declaration in the LogMan.io Library (the lookup description)
- Create the lookup and its content in the Lookups section in the UI (the lookup content)
- Add the lookup to the relevant parsing and/or correlation rules in the Library (the lookup application)
Use case: User lookup
A user lookup is used to get user information such as username and email by the user ID.
-
In LogMan.io, go to the Library.
-
In the Library, go to the folder
/Lookups. -
Create a new lookup declaration for your lookup, such as "userlookup.yaml", making sure the file has a YAML extension
-
Add the following declaration:
define: type: lookup name: userlookup group: user keys: - name: userid type: str fields: user_name: type: str email: type: strMake sure the
typeis alwayslookup.Change the
namein thedefinesection to your lookup name.The
groupis used then in the enrichment process to locate all lookups that share the same group. The value is a unique identifier of the group (use case), here:userThe following types are supported for
keys:str,ip,mac,ui64.To
fields, add names and types of the lookup attributes. This example usesuser_nameandemailas strings.Currently, these types are supported:
str,fp64,si32,geopoint, andip. -
Save the declaration.
-
In LogMan.io, go to Lookups.
-
Create a new lookup with the same name as above, i.e. "userlookup". Specify the user ID as the key.
-
Create records in the lookup with the user ID as the key and fields as specified above.
-
Add the following enricher to the LogMan.io Parsec rule that should utilize the lookup:
define: type: enricher/standard enrich: user_name: !GET from: !LOOKUP what: userlookup what: !GET from: !EVENT what: user.idThis sample enricher obtains
user_namefrom theuserlookupbased on theuser.idattribute from the parsed event.
IP address lookups
TeskaLabs LogMan.io offers an optimized set of lookups for IP addresses, called IP Lookups.
There are always three steps to enable IP Lookups:
- Create a lookup declaration in the LogMan.io Library (the lookup description)
- Create the lookup and its content in the Lookups section in the UI (the lookup content)
- Add the lookup to the relevant parsing and/or correlation rules in the Library (the lookup application)
IP address to geographical location lookup
IP Geo Location is when, based on IP address range such as 192.168.1.1 to 192.168.1.10, you want to obtain the geographic location of the IP address such as city name, latitude, longitude etc.
Built-in IP address to geographical location lookup
When the IP address from the event does not match any of the provided geo lookups, the default public IP lookup provided by TeskaLabs LogMan.io will be used.
-
In LogMan.io, go to the Library.
-
In the Library, go to the folder
/Lookups. -
Create a new lookup declaration for your lookup, like "ipgeolookup.yaml" with a YAML extension
-
Add the following declaration:
define: type: lookup/ipaddressrange name: ipgeolookup group: geo keys: - name: range1 type: ip - name: range2 type: ip fields: location: type: geopoint value: lat: 50.0643081 lon: 14.443938 city_name: type: strMake sure the
typeis alwayslookup/ipaddressrange.Change the
namein thedefinesection to your lookup name.The
groupis used then in the enrichment process to locate all lookups that share the same group. The value is a unique identifier of the group (use case), here:geoKeep the keys as they are in order to specify ranges.
To
fields, add names and types of the lookup attributes. Here in the example there is only city, but there can also be location (geolocation latitude and longitude) etc:fields: name: type: str continent_name: type: str city_name: type: str location: type: geopointWhen using the Elastic Common Schema (ECS), all available geo fields that can be used are specified in the documentation: https://www.elastic.co/guide/en/ecs/current/ecs-geo.html
The
valueattribute will be used as default.Currently, these types are supported:
str,fp64,si32,geopoint, andip -
Save
-
In LogMan.io, go to Lookups.
-
Create a new lookup with the same name as above, i.e. "ipgeolookup". Specify two keys with the names:
range1,range2. -
Create records in the lookup with the ranges as keys and fields as specified above (in the example, there is only city in the value dictionary stored in the lookup).
-
Add the following enricher to the LogMan.io Parsec rule that should utilize the lookup:
define: type: enricher/ip group: geo schema: ecs: postfix: geo.Specify the group of the lookups to be used in the
groupattribute. It should be the same as the group mentioned above in the lookup declaration. Tenants are resolved automatically.The enrichment is done on every field that has the type
ipin the schema.Postfix specifies the postfix for the attribute:
If input is
source.ipThen output is
source.geo.<NAME_OF_THE_ATTRIBUTE>When it comes to default public GEO lookup (see above), the following items are filled by default:
city_name: type: str country_iso_code: type: str location: type: geopoint region_name: type: str
IP address range lookup
The IP address range lookup uses the IP address ranges, such as 192.168.1.1 to 192.168.1.10, as keys.
The declaration of an IP address range lookup must contain type lookup/ipaddressrange in the define section and two keys with type ip in the keys section:
define:
type: lookup/ipaddressrange
name: mylookup
group: mygroup
keys:
- name: range1
type: ip
- name: range2
type: ip
fields:
...
Use case: Private IP address to zone enrichment
You can use the IP-to-zone lookup when, based on IP address range such as 192.168.1.1 to 192.168.1.10, you want to obtain the zone name, floor name and other information (like a company's building, if it is a private or public zone etc.) etc.
Hint
Use IP-to-zone lookups for private IP address enrichment.
-
In LogMan.io, go to the Library.
-
In Library, go to the folder
/Lookups. -
Create a new lookup declaration for your lookup, like "ipzonelookup.yaml" with a YAML file extension
-
Add the following declaration:
define: type: lookup/ipaddressrange name: ipzonelookup group: zone keys: - name: range1 type: ip - name: range2 type: ip fields: location: type: geopoint value: lat: 50.0643081 lon: 14.443938 zone_name: type: str value: myzone floor_name: type: strMake sure the type is always
lookup/ipaddressrange.Change the
namein define section to your lookup name.The
groupis used then in the enrichment process to locate all lookups that share the same group. The value is a unique identifier of the group (use case), here:zoneKeep the keys as they are in order to specify ranges.
To
fields, add names and types of the lookup attributes. Here in the example there is only floor name, but there can also be room name, company name etc.:yaml fields: floor_name: type: strThe
valueattribute will be used as default.Currently, these types are supported:
str,fp64,si32,geopoint, andip -
Save
-
In LogMan.io, go to Lookups.
-
Create a new lookup with the same name as above, i.e. "ipzonelookup". Specify two keys with the names:
range1,range2. -
Create records in the lookup with the ranges as keys and fields as specified above (in the example, there is only floor in the value dictionary stored in the lookup).
-
Add the following enricher LogMan.io Parsec rule that should utilize the lookup:
define: type: enricher/ip group: floor schema: ecs: prefix: lmio.ipenricher. postfix: zone.Specify the group of the lookups to be used in the
groupattribute. It should be the same as the group mentioned above in the lookup declaration. Tenants are resolved automatically.The enrichment is done on every field that has the type
ipin the schema.Prefix specifies the prefix, and postfix specifies the postfix for the attribute:
If input is
source.ip, then output islmio.ipenricher.source.zone.<NAME_OF_THE_ATTRIBUTE>
Single IP address lookup
The single IP address lookup is a lookup that has exactly one IP address key with type ip that can be associated with an optional and variable number of attributes, defined by none or multiple values under fields.
In order to use single IP lookups together with the following enrichers, the type of the lookup in the define section must always be lookup/ipaddress.
---
define:
type: lookup/ipaddress
name: mylookup
group: mygroup
keys:
- name: sourceip
type: ip
fields:
...
Use case: Bad IP addresses lookup
You can use bad IP enrichment when, based on a single IP address such as 192.168.1.1, you want to obtain the information about the IP's risk score, etc.
-
In LogMan.io, go to the Library.
-
In the Library, go to the folder
/Lookups. -
Create a new lookup declaration for your lookup, like "badips.yaml" with a YAML file extension.
-
Add the following declaration:
--- define: type: lookup/ipaddress name: badips group: bad keys: - name: sourceip type: ip fields: base: type: si32Make sure the type is always
lookup/ipaddress.Change the
namein define section to your lookup name.The
groupis used then in the enrichment process to locate all lookups that share the same group. The value is a unique identifier of the group (use case), here:badKeep one key in
keyssection with the typeip. The name should not contain periods or any other special characters.To fields, add names and types of the lookup attribute. Here in the example there is
baseas integer, but there can also be other security-related fields from https://www.elastic.co/guide/en/ecs/current/ecs-vulnerability.html:fields: base: type: si32Currently, these types are supported:
str,fp64,si32,geopoint, andip -
Save
-
In LogMan.io, go to "Lookups".
-
Create a new lookup with the same name as above, i. e. badips. Specify the IP address as key.
-
Create records in the lookup with the IP address as the key and fields as specified above (in the example, there is only
basein the value dictionary stored in the lookup). -
Add the following enricher LogMan.io Parsec rule that should utilize the lookup:
define: type: enricher/ip group: bad schema: ecs: # https://www.elastic.co/guide/en/ecs/current/ecs-vulnerability.html prefix: lmio.vulnerability. postfix: score.Specify the group of the lookups to be used in the
groupattribute. It should be the same as the group mentioned above in the lookup declaration. Tenants are resolved automatically.The enrichment is done on every fields, that have type
ipin the schema.Prefix is added to the field with the resolved attributes to be used for futher mapping:
If input is
source.ipThen output is
lmio.vulnerability.source.score.<NAME_OF_THE_ATTRIBUTE> -
Based on the attribute and the subsequent mapping, a correlation with a notification trigger can be added to
/Correlatorsto notify about the bad IP with score's base being higher than a threshold:--- define: name: Bad IP Notification description: Bad IP Notification type: correlator/window predicate: !AND - !IN what: source.ip where: !EVENT - !GT - !ITEM EVENT lmio.vulnerability.source.score.base - 2 evaluate: dimension: [tenant, source.ip] by: "@timestamp" # Name of event field with an event time resolution: 60 # unit is second saturation: 10 # unit is resolution analyze: window: hopping # that is default aggregate: sum # that is default span: 2 # 2 * resolution from evaluate = my time window test: !GE - !ARG - 1 trigger: - event: !DICT type: "{str:any}" with: message: "Bad IP Notification" events: !ARG EVENTS source.ip: !ITEM EVENT source.ip event.dataset: correlation - notification: type: email to: [logman@example.co] template: "/Templates/Email/Notification.md" variables: !DICT type: "{str:any}" with: name: Bad IP Notification events: !ARG EVENTS dimension: !ITEM EVENT source.ip
Use case: IP address to asset enriment
Use IP-to-asset enrichment when, based on a single IP address such as 192.168.1.1, you want to obtain the information from the prepared lookup about asset information, device, host etc.
-
In LogMan.io, go to the Library.
-
In Library, go to the folder
/Lookups. -
Create a new lookup declaration for your lookup, like "ipassetlookup.yaml" with YAML extension
-
Add the following declaration:
--- define: type: lookup/ipaddress name: ipassetlookup group: asset keys: - name: sourceip type: ip fields: asset: type: strMake sure the
typeis alwayslookup/ipaddress.Change the
namein define section to your lookup name.The
groupis used then in the enrichment process to locate all lookups that share the same group. The value is a unique identifier of the group (use case), here:assetKeep one key in
keyssection with the typeip. The name should not contain dots or any other special characters.To
fields, add names and types of the lookup attribute. Here in the example is the asset and hostname:fields: asset: type: str hostname: type: strCurrently, these types are supported:
str,fp64,si32,geopointandip -
Save
-
In LogMan.io, go to Lookups.
-
Create a new lookup with the same name as above, i. e. "ipassetlookup". Specify the IP address as the key.
-
Create records in the lookup with the IP address as the key and fields as specified above.
-
Add the following enricher to the LogMan.io Parsec rule that should utilize the lookup:
--- define: type: enricher/ip group: asset schema: ecs: prefix: lmio.ipenricher.Specify the group of the lookups to be used in the
groupattribute. It should be the same as the group mentioned above in the lookup declaration. Tenants are resolved automatically.The enrichment is done on every field that has the type
ipin the schema.Prefix is added to the field with the resolved attributes to be used for futher mapping:
If input is
source.ip, then output islmio.ipenricher.source.<NAME_OF_THE_ATTRIBUTE>
MAC address lookups
TeskaLabs LogMan.io offers an optimized set of lookups for working with MAC addresses, called MAC Lookups.
There are always three steps to enable MAC Lookups:
- Create a lookup declaration in the LogMan.io Library (the lookup description)
- Create the lookup and its content in the Lookups section in the UI (the lookup content)
- Add the lookup to the relevant parsing and/or correlation rules in the Library (the lookup application)
MAC address to vendor lookup
MAC Vendor lookup is when, based on MAC address range such as 0c:12:30:00:00:01 to 0c:12:30:00:00:ff, you want to obtain the vendor information of the manufacturer of the device the MAC address is assigned to.
Built-in MAC address to vendor lookup
When the MAC address from the event does not match any of the provided macvendor lookups, the default public MAC Vendor lookup provided by TeskaLabs LogMan.io will be used.
-
In LogMan.io, go to the Library.
-
In the Library, go to the folder
/Lookups. -
Create a new lookup declaration for your lookup, like "macvendorlookup.yaml" with a YAML extension
-
Add the following declaration:
define: type: lookup/macaddressrange name: macvendorlookup group: macvendor keys: - name: range1 type: mac - name: range2 type: mac fields: manufacturer: type: strMake sure the
typeis alwayslookup/macaddressrange.Change the
namein thedefinesection to your lookup name.The
groupis used then in the enrichment process to locate all lookups that share the same group. The value is a unique identifier of the group (use case), here:macvendorKeep the keys as they are in order to specify ranges.
To
fields, add names and types of the lookup attributes.fields: manufacturer: type: strThe
valueattribute will be used as default.Currently, these types are supported:
str,fp64,si32,geopoint,ipandmac -
Save
-
In LogMan.io, go to Lookups.
-
Create a new lookup with the same name as above, i.e. "macvendorlookup". Specify two keys with the names:
range1,range2. -
Create records in the lookup with the ranges as keys and fields as specified above (in the example, there is only manufacturer in the value dictionary stored in the lookup).
-
Add the following enricher to the LogMan.io Parsec rule that should utilize the lookup:
define: type: enricher/mac group: macvendor schema: ecs: postfix: device.Specify the group of the lookups to be used in the
groupattribute. It should be the same as the group mentioned above in the lookup declaration. Tenants are resolved automatically.The enrichment is done on every field that has the type
macin the schema.Postfix specifies the postfix for the attribute:
If input is
source.macThen output is
source.observer.<NAME_OF_THE_ATTRIBUTE>When it comes to default public MAC Vendor lookup (see above), the following items are filled by default:
manufacturer: type: str
MAC address range lookup
The MAC address range lookup uses the MAC address ranges, such as 0c:12:30:00:00:01 to 0c:12:30:00:00:ff, as keys.
The declaration of an MAC address range lookup must contain type lookup/macaddressrange in the define section and two keys with type mac in the keys section:
define:
type: lookup/macaddressrange
name: mylookup
group: mygroup
keys:
- name: range1
type: mac
- name: range2
type: mac
fields:
...
Adaptive lookups
Adaptive lookups empower TeskaLabs LogMan.io event processing components such as LogMan.io Parsec, LogMan.io Correlator, and LogMan.io Alerts with the capability to automatically update lookups for real-time data enrichment using rules.
Custom rules can dynamically add or remove entries from these lookups based on the insights gleaned from incoming logs or other events. This ensures that your threat detection and response strategies remain agile, accurate, and aligned with the ever-changing cyber threat landscape, providing an essential layer of intelligence to your security operations.
Triggers
The lookup content is manipulated by a specific entry in the trigger section of the declaration.
It means that it can create (set), increment (add), decrement (sub), and remove (delete) an entry in the lookup.
The entry is identified by a key, which is a unique primary key.
Example of a trigger that adds an entry to the lookup user_list:
trigger:
- lookup: user_list
key: !ITEM EVENT user.name
set:
event.created: !NOW
foo: bar
Example of a trigger that removes an entry from the lookup user_list:
trigger:
- lookup: user_list
delete: !ITEM EVENT user.name
Example of a trigger that increments a counter (field my_counter) in the entry of the lookup user_list:
trigger:
- lookup: user_list
key: !ITEM EVENT user.name
add: my_counter
Example of a trigger that decrements a counter (field my_counter) in the entry of the lookup user_list:
trigger:
- lookup: user_list
key: !ITEM EVENT user.name
sub: my_counter
For both add and sub, the counter field name can be omitted. Hence the default attribute _counter will be used implicitly:
trigger:
- lookup: user_list
key: !ITEM EVENT user.name
sub:
If the counter field does not exist, it is created with the default value of 0.
Note
Lookup entries can be accessed from the declarative expressions by !GET and !IN entries.
Lookups API
Lookup changes can include creating or deleting the entire lookup structure, as well as adding, updating, or removing specific items within a lookup. Additionally, items can be automatically deleted when they expire. These changes can be made through the system's UI (HTTPS API) or through Apache Kafka.
The lookup events are sent by each component that creates the lookup events to lmio-lookups topics.
Lookup event structure
A lookup event has a JSON structure with three mandatory attributes:
action, lookup_id, and data. The @timestamp and tenant
attributes are added automatically as well as other configured
meta attributes.
action
Specifies the action the lookup event caused. The action can be taken on the entirety lookup or just one of its items. Refer to the list below to see all available actions and their associated events.
lookup_id
ID or name of the lookup.
The lookup ID in lookup events also contains the tenant name after the period . character,
so every component knows which tenant the lookup is specific for.
data
Specification od lookup data (i.e. lookup item) to be created or updated, as well as meta information (in case of item deletion).
Lookup items contain their ID in the _id attribute of the data structure.
The _id is a string based on:
Single key
If the lookup has only one key (e.g. userName),
the _id is the value itself for a string value.
'data': {
'_id': 'JohnDoe'
}
...
If the value is in bytes, _id is UTF-8 decoded string representation of the value.
If the value is neither a string nor bytes, it is handled the same way as ID when using compound keys.
Compound key
If the lookup consists of more keys (e.g. [userName, location]),
the _id is a hash representation of the value.
The original values are then stored in _keys attribute inside the data structure:
'data': {
'_id': '<INTERNAL_HASH>',
'_keys': ['JohnDoe', 'Company 1']
}
...
Create lookup
When a lookup is created, the following action is produced:
{
'@timestamp': <UNIX_TIMESTAMP>,
'tenant': <TENANT>,
'action': 'create_lookup',
'data': {},
'metadata': {
'_keys': ['key1name', 'key2name' ...]
...
},
'lookup_id': 'myLookup.tenant'
}
Meta data contains information about the lookup creation, such as names of the individual keys (e.g. [userName, location]) in the case of compound keys.
Delete lookup
When a lookup is deleted, the following action is produced:
{
'@timestamp': <UNIX_TIMESTAMP>,
'tenant': <TENANT>,
'action': 'delete_lookup',
'data': {},
'lookup_id': 'myLookup.tenant'
}
Create item
When an item is created, the following action is produced:
{
'@timestamp': <UNIX_TIMESTAMP>,
'tenant': <TENANT>,
'action': 'create_item',
'data': {
'_id': 'newItemId',
'_keys': [],
...
},
'lookup_id': 'myLookup.tenant'
}
Update item
When an item is updated, the following action is produced:
{
'@timestamp': <UNIX_TIMESTAMP>,
'tenant': <TENANT>,
'action': 'update_item',
'data': {
'_id': 'existingOrNewItemId',
'_keys': [],
...
},
'lookup_id': 'myLookup.tenant'
}
Delete item
When an item is deleted, the following action is produced.
Expiration
In case of deletion due to an expiration:
{
'@timestamp': <UNIX_TIMESTAMP>,
'tenant': <TENANT>,
'action': 'delete_item',
'data': {
'_id': 'existingItemId',
'reason': 'expiration'
},
'lookup_id': 'myLookup.tenant'
}
Please note: Unless the option use_default_expiration_when_update is disabled (set to false)
in the Lookup meta information, the expiration is refreshed with each lookup item update
(current time + default expiration). Thus the deletion due to expiration will happen only if
there was no update of the item in the meantime for the duration of the expiration period.
Delete
For other reasons:
{
'@timestamp': <UNIX_TIMESTAMP>,
'tenant': <TENANT>,
'action': 'delete_item',
'data': {
'_id': 'existingItemId',
'reason': 'delete'
},
'lookup_id': 'myLookup.tenant'
}
Lookup internals
Lookup Service
The lookup management service handling:
- Read-only lookup objects that can run both in asynchronous and synchronous mode (there is an on tick refresh)
- Write-only lookup modifier objects
- Builder objects for synchronous lookups files to be used by builder services
The service provides an interface both to BSPump and to SP-Lang.
Lookup Types
Synchronous lookups
Synchronous lookups are lookups loaded from files, which include:
- IP address lookups
- Elasticsearch lookups serialized to file
The creation of synchronous lookups is handled by the LogMan.io Lookup Builder (see configuration), whose output stored in /lookups folder.
Asynchronous lookups
Lookups directly loaded from Elasticsearch.
If the synchronous lookup file is missing or is corrupted, the processing is automatically handled by asynchronous lookups.
Asynchronous lookups require less setting, but are less optimal than synchronous lookups.
Warden
LogMan.io Warden
TeskaLabs LogMan.io Warden is a microservice that periodically performs predefined detections on parsed events stored in Elasticsearch. The Elasticsearch indices to load events from are obtained through event lane declarations for the given tenant that are stored in /EventLanes/ folder in the library. The detections create alerts in LogMan.io Alerts microservice.
The following detections are available:
- IP detection that detects IP addresses stored in a lookup
LogMan.io Warden configuration
LogMan.io Warden requires following dependencies:
- Apache ZooKeeper
- Apache Kafka
- Elasticsearch
- SeaCat Auth
- LogMan.io Alerts
- LogMan.io Library with
/EventLanesand/Lookups/foldera and a schema in/Schemasfolder
Example
This is the most basic configuration required for each instance of LogMan.io Warden:
[tenant]
name=default
[ip]
lookup=ipbad
[zookeeper]
servers=zookeeper-1:2181,zookeeper-2:2181,zookeeper-3:2181
[library]
providers=zk:///library
[kafka]
bootstrap_servers=kafka-1:9092,kafka-2:9092,kafka-3:9092
[elasticsearch]
url=http://es01:9200/
[auth]
public_keys_url=http://localhost:8081/openidconnect/public_keys
Tenant
Specify the tenant which LogMan.io Warden is deployed and will run detections for.
[tenant]
name=mytenant
It is recommended to run one instance of LogMan.io Warden per tenant.
Detections
IP
Specify the lookup that lists the IP addresses that should be detected.
[ip]
lookup=ipbad
The lookup's key MUST be the ip type in the lookup declaration, that is stored in /Lookups/ folder in the library.
---
define:
type: lookup/ipaddress
name: ipbad
group: bad
keys:
- name: sourceip
type: ip # The type of the key must be an IP
Zookeeper
Specify locations of the Zookeeper server in the cluster:
[zookeeper]
servers=zookeeper-1:2181,zookeeper-2:2181,zookeeper-3:2181
Hint
For non-production deployments, the use of a single Zookeeper server is possible.
Library
Specify the path(s) to the Library to load declarations from:
[library]
providers=zk:///library
Hint
Since ECS.yaml schema in /Schemas is utilized by default, consider using the LogMan.io Common Library.
Kafka
Define the Kafka cluster's bootstrap servers:
[kafka]
bootstrap_servers=kafka-1:9092,kafka-2:9092,kafka-3:9092
Hint
For non-production deployments, the use of a single Kafka server is possible.
ElasticSearch
Specify URLs of Elasticsearch master nodes.
Elasticsearch is necessary for using lookups, e.g. as a !LOOKUP expression or a lookup trigger.
[elasticsearch]
url=http://es01:9200
username=MYUSERNAME
password=MYPASSWORD
Exports
Exports
Export features are provided by BS-Query microservice enabling clients to effortlessly create, customize, and manage database-to-file exports, offering diverse options such as format selection, data download, email delivery, and automated scheduling.
To learn how to create and monitor exports, please visit the corresponding user manual section.
Terminology
Export
You can meet with the word "export" in various contexts.
- Exported file
- First of all, "export" is the data extracted from the data source (typically a database). Let's call it an "exported file"
- Export in the UI
- An export in the LogMan.io Web Application is a record informing about the state of the export and provides additional information. It offers also an interface for downloading the content - the "exported file".
- Export declaration
- Export in the context of the Library (YAML files in the
Exportssection of the Library) is a "declaration of an export" - a blueprint saying how to create a new export. - Export object
- Last but not least, "Export" is an object in BS-Query application and its representation on disk. The BS-Query Export object stores minimum information in memory. Instead, it serves as a link to the data storage.
Data Storage
The data storage is organized as follows:
.
└── data
└── <export_id>.exp
├── content
│ └── <export_id>.json
├── declaration.yaml
└── export.json
└── schedule.json
contentdirectory stores the exported data. This directory can contain no or one file only.declaration.yamlstores all variables needed for this export. You will find a complete structure of the declaration in the this chapter.export.jsonstores metadata of this particular export. It might look like this:{"state": "finished", "_c": 1692975120.0054746, "_m": 1692975120.0054772, "export_size": 181610228, "_f": 1692975170.0347197}schedule.jsonis there only for scheduled exports. It stores the timestamp of the next run.
Data Source
You can see "data source" or even "datasource" in various contexts.
- Data source
- Source of the data. This is the original database or other technology that we extract data from.
- Data source declaration
- This is a YAML file in the
DataSourcessection of the Library. It is a blueprint/manual specifying the connection to the external source of the data. - Datasource object
- Object in the BS-Query application responsible for connecting to the data source/database and data extraction.
Declaration
A declaration is a manual or blueprint for the system prescribing how to execute. Declaration of an export simply prescribes what should be in the resulting exported file. You will find these declarations in YAML format in the Library. Learn how to read or write the export and data source declarations in the this chapter.
Export Life Cycle
Each export has a state. Each state transition triggers an action.
Created
First, the export is created based on the input. Every export must be created based on a declaration. There are multiple ways to provide a declaration - as JSON or YAML file or as a reference to Library.
An export ID is generated and the <export_id>.exp folder appears in the data storage.
Then, the export is moved to the "extracting" state.
Extracting
Each export declaration contains a "datasource" item. This is a reference to /DataSources Library section.
In the processing state, BS-Query reads the declaration of the data source from the Library and creates a datasource object - this is a specific connection to the database of choice. Each export object creates and uses one datasource object.
Query is a string variable from the export declaration saying which data to collect.
Using document databases, each document is processed one by one, creating a stream, which lowers memory usage and enhances performance.
Each document/record goes through transformation functions. Learn more about how to transform the exported data based on the schema.
Then, it is stored in a format selected in the output section of the export declaration.
Not all datasources support all output formats.
Compressing
The compressing step is optional, based on the export declaration.
Postprocessing
In this stage the export content is not edited anymore, it is shipped to selected targets, e-mail being the first of a choice. BS-Query uses ASAB Iris to send exports through e-mail.
Finished
There are two options. The export finished successfully and is ready for download or there was an exception in the export life-cycle and such export "finished with error".
There are known errors that can be prevented by providing better input. Such errors are designed to provide enough information on UI. Export object that finished with an exception is stored together with the information about the error. Unknown errors are labeled with GENERAL_ERROR code.
Scheduled Exports
Scheduled exports do not follow the standard export life cycle. Instead, they end up in scheduled state when created.
There are two types of scheduled exports.
One-off scheduled exports
These exports are planned for one specific moment in the future. When created, the future timestamp is stored in the schedule.json file. When this time comes, BS-Query creates the new export that inherits the declaration of the scheduled export BUT the schedule item. The original scheduled export is not needed anymore and is deleted.
Repeated scheduled exports
These exports contain a cron format string in the schedule option of the declaration. This cron format schedule is used to calculate the time of the next trigger when the new export inheriting the scheduled export's declaration is created in the same way as one-off exports. The scheduled export does not get deleted but calculates new future timestamp the cycle repeats.
Warning
Mind the scheduled export behavior when troubleshooting. A scheduled export has always at least two IDs. The one of the original scheduled export and the second one of the descendent running export. It can be even more complicated - when editing a scheduled export, it gets deleted and a new export with a new ID is created. Like this, scheduled export (as seen from the UI) has multiple IDs (being multiple export objects in BS-Query application).
Exports and Library
There are three types of Library artifacts used by the BS-Query application.
DataSources
Declarations of data sources are vital for BS-Query functionality. There are no exports without a data source.
BS-Query application supports the following types of data source declarations:
datasource/elasticsearchdatasource/pyppeteer
/DataSources/elasticsearch.yaml
define:
type: datasource/elasticsearch
specification:
index: lmio-{{tenant}}-events*
request:
<key>: <value>
<key>: <value>
query_params:
<key>: <value>
<key>: <value>
define
type: a technical name that helps to find the DataSource declaration in the Library.
specification
index: a collection of JSON documents in Elasticsearch. Each document is a set of fields that contain data presented as key-value pairs. For more detailed expalanation refer to this article.
There is also a number of other items that can be configured in a DataSource declaration. Those are standard Elasticsearch API parameters through which you can fine-tune your declaration template to determine specific content of the requested data and/or actions performed on it. One such parameter is size - the number of matching documents to be returned in one request.
request
For more details, please refer to Elastic documentation.
query_params
For more details, please refer to Elastic documentation.
Exports
Export declarations specify how to retrieve data from a data source. The YAML file contains the following sections:
define
The define section includes the following parameters:
name: The name of the export.datasource: The name of the DataSource declaration in the library, specified as an absolute path to the library.output: The output format for the export. Available options are "raw", "csv", and "xlsx" for ES DataSources, and "raw" for Kafka DataSources.header: When using "csv" or "xlsx" output, you must specify the header of the resulting table as an array of column names. These will appear in the same order as they are listed.schedule- There are three options how to schedule an export - datetime in a format "%Y-%m-%d %H:%M" (e.g. 2023-01-01 00:00) - timestamp as integer (e.g. 1674482460) - cron - you can refer to http://en.wikipedia.org/wiki/Cron for more detailsschema: Schema in which the export should be run.
Schema
There is always a schema configured for each tenant. (See Tenants section of configuration). The export declaration can state a schema to which it belongs.
If the schema of the export declaration des not match the tenant schema configuration, the export stops executing.
target
The target section includes the following parameters:
type: An array of target types for the export. Possible options are "download", "email", and "jupyter". "download" is always selected if the target section is missing.email: For email target type, you must specify at least thetofield, which is an array of recipient email addresses. Other optional fields include: -cc: an array of CC recipients -bcc: an array of BCC recipients -from: the sender's email address (string) -subject: the subject of the email (string) -body: a file name (with suffix) stored in the Template folder of the library, used as the email body template. You can also add specialparametersto be used in the template. Otherwise, use any keyword from the define section of your export as a template parameter (for any export it is:name,datasource,output, for specific exports, you can also use parameters.compression,header,schedule,timezone,tenant).
query
The query field must be a string.
Tip
In addition to these parameters, you can use keywords specific to the data source declaration in your export declaration. If there are any conflicts, the data source declaration will take precedence.
schema
You can add partial schema that overrides common schema configured.
This feature allows schema-based transformations on exported data. This comprises:
- Conversion from timstamp to human readable date format, where schema specifies
datetimetype - Deidentification
/Exports/example_export.yaml
define:
name: Export e-mail test
datasource: elasticsearch
output: csv
header: ["@timestamp", "event.dataset", "http.response.status_code", "host.hostname", "http.request.method", "url.original"]
target:
type: ["email"]
email:
to:
- john.doe@teskalabs.com
query: >
{
"bool": {
"filter": [{
"prefix": {
"http.version": {
"value": "HTTP/1.1"
}
}
}]
}
}
schema:
fields:
user.name:
deidentification:
method: hash
source.address:
deidentification:
method: ip
Templates
The Templates section of the Library is used when sending Exports by e-mail. The e-mail body must be based on a template. Place a custom template to the Templates/Email directory. You can use jinja templating in these files. See jinja docs for more info. All keys from the export declaration can be used as jinja variables.
Deidentification
LogMan.io enables you to export any data for custom purposes, e.g. external analysis. Logs very often contain sensitive personal data about users. Use deidentification during exports whenever providing the data to third parties. Deidentification algorithms keep the granularity and uniqueness of the data allowing analysis of security incidents without exposing users personal information.
Use schema to apply deidentification methods on exported data.
Deidentification methods
hash-
Uses SHA256 algorithm to hash the value.
email-
Searches for email addresses using regular expression
^(.*)@(.*)(\..*)$(john.doe@company.com) and SHA256 to hash the name and domain separately. Returnsnot emailif value does not fit the regular expression. username-
Is a combination of
hashandemailmethod. It applies email method but returns hashed value if the value doesn't fit the regular expression. filepath-
Hashes the filename, but keeps the extension. Allows further analysis based on the file types.
ip-
Randomizes the last part of ipv4 address.
drop-
Erases the sensitive data entirely from the export.
Configuration of BS-Query
Common cluster configuration
This configuration depends on other cluster services and must align with the cluster architecture.
Locations of the Zookeeper server in the cluster.
[zookeeper]
servers=zookeeper-1:2181,zookeeper-2:2181,zookeeper-3:2181
Layers of the Library.
[library]
providers=zk:///library
Telemetry.
[asab:metrics]
Data sources
Here are some example configuration sections needed for data source connection.
[mongodb]
mongodb_uri=mongodb://mongo-1/?replicaSet=rs0
[elasticsearch]
url=
http://es01:9200
http://es02:9200
http://es03:9200
[kafka]
bootstrap_servers=kafka-1:9092,kafka-2:9092,kafka-3:9092
[pyppeteer]
url=http://<example_url>
username=<pyppeteer_username>
password=<pyppeteer_password>
Authorization
[auth]
BS-Query specific configuration
Directory to store all exports.
[storage]
path=/data/bsquery
Provide URL to ASAB Iris microservice and the default email template present in /Templates/Email folder of the Library.
The File size limit is in bytes and the default setting is 50 MB.
[target:email]
url=http://<example_url>
template=bsquery.md
file_size_limit=52 000 000
Name of a directory shared with Jupyter Notebook. To configure jupyter target, Jupyter Notebook and BS-Query must share a common directory on the filesystem.
[target:juptyer]
path=/data/jupyter
There is a default limit of rows for exports in Excel format of 50 000 rows. Be aware that this limit protects BS-Query from loading too much data in memory.
[xlsx]
limit=60000
BS-Query reads custom tenant configuration from ASAB Config. If tenant configuration is not available it defaults to this configuration of time zone and used Schema. It defaults to UTC and ECS Schema. Expiration says in how many days a finished export gets deleted. Default is 30 days.
[default]
schema=/Schemas/ECS.yaml
timezone=UTC
expiration=30
Provide a secret key and expiration of a download link in seconds. The key is a random string. Keep the expiration as short as possible. A default expiration configuration is recommended.
[download]
secret_key=<custom_secret_key>
expiration=5
Troubleshooting
Addressing the most commonly encountered issues:
Special characters in an Export file are distoreted / incorrect
Export files are UTF-8 encoded.
If your tools do not process such files properly by default, their settings should be adjusted accordingly.
Possible solutions:
-
Set your Excel application to open UTF-8 CSV files correctly.
-
Check your system's encoding settings (for example, Windows-1250) to find a suitable convertion tool.
Reports
ASAB Pyppeteer
The ASAB Pyppeteer microservice facilitates the creation of scheduled reports.
ASAB Pyppeteer operates a headless chromium browser that can open and generate reports. It allows you to use the scheduling function of Exports to define when a report will be created and dispatched via email.
It's important to note that each user may have different access levels to various sections of LogMan.io, including reports. Consequently, scheduled reports must be verified and permitted in the same manner as the original scheduling action. For information on setting up authorization, please proceed to the auth section.
Authorization of scheduled reports
A scheduled report contains information regarding its author. When it's time for the report to be printed and sent, the ASAB Pyppeteer microservice impersonates the author, ensuring the report is created from the specific user's perspective and access level.
To configure BS-Query (Exports), SeaCat Auth, and ASAB Pyppeteer correctly to allow complete communication between services, follow these steps:
1. ASAB Pyppeteer configuration
Make sure the ASAB Pyppeteer instance can access SeaCat Auth.
[seacat_auth]
url=http://localhost:3081
2. SeaCat Auth configuration
Make sure SeaCat Auth configuration allows creating machine-to-machine credentials.
[seacatauth:credentials:m2m:machine]
mongodb_uri=mongodb://localhost:27017
mongodb_database=auth
3. Create ASAB Pyppeteer Credentials
Refer to the user manual for instructions on creating and assigning credentials, resources, roles, and tenants.
First, create a resource authz:impersonate and a global role with this resource (named e.g. "impersonator").
Then, create new machine credentials with <pyppeteer_username> and <pyppeteer_password> and assign it the "impersonator" role and relevant tenants.
4. Enter pyppeteer credentials to BS-Query configuration
[pyppeteer]
url=http://localhost:8895
username=<pyppeteer_username>
password=<pyppeteer_password>
Warning
Be aware that ASAB Pyppeteer cannot impersonate a superuser. Therefore, a user with a superuser role cannot create scheduled reports unless they are explicitly assigned a role with the bitswan:report:access resource.
Configuration
Branding
Customer specified branding can be set within the LogMan.io WebUI application.
Static branding
Example:
let ConfigDefaults = {
title: "App Title",
brand_image: {
full: "media/logo/header-full.svg",
minimized: "media/logo/header-minimized.svg",
}
};
Dynamic branding
The branding can be configured using a dynamic configuration.
The dynamic configuration is injected with the use of ngx_http_sub_module, since it replace the pre-defined content of index.html (in our case).
More about ngx_http_sub_module
There are 3 options for dynamic branding - header logo, title and custom CSS styles.
Header logo
To replace default header logo, the nginx sub_filter configuration has to follow <meta name="header-logo-full"> and <meta name="header-logo-minimized"> replacement rules with the particular name. The replacement must have a content prop, otherwise the content of the replacement will not be propagated. content has to include a string with path to the logo.
Size of the branding images can be found here
Full
Example of importing full size logo (when sidebar of the application is not collapsed)
sub_filter '<meta name="header-logo-full">' '<meta name="header-logo-full" content="/<location>/<path>/<to>/<custom_branding>/<logo-full>.svg">';
Minimized
Example of importing minimized size logo (when sidebar of the application is collapsed)
sub_filter '<meta name="header-logo-minimized">' '<meta name="header-logo-minimized" content="/<location>/<path>/<to>/<custom_branding>/<logo-minimized>.svg">';
Title
Example of replacing application title, configuration has to follow <meta name="title"> replacement rules with the particular name. The replacement must have a content prop, otherwise the content of the replacement will not be propagated. content has to include a string with the application title.
sub_filter '<meta name="title">' '<meta name="title" content="Custom app title">';
Custom CSS styles
Example of importing custom CSS styles, configuration has to follow <meta name="custom-css-file"> replacement rules with the particular name. The replacement must have a content prop, otherwise the content of the replacement will not be propagated. content has to include a string with path to the CSS file.
sub_filter '<meta name="custom-css-file">' '<meta name="custom-css-file" content="/<location>/<path>/<to>/<custom_branding>/<custom-file>.css">';
Custom CSS file example
.card .card-header-login .card-header-title h2 {
color: violet !important;
}
.text-primary {
color: yellowgreen !important;
}
Define the nginx path to dynamic branding content
To allow the location of the dynamic (custom) branding content, it has to be defined in the nginx setup.
# Path to location (directory) with the custom content
location /<location>/<path>/<to>/<custom_branding> {
alias /<path>/<to>/<custom_branding>;
}
Full example
Full example of nginx configuration with custom branding
...
location /<location> {
root /<path>/<to>/<build>;
index index.html;
sub_filter '<meta name="header-logo-full">' '<meta name="header-logo-full" content="/<location>/<path>/<to>/<custom_branding>/<logo-full>.svg">';
sub_filter '<meta name="header-logo-minimized">' '<meta name="header-logo-minimized" content="/<location>/<path>/<to>/<custom_branding>/<logo-minimized>.svg">';
sub_filter '<meta name="title">' '<meta name="title" content="Custom app title">';
sub_filter '<meta name="custom-css-file">' '<meta name="custom-css-file" content="/<location>/<path>/<to>/<custom_branding>/<custom-file>.css">';
sub_filter_once on;
}
# Path to location (directory) with the custom content
location /<location>/<path>/<to>/<custom_branding> {
alias /<path>/<to>/<custom_branding>;
}
...
Styling guide
Every image HAS TO be provided in SVG (vectorized). Use of pixel formats (PNG, JPG, ...) is strongly discouraged. While creating the branding images, use full width/height of the canvas (ratio 3:1 on full and 1:1 on minimized version). No padding is required for optimal viewing experience.
Branding images
format: SVG
Full:
* rendered ratio: 3:1
* rendered size: 150x50 px
Minimized:
* rendered ratio: 1:1
* rendered size: 50x50 px
Branding is located in top-left corner on large screens. Fullsize branding image is used when sidebar is uncollapsed and is substituted by mimnimized version upon collapsing. On smaller screens (<768px), branding in sidebar disappeares and only fullsized branding image appears in the top-center position of the page.
Logo should be suitable for use in both light & dark mode.
SidebarLogo is always located at the bottom of sidebar. Minimized version appeares upon the sidebar's collapsion.
Full:
* rendered size: 90x30 px
Minimized:
* rendered size: 30x30 px
Note: A full image is also used on the splash screen, 30% of the width of the screen.
Discover configuration
Discover screen setup
The Discover screen is used for displaying and exploring the data (not only) in ElasticSearch.
The configuration of Discover screen can be loaded from Library or from static file in public folder the same way, as it is in case of Dashboards.
The type of filtered data relies on the specification which must be defined together with datetimeField. Those are crucial values without which the filtering is not possible.
Discover configuration
Library configuration
Library configuration is stored in the Library node. It must be of JSON type.
To get the configuration from Library, asab_config service must be running with the configuration pointing to the main node of Library. For more info, please refer here: http://gitlab.teskalabs.int/lmio/asab-config
The configuration from Library is editable
In the Discover Library node, there can be multiple configuration files within each of it only one discover configuration screen can be set. Another discover screen has to be configured in new Library configuration node.
All configuration files from Discover Library node are loaded in one API call.
Library configuration structure
Config structure in Library
- main Library node
- config
- Discover
- **config**.json
- type
- Discover.json
- schema
- config is the name of the particular Discover configuration, it must be of
jsontype.
In Library, the path to the config file looks like:
/<main Library node>/config/Discover/<discoverConfig>.json
Schema path will be as following:
/<main Library node>/type/Discover.json
Example of above described Library structure for multiple Discover config file case:
- logman
- config
- Discover
- declarative.json
- default.json
- speed.json
- type
- Discover.json
IMPORTANT NOTE
Schema (type) and config file (config) must be set in Library, otherwise the discover will not be loaded correctly.
All configuration files from Discover Library node are loaded in one API call.
Example of the configuration:
{
"Discover:datasource": {
"specification": "declarative*",
"datetimeField": "@timestamp",
"type": "elasticsearch"
}
}
Where
- object key serves the purpose of the naming the object. It must be named as
Discover:datasource. - type is the type of the searching engine
- specification is the url with the ElasticSearch index pattern. If one would like to seek for all the data, the url must end with an asterisk
*. This is a mandatory parameter. - datetimeField is the index of the item's datetime. It is a mandatory parameter since it is needed for searching/scrolling with ElasticSearch.
Schema (optional setup)
Don't confuse with Library schema
Set up the name to obtain schema from the library (if present), which is then applied to values defined within the schema. With the schema, we can apply actions to values corresponding the defined type, e.g. using the ASAB-WebUI's DateTime component for time values.
{
...
"Discover:schema": {
"name": "ECS"
}
...
}
Example of schemas structure in the library:
- library
- Schemas
- Discover.yaml
- ECS.yaml
...
Example of the schema in the library:
---
define:
name: Elastic Common Schema
type: common/schema
description: https://www.elastic.co/guide/en/ecs/current/index.html
fields:
'@timestamp':
type: datetime
label: "Datetime"
unit: seconds
docs: https://www.elastic.co/guide/en/ecs/current/ecs-base.html#field-timestamp
Authorization (optional setup)
Discover configuration can be limited for access only with specific tenant(s). This means, that users without particular tenant(s) are not able to access the discover configuration with its data source. This is convenient e.g. when administrator wants to limit access to discover configuration with sensitive data to particular group(s) of users.
If configuration is being set directly in the Library (and not via Configuration tool), its recommended to add Authorization section and leave tenants key as an empty string (if no limitation is required). This will help to keep up the same structure of configuration across the Discover configurations:
{
...
"Authorization": {
"tenants": ""
}
...
}
Example of Authorization settings within the configuration where limited access is required:
{
...
"Authorization": {
"tenants": "tenant one, tenant two"
}
...
}
Where key tenants serves the purpose of displaying and using the configuration only by specific tenant(s). Multiple tenants can be specified, separated by comma. The type of the tenants key is string.
Prompt settings (optional setup)
Prompt settings section provides additional option to setup Discover prompt or change its defaults.
Example of Discover:prompts section within the configuration:
{
...
"Discover:prompts": {
"dateRangePicker:datetimeStart": "now-15m",
"dateRangePicker:datetimeEnd": "now+15s"
...
},
...
}
Setup custom datetime range periods
Sometimes its desired to setup custom datetime period for data display, because data are laying e.g. outside of default period set for Discover. The default period is now-1H, which should seek for data within now and 1 hour back. For example, this could be set in the Discover:prompts as following:
{
...
"Discover:prompts": {
"dateRangePicker:datetimeStart": "now-1H",
"dateRangePicker:datetimeEnd": "now"
},
...
}
Where the dateRangePicker:datetimeStart and dateRangePicker:datetimeEnd are the periods which sets up the range to the starting period (initial) and to the ending period (final).
The setup possibilities for both periods are:
- now-
ns - now-
nm - now-
nH - now-
nd - now-
nw - now-
nM - now-
nY - now
- now+
ns - now+
nm - now+
nH - now+
nd - now+
nw - now+
nM - now+
nY
Where
- n is the number, e.g. 2,
- s indicate seconds,
- m indicate minutes,
- H indicate hours,
- d indicate days,
- w indicate weeks,
- M indicate months,
- Y indicate years
Other values will be ignored.
It is possible to e.g. setup only one period as in this example, the second period will remain default:
{
...
"Discover:prompts": {
"dateRangePicker:datetimeStart": "now-2H"
},
...
}
Another datetime range setup example, where data are displayed 15 hours to the past and sought 10 minutes into the future:
{
...
"Discover:prompts": {
"dateRangePicker:datetimeStart": "now-15H",
"dateRangePicker:datetimeEnd": "now+10m"
},
...
}
Library schema
To set up a discover screen manually in the Library, one must set the discover schema in valid JSON format.
Schema must be provided and stored in /<main Library node>/type/<discoverType>.json
The schema can look as following:
{
"$id": "Discover schema",
"type": "object",
"title": "Discover schema",
"description": "The Discover schema",
"default": {},
"examples": [
{
"Discover:datasource": {
"specification": "declarative*",
"datetimeField": "@timestamp",
"type": "elasticsearch"
}
}
],
"required": [],
"properties": {
"Discover:datasource": {
"type": "string",
"title": "Discover source",
"description": "The data specification for Discover screen",
"default": {},
"examples": [
{
"specification": "declarative*",
"datetimeField": "@timestamp",
"type": "elasticsearch"
}
],
"required": [
"specification",
"datetimeField",
"type"
],
"properties": {
"specification": {
"type": "string",
"title": "Specification",
"description": "Specify the source of the data",
"default": "",
"examples": [
"declarative*"
]
},
"datetimeField": {
"type": "string",
"title": "Datetime",
"description": "Specify the datetime value for data source",
"default": "",
"examples": [
"@timestamp"
]
},
"type": {
"type": "string",
"title": "Type",
"description": "Select the type of the source",
"default": [
"elasticsearch",
"sentinel"
],
"$defs": {
"select": {
"type": "select"
}
},
"examples": [
"elasticsearch*"
]
}
}
},
"Discover:prompts": {
"type": "string",
"title": "Discover prompts",
"description": "Update Discover prompt configuration",
"default": {},
"examples": [],
"required": [],
"properties": {
"dateRangePicker:datetimeStart": {
"type": "string",
"title": "Starting date time period",
"description": "Setup the prompt's starting date time period",
"default": "now-1H",
"examples": [
"now-1H"
]
},
"dateRangePicker:datetimeEnd": {
"type": "string",
"title": "Ending date time period",
"description": "Setup the prompt's ending date time period",
"default": "now",
"examples": [
"now"
]
}
}
},
"Discover:schema": {
"type": "string",
"title": "Discover schema name",
"description": "Apply schema over discover values",
"default": {},
"properties": {
"name": {
"type": "string",
"title": "Schema name",
"description": "Set up the schema name for configuration (without file extension)",
"default": ""
}
}
},
"Authorization": {
"type": "string",
"title": "Discover authorization",
"description": "Limit access to discover configuration by tenant settings",
"default": {},
"examples": [],
"required": [],
"properties": {
"tenants": {
"type": "string",
"title": "Tenants",
"description": "Specify the tenant(s) separated by comma to restrict the usage of this configuration (optional)",
"default": "",
"examples": [
"tenant1, tenant2"
]
}
}
}
},
"additionalProperties": false
}
Example of passing config props
Example of passing config props to the DiscoverContainer:
...
this.App.Router.addRoute({
path: "/discover",
exact: true,
name: 'Discover',
component: DiscoverContainer,
props: {
type: "Discover"
}
});
...
this.App.Navigation.addItem({
name: "Discover",
url: "/discover",
icon: 'cil-compass'
});
When using DiscoverContainer as a component in your container, then the props can be passed as following:
<DiscoverContainer type="Discover" />
The static application config file remains empty:
module.exports = {
app: {
},
webpackDevServer: {
port: 3000,
proxy: {
'/api/elasticsearch': {
target: "http://es-url:9200",
pathRewrite: {'^/api/elasticsearch': ''}
},
'/api/asab_print': {
target: "http://asab_print-url:8083",
pathRewrite: {'^/api/asab_print': ''}
},
'/api/asab_config': {
target: "http://asab_config-url:8082",
pathRewrite: {'^/api/asab_config': ''}
}
}
}
}
Static configuration
Discover screen does not have to be obtained only from Library. Another option is to configure it directly in the JSON file and save it in projects public folder.
Example of static configuration
In index.js, developer have to specify:
The JSON file with the configuration can be stored anywhere in the public folder, but it is strongly recommended to store it in /public/discover/ folder to distinguish it from the other publicly accessible components.
- Config structure in
public folder
- public
- discover
- JSON config file
- dashboards
- locales
- media
- index.html
- manifest.json
The URL of the static config sotred in public folder can look like:
https://my-project-url/discover/Discover-config.json
Example of Discover-config.json:
[
{
"Config name 1": {
"Declarative": {
"specification": "declarative*",
"datetimeField": "last_inform",
"type": "elasticsearch"
}
}
},
{
"Config name 2": {
"Default": {
"specification": "default*",
"datetimeField": "@timestamp",
"type": "elasticsearch"
}
}
}
]
Example of passing config props
Passing config props to the App:
this.App.Router.addRoute({
path: "/discover",
exact: true,
name: 'Discover',
component: DiscoverContainer,
props: {
type: "https://my-project-url/discover/Discover-config.json"
}
});
this.App.Navigation.addItem({
name: "Discover",
url: "/discover",
icon: 'cil-compass'
});
When using DiscoverContainer as a component in your container, then the props can be passed as following:
<DiscoverContainer type="https://my-project-url/discover/Discover-config.json" />
The static application config file remains empty:
module.exports = {
app: {
},
webpackDevServer: {
port: 3000,
proxy: {
'/api/elasticsearch': {
target: "http://es-url:9200",
pathRewrite: {'^/api/elasticsearch': ''}
},
'/api/asab_print': {
target: "http://asab_print-url:8083",
pathRewrite: {'^/api/asab_print': ''}
},
'/api/asab_config': {
target: "http://asab_config-url:8082",
pathRewrite: {'^/api/asab_config': ''}
}
}
}
}
Language localizations
LogMan.io WebUI provides customization of language localizations. It use i18n internalization library. For details, refer to: https://react.i18next.com
Import and set custom localisation
LogMan.io WebUI allows to re-define text of application components and messages for every section of the application. The language localizations are stored in JSON files called translate.json.
Custom locales can be loaded into the LogMan.io WebUI application via config file.
The files are loaded from e.g. external folder served by nginx, where one can store it among CSS styling and other site configuration.
Example of definition in static config file of LogMan.io WebUI:
module.exports = {
app: {
i18n: {
fallbackLng: 'en',
supportedLngs: ['en', 'cs'],
debug: false,
backend: {
{% raw %}loadPath: 'path/to/external_folder/locales/{{lng}}/{{ns}}.json',{% endraw %}
{% raw %}addPath: 'path/to/external_folder/locales/add/{{lng}}/{{ns}}',{% endraw %}
}
}
}
}
Where
* fallbackLng is a fallback language
* suportedLngs are supported languages
* debug if set to true, displays the debug messages in the console of the browser
* backend is backend plugin for loading resources from the server
The path/to/external_folder/ is a path to the external folder with the locales folder served by nginx. There has to be 2 folders referencing to supported languages. Those folders are en and cs in which translate.json files are stored, as you can see in the folder structure below:
* external_folder
* locales
* cs
* translation.json
* en
* translation.json
Custom translate.json file example
en
{
"i18n": {
"language": {
"en": "English",
"cs": "Česky"
}
},
"LogConsole": {
"Connection lost": "Connection lost, will reconnect ...",
"Mark": "Mark",
"Clear": "Clear"
},
...
}
cs
{
"i18n": {
"language": {
"en": "English",
"cs": "Česky"
}
},
"LogConsole": {
"Connection lost": "Spojení ztraceno, připojuji se ...",
"Mark": "Označit",
"Clear": "Smazat"
},
...
}
Dashboards
Dashboard and Widget configuration
Dashboard setup
To edit layout or dashboard configuration, user needs to have dashboards:admin resource assigned.
Setting dashboard manually from Library
Library configuration
Library configuration is stored in the Library node. It must be of JSON type.
To get the configuration from Library, asab_library service must be running with the configuration pointing to the main node of Library.
The configuration from Library is editable - the position and size of the widgets can be saved to the Library directly from the BS-WebUI.
Set up dashboard with Library configuration
-
Dashboards configuration files must be stored in
dashboard/Dashboardsnode of Library as in the following structure example. -
the Library config file (
config), which define your Library node with the configuration in the Library Dashboards node. Theconfigname is also the name of the Dashboard displayed in the sidebar of the appplication. It is a mandatory parameter. -
IMPORTANT NOTE - the config file MUST have an
.jsonextension, otherwise it won't be able to display the config file in theLibrarymodule and thus trigger features asEditorDisable.
Config structure in Library
- main Library node (`library`)
- Dashboards
- **config**.json
-
**main Library node** usually it should be named as
library -
**config** is the name of the paricular Dashboard configuration, e.g.
My Dashboard.json
In Library, the path to the config file looks like:
/<main Library node>/Dashboards/<dashboardConfig>.json
Take a look at the dashboard configuration example.
Dashboard configuration
Datasource
It is primarily used for setting up a data source for widgets. There can be unlimited number of datasources.
Example of data source setup
{
...
"Dashboard:datasource:elastic": {
"type": "elasticsearch", // Source of the data
"datetimeField": "@timestamp", // Type of the datetime
"specification": "es-pattern*" // Index pattern or URL pattern
},
...
}
Advanced Elasticsearch setup
{
...
"Dashboard:datasource:elastic": {
// Basic setup
"type": "elasticsearch",
"datetimeField": "@timestamp",
"specification": "es-pattern*",
// Advanced setup
"sortData": "asc", // Sort "asc" or "desc" data during the processing (optional)
// Advanced elasticsearch setup
"size": 100, // Max size of the hits in the response (default 20) (optional)
"aggregateResult": true, // Charts only (not PieChart) - it will ask ES for aggregated values (optional)
"groupBy": "user.id", // Charts only - it will ask ES for aggregation by term defined in the "groupBy" key (optional)
"matchPhrase": "event.dataset: microsoft-office-365" // For default displaying particular match of a datasource
},
...
}
Connect datasource with the widget
If datasource is not assigned to widget, no data are processed for displaying in the widget.
{
...
"Dashboard:widget:somewidget": {
"datasource": "Dashboard:datasource:elastic",
...
},
...
}
Prompts
Prompt settings section provides additional option to setup Dashboard prompt or change its defaults.
Usage within the config file:
{
...
"Dashboard:prompts": {
"dateRangePicker": true, // Enable Date range picker prompt
"filterInput": true, // Enable filter input prompt
"submitButton": true // Enable submit button prompt
},
...
}
Setup custom datetime range periods
Sometimes its desired to setup custom datetime period for data displayal, because data are laying e.g. outside of default period set for Dashboard. The default period is now-1H, which should seek for data within now and 1 hour back. For example, this could be set in the Dashboard:prompts as following:
{
...
"Dashboard:prompts": {
...
"dateRangePicker": true,
"dateRangePicker:datetimeStart": "now-1H",
"dateRangePicker:datetimeEnd": "now",
...
},
...
}
Where the dateRangePicker:datetimeStart and dateRangePicker:datetimeEnd are the periods which sets up the range to the starting period (initial) and to the ending period (final).
The setup possibilites for both periods are:
- now-
ns - now-
nm - now-
nH - now-
nd - now-
nw - now-
nM - now-
nY - now
- now+
ns - now+
nm - now+
nH - now+
nd - now+
nw - now+
nM - now+
nY
Where
- n is the number, e.g. 2,
- s indicate seconds,
- m indicate minutes,
- H indicate hours,
- d indicate days,
- w indicate weeks,
- M indicate months,
- Y indicate years
Other values will be ignored.
It is possible to e.g. setup only one period as in this example, the second period will remain default:
{
...
"Dashobard:prompts": {
...
"dateRangePicker": true,
"dateRangePicker:datetimeStart": "now-1H",
...
},
...
}
Another datetime range setup example, where data are displayed 15 hours to the past and seeked 10 minutes into the future:
{
...
"Dashboard:prompts": {
...
"dateRangePicker": true,
"dateRangePicker:datetimeStart": "now-15H",
"dateRangePicker:datetimeEnd": "now+10m",
...
},
...
}
<!-- One can specify their button title, color, path to the endpoint and formItems, which is an array of objects.
In formItems is possible to specify the type of input form (username, phone, email and password) and their titles and hint messages. On submit, filled information will be set as a JSON body of the POST request to the specified path of telco service.
widgets: [{
component_id: "WidgetContainer",
dataSource: "ES",
type: "Value",
title: "Title",
...
actionButton: {
title: 'Trigger', // Title of the button
backgroundColor: 'primary', // Color of the button (only reactstrap and bootstrap colors, if wider range needed, configure it via external CSS)
buttonOutline: true, // Set the outline of the button (default false)
action:"/path/of/the/endpoint", // Url path of the endpoint (without protocol and host)
formItems:[
{form:"username", title:"Username", hint: "Input username"},
{form:"phone", title:"Phone", hint: "Input phone"},
{form:"email", title:"Email", hint: "Input email"},
{form:"password", title:"Password", hint: "Input password"}
] // Forms to use in the popover
}, // Add an aritrary button which will perform some action via triggering an endpoint defined in path
...
}]
``` -->
### Grid system (optional setup)
Grid can be configured unique for various dashboards. Thus grid configuration can be implemented into the dashboard's configuration, as seen in example. If not specified in the configuration, the default Grid setup is used.
"Dashboard:grid": {
"preventCollision": false // If set to true, it prevents widgets from collision on the grid
},
"Dashboard:grid:breakpoints": {
"lg": 1200,
"md": 996,
"sm": 768,
"xs": 480,
"xxs": 0
},
"Dashboard:grid:cols": {
"lg": 12,
"md": 10,
"sm": 6,
"xs": 4,
"xxs": 2
},
...
} ``` Above setup is also the default dashboard setup.
Authorization / Disable configuration
Dashboard can be limited for access only with specific tenant(s). This means, that users without particular tenant(s) are not able to access the dashboard. This is convenient e.g. when administrator wants to limit access to dashboards with sensitive data to particular group(s) of users.
To disable configuration for specific tenant, one have to navigate themselves to Library section of the Application and Disable particular file by clicking on Switcher in the file.
Disabled file name of particular Dashboard configuration will be then added to .disabled.yaml file with the affected tenant(s) in the Library node.
Humanize
Component used for conversion number values to human readable form.
Diplays values in human readable form, like:
0.000001 => 1 µ
0.00001 => 10 µ
0.0001 => 100 µ
0.001 => 1 m
0.01 => 10 m
0.1 => 100 m
1 => 1
10 => 10
100 => 100
1000 => 1 k
10000 => 10 k
100000 => 100 k
1000000 => 1 M
etc
It can be used for value and multiple value widgets.
To enable Humanize component in the widget, one has to set
- "humanize": true in the widget configuration
- "base": <number> define the base for conversion (recalculation), optional parameter, default is 1000
- "decimals": <number> define how many decimals it should display, optional parameter
- "displayUnits": true display the prefix (i.e. µ, m, k, M, G) of the units, optional parameter, default false
- "units": <string> display the user defined suffix of the units (e.g. B, Hz, ...)
displayUnits and units will be put together in the widget and the result can look like MHz where M is a prefix and Hz is a user defined suffix
```
{
...
"Dashboard:widget:valuewidget": {
...
"humanize": true,
"base": 1024,
"decimals": 3,
"displayUnits": true,
"units": "B",
...
},
...
} ```
Hint (optional setup)
Hint can be added for any widget except Tools widget. In this way, the hint will be embedded as a tooltip hint beside the Widget title.
After adding the hint, an info icon will appear in the Widget's header (beside the title). After hovering over the icon, the inserted hint will be displayed.
Hint can be only of string type.
Example of how to add a Hint:
```
{
...
"Dashboard:widget:somewidget": {
...
"hint": "Some hint",
...
},
...
} ```
Widget layout
Widget size and position on the grid can be defined for every widget in the configuration. If not set, the widget has its predefined values for layout and position and will be rendered accordingly.
Widgets can be moved and resized within the grid through Dashboard setting prompt >> Edit. This is available for users with dashboards:admin resource.
Example of basic layout settings:
```
{
...
"Dashboard:widget:somewidget": {
...
// Basic setup
"layout:w": 4, // Widget width in grid units
"layout:h": 2, // Widget height in grid units
"layout:x": 0, // Position of the widget on x axis in grid units
"layout:y": 0, // Position of the widget on y axis in grid units
// Custom setup (optional)
"layout:minW": 2, // Minimal width of the widget
"layout:minH": 2, // Minimal height of the widget
"layout:maxW": 6, // Maximal width of the widget
"layout:maxH": 6, // Maximal height of the widget
...
},
...
}
Example of advanced layout settings:
{
...
"Dashboard:widget:somewidget": {
...
// Advanced setup (optional)
"layout:isBounded": false, // If true and draggable, item will be moved only within grid
"layout:resizeHandles": ?Array<'s' | 'w' | 'e' | 'n' | 'sw' | 'nw' | 'se' | 'ne'> = ['se'], // By default, a handle is only shown on the bottom-right (southeast) corner
"layout:static": ?boolean = false, // Fix widget on static position (cannot be moved nor resized). If true, equal to `isDraggable: false, isResizable: false`
"layout:isDraggable": ?boolean = true, // If false, will not be draggable. Overrides `static`
"layout:isResizable": ?boolean = true, // If false, will not be resizable. Overrides `static`
...
},
...
} ```
Widgets
Example of widget within the config file: ``` { ...
"Dashboard:widget:somewidget": {
"datasource": "Dashboard:datasource:elastic",
"type": "Value",
"field": "some.variable",
"title": "Some title",
"layout:w": 2,
"layout:h": 1,
"layout:x": 0,
"layout:y": 1
},
...
} ```
Value widget
Commonly used to display single value, altough it can also display datetime and the filtered value widget at once. ``` { ...
"Dashboard:widget:valuewidget": {
// Basic setup
"datasource": "Dashboard:datasource:elastic",
"type": "Value", // Type of the widget
"field": "some.variable", // Field (value) displayed in the widget
"title": "Some title", // Title of the widget
// Advanced setup (optional)
"onlyDateResult": true, // Display just date with time
"units": "GB", // Units of the field value
"displayWidgetDateTime": true, // Display date time in the widget underneath the value
"hint": "Some hint", // Display hint of the widget
// Humanize value (can be used for transforming values to human readable form e.g. bytes to GB) (optional)
"humanize": true, // Enable Humanize component
"base": 1024, // Base for the value recalculation for Humanize component
"decimals": 3, // Round value to n digits in Humanize component
"displayUnits": true, // Display prefix of the unit size (like k, M, T,...) in Humanize component
// Layout setup
"layout:w": 2,
"layout:h": 1,
"layout:x": 0,
"layout:y": 1
},
...
} ```
Multiple value widget
Used to display multiple values in one widget ``` { ...
"Dashboard:widget:mutliplevaluewidget": {
// Basic setup
"datasource": "Dashboard:datasource:elastic",
"type": "MultipleValue", // Type of the widget
"field:1": "some.variable1", // Fields (values) displayed in the widget
"field:2": "some.variable2", // Number of fields is unlimited
"field:3": "date.time",
"title": "Some title", // Title of the widget
// Advanced setup (optional)
"units": "GB", // Units of the fields value
"displayWidgetDateTime": true, // Display date time in the widget underneath the value
"hint": "Some hint", // Display hint of the widget
// Humanize value (can be used for transforming values to human readable form e.g. bytes to GB) (optional)
"humanize": true, // Enable Humanize component
"base": 1024, // Base for the value recalculation for Humanize component
"decimals": 3, // Round value to n digits in Humanize component
"displayUnits": true, // Display prefix of the unit size (like k, M, T,...) in Humanize component
// Layout setup
"layout:w": 2,
"layout:h": 1,
"layout:x": 0,
"layout:y": 1
},
...
} ```
Status indicator widget
Used to display value and status color based on exceedance / subceedance of the limit values. Its core is similar to Value widget. There are 2 types of the setting - one is for displaying colors based on number range, the other is based on displaying values based on string. Number range ``` { ...
"Dashboard:widget:indicatorwidget": {
// Basic setup
"datasource": "Dashboard:datasource:elastic",
"type": "StatusIndicator", // Type of the widget
"field": "some.variable", // Field (value) displayed in the widget
"title": "Some title", // Title of the widget
"lowerBound": 4000, // Lower limit bound
"upperBound": 5000, // Upper limit bound
// Advanced setup (optional)
"lowerBoundColor": "#a9f75f", // Lower bound color
"betweenBoundColor": "#ffc433", // Midst bound color
"upperBoundColor": "#C70039 ", // Upper bound color
"nodataBoundColor": "#cfcfcf", // No data color
"units": "GB", // Units of the field value
"displayWidgetDateTime": true, // Display date time in the widget underneath the value
"hint": "Some hint", // Display hint of the widget
// Layout setup
"layout:w": 2,
"layout:h": 1,
"layout:x": 0,
"layout:y": 1
},
...
} ```
Table widget
Used to display multiple values in a form of table. ``` { ...
"Dashboard:widget:tablewidget": {
// Basic setup
"datasource": "Dashboard:datasource:elastic",
"type": "Table", // Type of the widget
"field:1": "@timestamp", // Fields (values) displayed in the widget
"field:2": "event.dataset", // Number of fields is unlimited
"field:3": "host.hostname", // Fields also indicates items displayed in the table header
"title": "Some title", // Title of the widget
// Advanced setup (optional)
"dataPerPage": 5, // Number of data per page
"disablePagination": true, // Disable pagination
"units": "GB", // Units of the field value
"hint": "Some hint", // Display hint of the widget
// Layout setup
"layout:w": 3,
"layout:h": 3,
"layout:x": 0,
"layout:y": 1
},
...
} ```
Tools widget
It is similar to Tools module of ASAB WebUI, but transformed to a widget for use in the dashboard. ``` { ...
"Dashboard:widget:toolswidget": {
// Basic setup
"type": "Tools", // Type of the widget
"title": "BitSwan", // Title of the widget
"redirectUrl": "http://www.teskalabs.com", // Redirect URL
"image": "tools/bitswan.svg", // Location of the Tools image (can be also base64 image string instead of path to the location)
// Layout setup
"layout:w": 1,
"layout:h": 1,
"layout:x": 0,
"layout:y": 0
},
...
} ```
Markdown widget
Commonly used to edit and display written description in Markdown format. This widget allows user to edit & save the description e.g. of particular dashboard for broader explanation.
For editing, one needs to have at least dashboards:admin resource.
```
{
...
"Dashboard:widget:mdwidget": {
// Basic setup
"type": "Markdown", // Type of the widget
"title": "Some title", // Title of the widget
// Advanced setup (optional)
"description": "Some description", // Display description in markdown
"hint": "Some hint", // Display hint of the widget
// Layout setup
"layout:w": 2,
"layout:h": 1,
"layout:x": 0,
"layout:y": 1
},
...
} ```
Chart widgets
Used to display values in a chart form. For more info about used chart library, please follow this link
Redirection to Discover screen
PieChart and BarChart widgets offer redirection to Discover screen option by default.
This feature filter into selected value in the chart and redirect to Discover screen. It is avaiable only for grouped data (groupBy setup in datasource settings). It can be disabled by setting "disableRedirection": true in the widget.
When multiple configurations are used in Discover, one can specify configuration name in the widget which will be used in redirection to filter to correct configuration. If multiple Discover configurations are used in one application, it is recommended to specify the configuration names within widgets to avoid redirections to wrong configurations and datasources in Discover. It can be set up with widget prop "configName": "<discover-config-name>" >>> where <discover-config-name> is the name of the discover configuration file without extension, e.g. some-config.json >>> "configName": "some-config".
Note: Redirection removes all previously filtered items and modify date time range stored in local storage for Discover screen according to selected in Dashboard chart.
Chart widget colors
All charts offers a possiblity to be displayed with one of the pre-defined color schemes.
The color spectra differs based on chart type.
If no or wrong color is specified, the default color spectra is used.
The color is specified by color variable in the widget settings:
"Dashboard:widget:barchartwidget": {
"datasource": "Dashboard:datasource:elastic",
"type": "BarChart",
"title": "Some title",
...
"color": "sunset",
...
},
- PieChart
- for gradient color spectra - sunset, secondary, safe, warning, danger, default
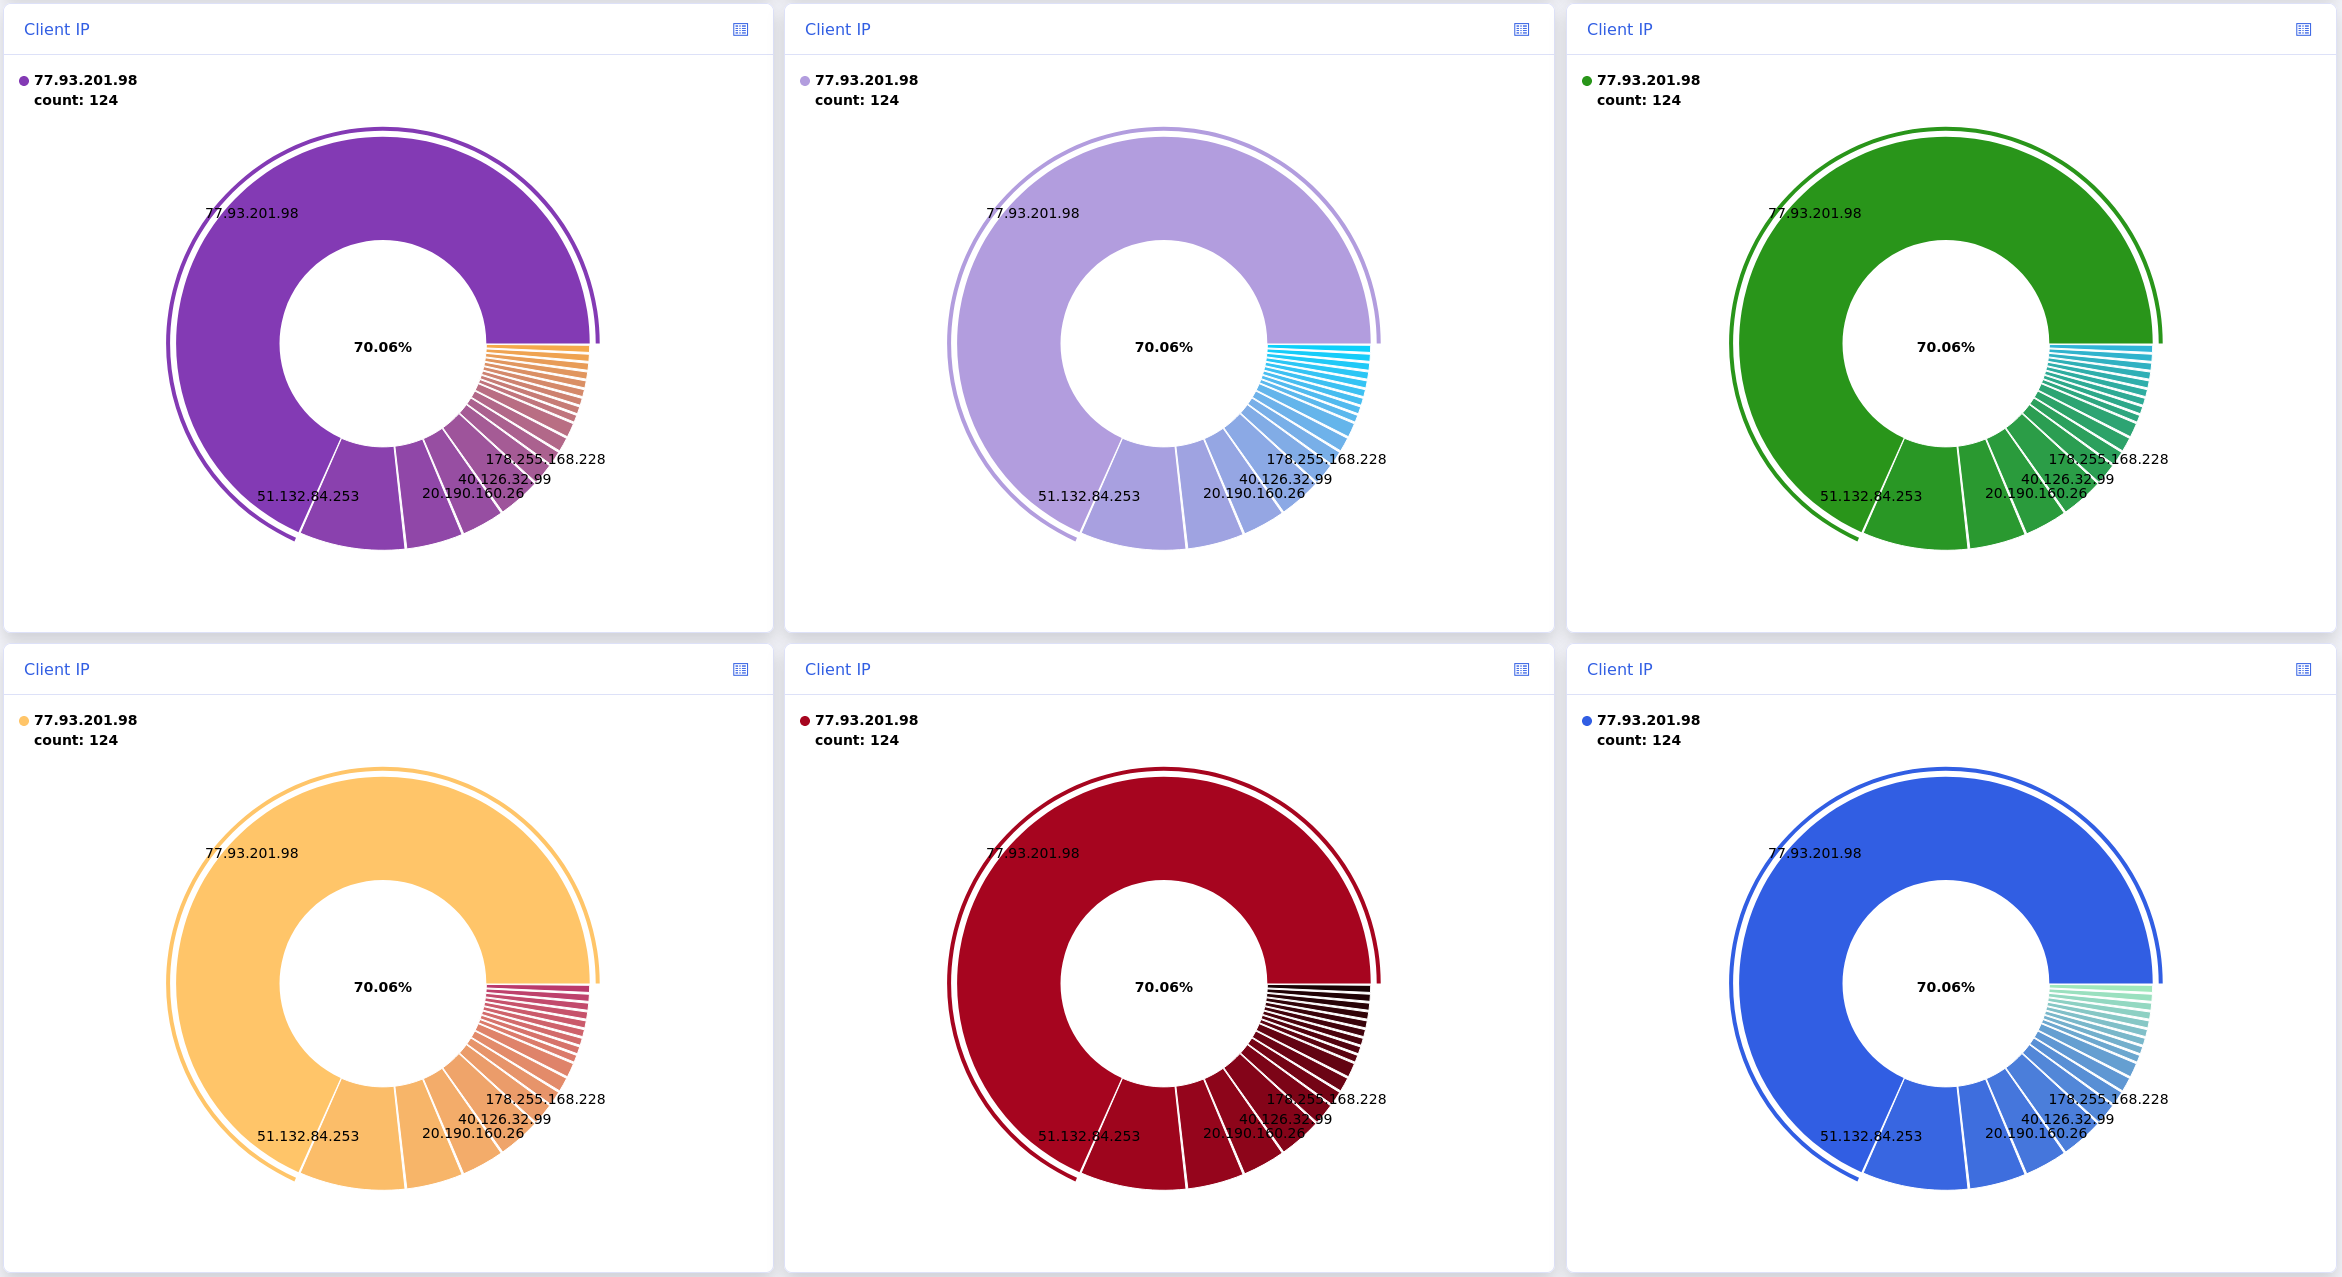 - for mixed color spectra -
 cold, rainbow, default
 - BarChart and others
- single color spectra -
 sunset, safe, warning, danger, default

BarChart widget
``` { ...
"Dashboard:widget:barchartwidget": {
// Basic setup
"datasource": "Dashboard:datasource:elastic",
"type": "BarChart", // Type of the widget
"title": "Some title", // Title of the widget
"xaxis": "@timestamp", // Values displayed on x-axis
"yaxis": "request.bytes", // Values displayed on y-axis
// Advanced setup (optional)
"table": true, // Allows to display table instead of chart (on button click)
"xlabel": "timestamp", // x-axis label, default is datetime
"ylabel": "bytes", // y-axis label
"xaxisUnit": "ts", // x-axis units
"yaxisUnit": "byte", // y-axis units
"xaxisDomain": ['auto', 'auto'], // Range to display on x-axis (default [0, 'auto'])
"yaxisDomain": ['auto', 'auto'], // Range to display on y-axis (default [0, 'auto'])
"horizontal": true, // Allows the chart to be displayed horizontally
"width": "50%", // Width of the chart in the widget
"height": "50%", // Height of the chart in the widget
"convertBy": 1000, // Chart values will be divided by this number. It serves the purpose and need of data conversion to e.g. MHz, GB, etc.
"hint": "Some hint", // Display hint of the widget
"disableRedirection": true, // Disable redirection to Discover screen (only for BarChart)
"configName": "config-name", // Name of the particular Discover configuration (only for BarChart)
"color": "safe", // Color specification of the widget
// Layout setup
"layout:w": 6,
"layout:h": 3,
"layout:x": 0,
"layout:y": 0
},
...
}
To display aggregation in the chart, one has to set it in the data source setup:
{
...
"Dashboard:datasource:elastic": {
// Basic setup
"type": "elasticsearch",
"datetimeField": "@timestamp",
"specification": "es-pattern*",
"aggregateResult": true // Charts only - it will ask ES for aggregated values (optional)
},
...
} ```
ScatterChart widget
Setting of this widget is the same as BarChart widget's. ``` { ...
"Dashboard:widget:scatterchartwidget": {
// Basic setup
...
"type": "ScatterChart", // Type of the widget
...
},
...
} ```
AreaChart widget
Setting of this widget is the same as BarChart widget's. ``` { ...
"Dashboard:widget:areachartwidget": {
// Basic setup
...
"type": "AreaChart", // Type of the widget
...
},
...
}
##### LineChart widget
Setting of this widget is the same as BarChart widget's.
"Dashboard:widget:linechartwidget": {
// Basic setup
...
"type": "LineChart", // Type of the widget
...
},
...
}
##### Stacked BarChart widget
**Grouped chart**
Datasource configuration:
"Dashboard:datasource:elastic-stacked": {
// Basic setup
"type": "elasticsearch",
"datetimeField": "@timestamp",
"specification": "pattern*",
"groupBy": [
"sender.address",
"recipient.address"
],
"size": 100, // Define the max size of the group (default is top 20)
"stackSize": 100 // Define the max size of the stacked events (default is top 50)
// Advanced setup
"matchPhrase": "event.dataset: microsoft-office-365" // For default displaying particular match of a datasource
},
...
}
Chart configuration:
{
...
"Dashboard:widget:stackedbarchartwidget": {
"datasource": "Dashboard:datasource:elastic-stacked",
"title": "Some stacked barchart title",
"type": "StackedBarChart",
// Advanced setup (optional)
"table": true, // Allows to display table instead of chart (on button click)
"xlabel": "Sender x recipient", // x-axis label, default is datetime
"ylabel": "Count", // y-axis label
},
...
}
**Aggregated chart on timescale**
Datasource configuration:
{
...
"Dashboard:datasource:elastic-aggregation-stacked": {
// Basic setup
"type": "elasticsearch",
"datetimeField": "@timestamp",
"specification": "pattern*",
"aggregateResult": true, // Set aggregation to true
"groupBy": "o365.audit.Workload", // Value to group aggregation by
"aggregateEvents": [
"device.properties.OS",
"organization.id"
], // Additional events for aggregation (optional but recommended)
"size": 100 // Define the max size of the group (default is top 20)
// Advanced setup
"matchPhrase": "event.dataset: microsoft-office-365" // For default displaying particular match of a datasource
},
...
}
Chart configuration:
{
...
"Dashboard:widget:stackedbarchartwidget": {
"datasource": "Dashboard:datasource:elastic-aggregation-stacked",
"title": "Some stacked barchart title",
"type": "StackedBarChart",
// Advanced setup (optional)
"table": true, // Allows to display table instead of chart (on button click)
"xlabel": "Sender x recipient", // x-axis label, default is datetime
"ylabel": "Count", // y-axis label
},
...
} ```
PieChart widget
To display values in the chart, one has to set groupBy in the data source setup.
groupBy will ask ES for aggregation by term defined in the "groupBy" key:
```
{
...
"Dashboard:datasource:elastic-groupby": {
// Basic setup
"type": "elasticsearch",
"datetimeField": "@timestamp",
"specification": "es-pattern*",
"groupBy": "user.id",
"size": 100, // Define the max size of the group (default is top 20)
// Advanced setup
"matchPhrase": "event.dataset: microsoft-office-365" // For default displaying particular match of a datasource
},
...
}
"Dashboard:widget:piechartwidget": {
// Basic setup
"datasource": "Dashboard:datasource:elastic-groupby",
"type": "PieChart", // Type of the widget
"title": "Some title", // Title of the widget
// Advanced setup (optional)
"table": true, // Allows to display table instead of chart (on button click)
"tooltip": true, // Display either Tooltip or text (by default) in the widget. Alternatively, `tooltip: "both"` can be set to display both possiblilities
"useGradientColors": true, // PieChart will use pre-default gradient colors - by default set to false
"displayUnassigned": true, // Display unassigned values (empty string keys or keys with dash) within the PieChart - by default set to false
"field": "timestamp", // Field for displaying the values in the Pie chart (if groupBy not defined in datasource)
"width": "50%", // Width of the chart in the widget
"height": "50%", // Height of the chart in the widget
"hint": "Some hint", // Display hint of the widget
"disableRedirection": true, // Disable redirection to Discover screen
"configName": "config-name", // Name of the particular Discover configuration,
"color": "safe", // Color specification of the widget - spectre and names can differ if gradient colors are used
// Layout setup
"layout:w": 6,
"layout:h": 3,
"layout:x": 0,
"layout:y": 0
},
...
}
#### FlowChart widgets
Used to display flowcharts in svg format
##### FlowChart widget
Flowchart widget is based on mermaid.js flowcharts. For more info, please follow this [link](https://mermaid-js.github.io){:target="_blank"}
"Dashboard:widget:flowchart": {
// Basic setup
"type": "FlowChart", // Type of the widget
"title": "Gantt chart", // Title of the widget
"content": "gantt\ntitle A Gantt Diagram\ndateFormat YYYY-MM-DD\nsection Section\nA task:a1, 2014-01-01, 30d\nAnother task:after a1,20d\nsection Another\nTask in sec:2014-01-12,12d\nanother task: 24d", // Content of the flowchart
// Advanced setup (optional)
"hint": "Some hint", // Display hint of the widget
// Layout setup
"layout:w": 6,
"layout:h": 3,
"layout:x": 0,
"layout:y": 0
},
...
}
**Content of the flowchart**
Content of the flowchart must be of string type. As it is a part of JSON, newlines **must** be separated by `\n`
<!-- TODO: remove this comment when obtaining of the flowchart from URL or API will be implemented -->
There is a plan to implement the content obtainment of the flowchart from API or URL in the next iterations.
Example of conversion of the mermaid string flowchart to be compatible with JSON setting in Library
**Original string:**
gantt
title A Gantt Diagram
dateFormat YYYY-MM-DD
section Section
A task :a1, 2014-01-01, 30d
Another task :after a1 , 20d
section Another
Task in sec :2014-01-12 , 12d
another task : 24d
**Modified string**
gantt\ntitle A Gantt Diagram\ndateFormat YYYY-MM-DD\nsection Section\nA task:a1, 2014-01-01, 30d\nAnother task:after a1,20d\nsection Another\nTask in sec:2014-01-12,12d\nanother task: 24d
```
Dashboard configuration example
Example:
{
"Dashboard:datasource:elastic": {
"type": "elasticsearch",
"datetimeField": "@timestamp",
"specification": "default-events*"
},
"Dashboard:datasource:elastic-aggregation": {
"type": "elasticsearch",
"datetimeField": "@timestamp",
"specification": "default-events*",
"aggregateResult": true
},
"Dashboard:datasource:elastic-size100": {
"type": "elasticsearch",
"datetimeField": "@timestamp",
"specification": "default-events*",
"size": 100
},
"Dashboard:datasource:elastic-stacked": {
"type": "elasticsearch",
"datetimeField": "@timestamp",
"specification": "default-events*",
"groupBy": [
"sender.address",
"recipient.address"
],
"matchPhrase": "event.dataset:microsoft-office-365",
"size": 50,
"stackSize": 100
},
"Dashboard:grid": {
"preventCollision": false
},
"Dashboard:grid:breakpoints": {
"lg": 1200,
"md": 996,
"sm": 768,
"xs": 480,
"xxs": 0
},
"Dashboard:grid:cols": {
"lg": 12,
"md": 10,
"sm": 6,
"xs": 4,
"xxs": 2
},
"Dashboard:prompts": {
"dateRangePicker": true,
"dateRangePicker:datetimeStart": "now-15H",
"dateRangePicker:datetimeEnd": "now+10s",
"filterInput": true,
"submitButton": true
},
"Dashboard:widget:table": {
"datasource": "Dashboard:datasource:elastic-size100",
"field:1": "@timestamp",
"field:2": "event.dataset",
"field:3": "host.hostname",
"title": "Table",
"type": "Table",
"layout:w": 6,
"layout:h": 4,
"layout:x": 0,
"layout:y": 9,
"layout:minW": 2,
"layout:minH": 3
},
"Dashboard:widget:hostname": {
"datasource": "Dashboard:datasource:elastic",
"field": "host.hostname",
"title": "Hostname",
"type": "Value",
"layout:w": 2,
"layout:h": 1,
"layout:x": 10,
"layout:y": 12
},
"Dashboard:widget:lastboot": {
"datasource": "Dashboard:datasource:elastic",
"field": "@timestamp",
"units": "ts",
"title": "Last boot",
"type": "Value",
"layout:w": 2,
"layout:h": 1,
"layout:x": 8,
"layout:y": 12,
"layout:minH": 1
},
"Dashboard:widget:justdate": {
"datasource": "Dashboard:datasource:elastic",
"field": "@timestamp",
"onlyDateResult": true,
"title": "Just date",
"type": "Value",
"layout:w": 4,
"layout:h": 2,
"layout:x": 8,
"layout:y": 9
},
"Dashboard:widget:displaytenant": {
"datasource": "Dashboard:datasource:elastic",
"field": "tenant",
"title": "Tenant",
"type": "Value",
"layout:w": 2,
"layout:h": 2,
"layout:x": 6,
"layout:y": 9
},
"Dashboard:widget:baraggregationchart": {
"datasource": "Dashboard:datasource:elastic-aggregation",
"title": "Request body bytes aggregation",
"type": "BarChart",
"xaxis": "@timestamp",
"yaxis": "http.request.body.bytes",
"yaxisDomain": [
"auto",
0
],
"ylabel": "bytes",
"layout:w": 6,
"layout:h": 3,
"layout:x": 0,
"layout:y": 6,
"layout:minW": 4,
"layout:minH": 3,
"layout:isBounded": true
},
"Dashboard:widget:barchart": {
"datasource": "Dashboard:datasource:elastic",
"title": "Request body bytes",
"type": "BarChart",
"hint": "Some hint",
"width": "95%",
"xaxis": "@timestamp",
"yaxis": "http.request.body.bytes",
"ylabel": "bytes",
"layout:w": 6,
"layout:h": 3,
"layout:x": 6,
"layout:y": 6
},
"Dashboard:widget:scatterchart": {
"datasource": "Dashboard:datasource:elastic-size100",
"title": "Request body bytes scatter size 100",
"type": "ScatterChart",
"xaxis": "@timestamp",
"xlabel": "datetime",
"yaxis": "http.request.body.bytes",
"ylabel": "http.request.body.bytes",
"layout:w": 6,
"layout:h": 3,
"layout:x": 6,
"layout:y": 0,
"layout:minH": 2,
"layout:maxH": 6
},
"Dashboard:widget:scatteraggregationchart": {
"datasource": "Dashboard:datasource:elastic-aggregation",
"title": "Request body bytes scatter aggregation",
"type": "ScatterChart",
"xaxis": "@timestamp",
"yaxis": "http.request.body.bytes",
"xlabel": "datetime",
"ylabel": "count",
"layout:w": 6,
"layout:h": 3,
"layout:x": 0,
"layout:y": 0
},
"Dashboard:widget:areachart": {
"datasource": "Dashboard:datasource:elastic",
"height": "100%",
"title": "Request body bytes area",
"type": "AreaChart",
"width": "95%",
"xaxis": "@timestamp",
"yaxis": "http.request.body.bytes",
"ylabel": "area bytes",
"layout:w": 6,
"layout:h": 3,
"layout:x": 6,
"layout:y": 3,
"layout:minH": 2,
"layout:maxH": 6,
"layout:resizeHandles": [
"sw"
]
},
"Dashboard:widget:areaaggregationchart": {
"datasource": "Dashboard:datasource:elastic-aggregation",
"title": "Request body bytes area aggregation",
"type": "AreaChart",
"xaxis": "@timestamp",
"xlabel": "datetime",
"yaxis": "http.request.body.bytes",
"ylabel": "count",
"layout:w": 6,
"layout:h": 3,
"layout:x": 0,
"layout:y": 3
},
"Dashboard:widget:multiplevalwidget": {
"datasource": "Dashboard:datasource:elastic",
"type": "MultipleValue",
"title": "Multiple values",
"field:1": "event.dataset",
"field:2": "http.response.status_code",
"field:3": "url.orignal",
"layout:w": 2,
"layout:h": 2,
"layout:x": 6,
"layout:y": 11
},
"Dashboard:widget:statusindicatorwidget": {
"datasource": "Dashboard:datasource:elastic",
"type": "StatusIndicator",
"title": "Bytes exceedance",
"field": "http.request.body.bytes",
"units": "bytes",
"lowerBound": 20000,
"upperBound": 40000,
"lowerBoundColor": "#a9f75f",
"betweenBoundColor": "#ffc433",
"upperBoundColor": "#C70039 ",
"nodataBoundColor": "#cfcfcf",
"layout:w": 2,
"layout:h": 1,
"layout:x": 10,
"layout:y": 11
},
"Dashboard:widget:toolswidget": {
"type": "Tools",
"title": "Grafana",
"redirectUrl": "http://www.grafana.com",
"image": "tools/grafana.svg",
"layout:w": 2,
"layout:h": 1,
"layout:x": 8,
"layout:y": 11
},
"Dashboard:widget:flowchart": {
"title": "Gantt chart",
"type": "FlowChart",
"content": "gantt\ntitle A Gantt Diagram\ndateFormat YYYY-MM-DD\nsection Section\nA task:a1, 2014-01-01, 30d\nAnother task:after a1,20d\nsection Another\nTask in sec:2014-01-12,12d\nanother task: 24d",
"layout:w": 12,
"layout:h": 2,
"layout:x": 0,
"layout:y": 13
},
"Dashboard:widget:markdown": {
"title": "Markdown description",
"type": "Markdown",
"description": "## Markdown content",
"layout:w": 12,
"layout:h": 2,
"layout:x": 0,
"layout:y": 15
},
"Dashboard:widget:barchart-stacked": {
"datasource": "Dashboard:datasource:elastic-stacked",
"title": "Grouped sender X recipient address",
"type": "StackedBarChart",
"xlabel": "Sender x Recipient",
"ylabel": "Count",
"layout:w": 12,
"layout:h": 4,
"layout:x": 0,
"layout:y": 17
}
}
Office 365 dashboard
Example:
{
"Dashboard:prompts": {
"dateRangePicker": true,
"filterInput": true,
"submitButton": true
},
"Dashboard:datasource:elastic-office365-userid": {
"datetimeField": "@timestamp",
"groupBy": "user.id",
"matchPhrase": "event.dataset:microsoft-office-365",
"specification": "lmio-default-events*",
"type": "elasticsearch",
"size": 100
},
"Dashboard:datasource:elastic-office365-clientip": {
"datetimeField": "@timestamp",
"groupBy": "client.ip",
"matchPhrase": "event.dataset:microsoft-office-365",
"specification": "lmio-default-events*",
"type": "elasticsearch",
"size": 100
},
"Dashboard:datasource:elastic-office365-activity": {
"datetimeField": "@timestamp",
"groupBy": "o365.audit.Workload",
"matchPhrase": "event.dataset:microsoft-office-365",
"specification": "lmio-default-events*",
"type": "elasticsearch",
"size": 100
},
"Dashboard:datasource:elastic-office365-actions": {
"datetimeField": "@timestamp",
"groupBy": "event.action",
"matchPhrase": "event.dataset:microsoft-office-365",
"specification": "lmio-default-events*",
"type": "elasticsearch",
"size": 50
},
"Dashboard:widget:piechart": {
"datasource": "Dashboard:datasource:elastic-office365-clientip",
"title": "Client IP",
"type": "PieChart",
"table": true,
"layout:w": 6,
"layout:h": 4,
"layout:x": 6,
"layout:y": 0
},
"Dashboard:widget:piechart2": {
"datasource": "Dashboard:datasource:elastic-office365-userid",
"title": "User ID's",
"type": "PieChart",
"useGradientColors": true,
"table": true,
"tooltip": true,
"layout:w": 6,
"layout:h": 4,
"layout:x": 0,
"layout:y": 0
},
"Dashboard:widget:piechart3": {
"datasource": "Dashboard:datasource:elastic-office365-activity",
"title": "Activity by apps",
"type": "PieChart",
"table": true,
"tooltip": true,
"layout:w": 6,
"layout:h": 4,
"layout:x": 6,
"layout:y": 4
},
"Dashboard:widget:barchart": {
"datasource": "Dashboard:datasource:elastic-office365-actions",
"title": "Actions",
"type": "BarChart",
"table": true,
"xaxis": "event.action",
"xlabel": "Actions",
"ylabel": "Count",
"layout:w": 6,
"layout:h": 4,
"layout:x": 0,
"layout:y": 4
}
}
Widgets catalogue
Closer view to the widget's settings.
For Dashboard and widget's setup, please refer here.
Value widgets
Usage of value widgets is, when displaying data in text form is needed.
Single value widget
Serves the purpose of displaying just a single value.
Value can be of type: string, boolean, number.
Single value can display just a date (convert e.g. unix timestamp to human readable date), if needed.
Multiple value widget
Serves the purpose displaying n values in one widget.
Except displaying n values in one widget, multiple value widget contents the same features as Single value widget.
Values can be of type: string, boolean, number.
Status indicator widget
Status indicator widget displays a number value and a color indication based on defined boundaries.
Value can be of type: number.
Table widget
Table widget can display multiple values in the table form.
Values can be of type: string, boolean, number.
Tool widgets
Tool widgets serves the purpose of a "button" - that when clicked - open a new tab in the browser with a link (URL address) specified in the configuration of the widget. Images for a tool widget can be loaded directly in the application's public folder or loaded as a base64 string image.
Chart widgets
Usage of chart widgets is, when displaying data in graphical form is needed.
Recharts are used as library for rendering data in the chart form.
BarChart widget
BarChart widget has 4 types of displaying data:
BarChart widget with sample data
Displaying the data based on some key on the timeline.
BarChart widget with aggregated data
Displaying count of the data based on some key on the timeline.
BarChart widget with grouped data
Displaying the data based on key by the total count.
BarChart widget with data table
Displaying the chart data in the table. This feature can be enabled in the chart settings and activated by clicking the button in top right corner of the widget.
AreaChart widget
Contains the same features as BarChart widget, but it displays the data in the widget in area form.
ScatterChart widget
Contains the same features as BarChart widget, but it displays the data in the widget in scatter form.
PieChart widget
PieChart displays only grouped data in form of pie chart and table.
PieChart with gradient colors
In this example, tooltip is used for displaying detailed informations about the particular part (tooltip is not displayed in this image).
PieChart with multiple colors
In this example, tooltip is replaced by indication of an active part in the upper left corner of the widget.
FlowChart widget
Mermaid is used as a library for rendering flowcharts.
Mermaid playground can be found here.
Maestro
ASAB Maestro
ASAB Maestro is a technology for cluster management.
It is responsible for:
- Installation and updating of TeskaLabs LogMan.io
- Management of cluster services
- Monitoring of the cluster
ASAB Maestro was developed to overcome the challenges of labor-intensive manual cluster configuration.
It brings several advantages:
- Fast installation of TeskaLabs LogMan.io
- Human errors reduction
- Consistency across all deployment sites
- Monitoring across all layers - hardware, containerization, application
- Easy updates of TeskaLabs LogMan.io
Overview of ASAB Maestro functionality
Automation
TeskaLabs LogMan.io and our other applications are typically deployed on-premises into customer environments, termed sites. ASAB Maestro ensures consistent and rapid deployment across multiple sites through extensive automation. Support teams can assist more customers using fewer resources as automation makes them higly efficient and all sites have a unified setup.
The system guarantees consistent configurations across all applications, cluster technologies (like Apache Kafka and Elasticsearch), and the API gateway (NGINX). ASAB Maestro also streamlines the deployment of web applications to the cluster and handles the deployment of content such as database schemas, initial data loads, and more.
Cluster management
Management of cluster services is done from the TeskaLabs LogMan.io Web UI.
ASAB Maestro enforces a global version, representing a comprehensive release version that delineates the versions of all deployed components and confirms their compatibility. It directly results in an easy upgrade procedure when a new product version is released.
Monitoring
ASAB Maestro's includes also a centralized cluster monitoring. This monitoring encompasses logging and telemetry from all components that runs in the cluster.
Main components of ASAB Maestro
Diagram: Example of the 5 node cluster managed by the ASAB Maestro.
Containerization
Beneath the surface, ASAB Maestro employs Docker, and more specifically, Docker Compose, to manage containers. Alternatively, it is also compatible with Podman, providing additional flexibility and security.
ASAB Maestro extends beyond the capabilities of Docker Compose without intricacies and overhead that may come with systems like Kubernetes.
ASAB Remote Control
ASAB Remote Control (asab-remote-control) is a microservice that is responsible for a central cluster management.
It must run in at least one instance in the cluster.
The recommended setup is three instances, next to each ZooKeeper instance.
ASAB Governator
ASAB Governator (asab-governator) is a microservice that interacts locally with the Docker technology.
ASAB Governator must run on each node of the cluster.
The ASAB Governator connects to a ASAB Remote Control.
ASAB Maestro Library
ASAB Maestro Library is an open-source repository managed by TeskaLabs with the description of microservices that can be launched in the cluster. The library lives at github.com/TeskaLabs/asab-maestro-library.
Note: Other libraries can be added on top of ASAB Maestro Library to extend the set of managed microservices in the cluster.
Terminology
Cluster
Cluster is a set of computer nodes working together to achieve high availability and fault tolerance, acting as a single system. The nodes in a cluster can host services, and resources that are distributed among them. Clustering is a common approach used to enhance the performance, availability, and scalability of software applications and services.
Clusters can be geographically distributed across different data centers, cloud providers, regions, or even continents. This geographic distribution helps in reducing latency, increasing redundancy, and ensuring data locality for improved application performance and user experience.
A single cluster is called a site and it is identified by site_id.
Node
Node serves as the fundamental building unit of a cluster, representing either a physical or a virtual machine (server) that runs Linux and supports containerization through Docker or Podman.
Each node within a cluster is assigned a unique identifier, node_id.
This node_id not only distinguishes each node but also doubles as the hostname of the node, aiding in network communications and node management within the cluster.
The node is managed by the ASAB Governator microservice.
Tip
node_id always resolves to the IP address of the node at each location of the cluster.
Core node
Core node contributes to the shared consensus of the cluster. This consensus is crucial for maintaining the integrity, consistency, and synchronization of data and operations across the cluster.
Core nodes are instrumental in achieving consensus, a process that ensures all nodes in the cluster agree on the state of data and the sequence of transactions. This agreement is vital for Data Integrity, Transaction Order and Fault Tolerance.
Typically, the first three nodes added to the cluster are designated as core nodes. This number is chosen to balance the need for redundancy and the desire to avoid the overhead of coordinating a large number of nodes. Having three core nodes means that the system can tolerate the failure of one node while still achieving consensus.
Warning
In larger deployments, the number of core nodes MUST BE configured as an odd number, such as 5, 7, 9 and so on, to prevent split-brain scenarios and ensure a majority can be reached for consensus.
Peripheral node
Peripheral node, as opposed to a core node, does not participate in forming the shared consensus of the cluster. Its primary function is to provide data services, execute computations, host services, ot it has other supplementary roles, extending the capabilities and capacity of the cluster.
While peripheral nodes do not contribute to the consensus-building of the cluster, they maintain a symbiotic relationship with core nodes.
Service
A service is a collection of microservices that provides a cluster-wide functionality. The example is ASAB Library, Zookeeper, Apache Kafka, Elasticsearch and so on.
Each service has its unique identifier within the cluster, called service_id.
Instance
Instance represent a single container that runs a given service. Respectivelly, if a service is scheduled to run on multiple nodes of the cluster, each running entity is the instance of a given service.
Each instance has its unique identifier within the cluster, called instance_id.
Each instance also has its number, called instance_no.
Each instance is also tagged by respective service_id and node_id.
Tip
instance_no can be also a string!
Sherpa
Sherpa is an auxiliary container launched next to the instances of some specific services. It runs only for a brief time, till the sherpa task is completed.
Typical use case for sherpa is an initial setup of the database.
Model
Model represents a wanted layout of the cluster.
It is one or multiple YAML files stored in the Library.
ASAB Maestro manages the cluster by applying the model. All services listed in the model are run or updated by ASAB Remote Control and ASAB Governator services.
Model file name model.yaml is meant for editing. Other files are created automatically through other LogMan.io components.
Descriptor
Descriptor is a YAML file living in the Library saying how a service, more precisely an instance of the service, should be created and launched.
Application
Application is a cluster level set of descriptors and their versions.
Global Version
Each Application can have multiple global versions. Each version is specified in a version file stored in the Library which stores version for each service of the application.
Tech / Technology
Tech stands for a technology. The technology is a specific type of the service (ie NGINX, Mongo) that provides some resources to other services.
Get started
Under Construction


Install log simulator
To install log simulator, you'll need a running TeskaLabs LogMan.io installation.
The log simulator is a part of LogMan.io Collector. Default configuration of LogMan.io Collector provides you with simulated logs of Microsoft 365, Microsoft Windows Events technologies and Linux sample logs in RFC 3164 format.
Create a tenant
Create a tenant in which you want to simulate logs.
- Create new tenant in the UI (Auth&Roles > Tenants > New tenant)
- Assign your credentials to the new tenant
- Go to Maintenance > Configuration and create a new configuration in the
Tenantsfolder with the name of your tenant. In the new configuration select ECS schema and your timezone - Log out and log in into the new tenant
Add library with simulated log sources
In the UI, go to Maintanance > Configuration
Add next layer of the Library.
libsreg+https://libsreg.z6.web.core.windows.net/lmio-collector-library
Add collector service to model
Add lmio-collector service to services section of model.yaml file.
services:
...
lmio-collector:
- <node_id>
Apply the changes!
curl -X 'POST' 'http://<node_id>:8891/node/<node_id>' -H 'Content-Type: application/json' -d '{"command": "up"}'
In the Web UI, go the the Collectors screen and provision new collector.
Create eventlane and start parsing
Simply use Event Lane Manager:
curl -X 'PUT' 'http://<node_id>:8954/create-eventlane' -H 'Content-Type: application/json' -d '{"tenant": "<your tenant>", "stream": "microsoft-365-mirage", "node_id": "<node_id>" }'
ASAB Maestro bootstrap
The bootstrap is a process of how to deploy ASAB Maestro on the new cluster node.
Bootstap using Docker
$ docker run -it --rm --pull always \
-v /var/run/docker.sock:/var/run/docker.sock \
-v /opt/site:/opt/site \
-v /opt/site/docker/conf:/root/.docker/ \
-v /data:/data \
-e NODE_ID=`hostname -s` \
--network=host \
pcr.teskalabs.com/asab/asab-governator:stable \
python3 -m governator.bootstrap
Bootstrap using Podman
The Podman deployment is inherently root-less, adding extra layer of the security to the deployment.
Note
Version 4+ or Podman is strongly recommended.
This is how to install Podman to Ubuntu 22.04 LTS:
$ export ubuntu_version='22.04'
$ export key_url="https://download.opensuse.org/repositories/devel:/kubic:/libcontainers:/unstable/xUbuntu_${ubuntu_version}/Release.key"
$ export sources_url="https://download.opensuse.org/repositories/devel:/kubic:/libcontainers:/unstable/xUbuntu_${ubuntu_version}"
$ echo "deb $sources_url/ /" | sudo tee /etc/apt/sources.list.d/devel:kubic:libcontainers:unstable.list
$ curl -fsSL $key_url | gpg --dearmor | sudo tee /etc/apt/trusted.gpg.d/devel_kubic_libcontainers_unstable.gpg > /dev/null
$ sudo apt update
$ sudo apt install podman
Configure Podman:
$ systemctl --user start podman.socket
$ systemctl --user enable podman.socket
$ sudo ln -s /run/user/${UID}/podman/podman.sock /var/run/docker.sock
$ loginctl enable-linger ${USER}
Prepare the OS filesystem layout:
$ sudo mkdir /opt/site
$ sudo chown ${USER} /opt/site
$ mkdir -p /opt/site/docker/conf
$ sudo mkdir /data
$ sudo chown ${USER} /data
Launch the bootstrap:
$ podman run -it --rm --pull always \
-v /var/run/docker.sock:/var/run/docker.sock \
-v /opt/site:/opt/site \
-v /opt/site/docker/conf:/root/.docker/ \
-v /data:/data \
-e NODE_ID=`hostname -s` \
--network=host \
pcr.teskalabs.com/asab/asab-governator:stable \
python3 -m governator.bootstrap
Library setup
Library is a home for various declarations that describe the components required for LogMan.io functionality and their specific behaviour.
Maestro functionality is dependent and managed by several types of Library files:
- The integral part is the model. It states which components to deploy.
- Descriptors provide instructions on how to install each service.
- Version files comprise versions of all software components, creating global version of each application.
All declarations and files used within ASAB Maestro live in the /Site directory. You will always find model files and application directories on the top level of the /Site directory. All descriptors and version files are specific for the application. Descriptors, Versions and Web Applications are discussed in further chapters.
There is one more folder in each application called simply Files. Files in these directories are sorted by the services they belong to. They can be referenced in the descriptors.
ASAB Maestro Model
Model is a YAML file or multiple of them describing wanted layout of the cluster. It is the main point of interaction between the user and ASAB Maestro. Model is a place where to customize LogMan.io installation.
Model file(s)
Model files are stored in the library at /Site/ folder.
The user-level model file is /Site/model.yaml.
The administrator edits this file manually, i.e. in the Library.
Multiple model files can exist. Especially managed model pieces are separated into specific files. All model files are merged into a single model data structure when the model is being applied.
Warning
Don't edit model files labeled as automatically generated.
Structure of the model
Example of the /Site/model.yaml:
define:
type: rc/model
services:
nginx:
instances:
1: {node: "node1"}
2: {node: "node2"}
2: {node: "node3"}
mongo:
- {node: "node1"}
- {node: "node2"}
- {node: "node3"}
myservice:
instances:
id1: {node: "node1"}
webapps:
/: My Web application
/auth: SeaCat Auth WebUI
/influxdb: InfluxDB UI
applications:
- name: "ASAB Maestro"
version: v23.32
- name: "My Application"
version: v1.0
params:
PUBLIC_URL: https://ateska-lmio
Section define
define:
type: rc/model
It specifies the type of this YAML file by stating type: rc/model.
Section services
This section lists all services in the cluster. In the example above, services are "nginx", "mongo" and "myservice".
Each service name must correspond with the respective descriptor in the Library.
The services section is prescribed as follows:
services:
<service_id>:
instances:
<instance_no>:
node: <node_id>
<instance-level overrides>
...
<service-level overrides>
Add new instance
The instances section of the service entry in services must specify on which node to run each instance.
This is a canonical, fully expanded form:
myservice:
instances:
1:
node: node1
2:
node: node2
3:
node: node2
Service myservice is scheduled to run in three instances (instance number 1, 2 and 3) at nodes node1 and node2.
Following forms are available for brevity:
myservice:
instances: {1: node1, 2: node2, 3: node2}
myservice:
instances: ["node1", "node2", "node2"]
The last example defines only one instance (of the number 1) of the service myservice that will be scheduled to the node node1:
myservice:
instances: node1
Removed instances
Some services need a fixed instance number for a whole lifecycle of the cluster, especially if some instances are removed.
Renaming and moving instances
Whenever renaming or moving the instances from one node to another, keep in mind there's no reference between "old" and "new" instance. It means that one instance is being deleted and second one created. If you move an instance of a service from one node to another, be aware that data stored on that node and managed or used by the service are not moved.
ZooKeeper
The instance number in ZooKeeper service is used to by the ZooKeeper technology to identify the instance within the cluster. Thus, changing instance number means to remove one ZooKeeper node from the cluster and add a new one.
The removed instance is number two:
myservice:
instances:
1: {node: "node1"}
# There used to be another instance here but it is removed now
3: {node: "node2"}
In the reduced form, null has to be used:
myservice: ["node1", null, "node2"]
Overriding the descriptor values
To override values from the descriptor, you can enter these values on marks <instance-level overrides> or <service-level overrides> respectively.
In the following example, number of cpu is set to 2 at Docker Compose and also the asab section from the descriptor of the asab-governator is overriden on the instance level:
services:
...
asab-governator:
instances:
1:
node: node1
descriptor:
cpus: 2
asab:
config:
remote_control:
url:
- http://nodeX:8891/rc
The same override, but on the service level:
services:
...
asab-governator:
instances: [node1, node2]
descriptor:
cpus: 2
asab:
config:
remote_control:
url:
- http://nodeX:8891/rc
Overriding versions
To override version that is by default set in the version file, use "version" keyword in the model.
In the example below the version of instance asab-governator-1 will be set to v24.36. The version in the version file will be ignored.
services:
...
asab-governator:
instances:
- node1
version: v24.36
Section webapps
The webapps section describes what web applications to install into the cluster.
See the NGINX chapter for more details.
Section applications
The application section lists the applications from the Library to be included.
applications:
- name: <application name>
version: <application version>
...
The application lives in the Library in the /Site/<application name>/ folder.
The version is specified in the version file at /Site/<application name>/Versions/<application version>.yaml.
Multiple applications can be deployed together in the same cluster if there are multiple application entries in the applications section of the model.
Version file
Example of the version file
/Site/ASAB Maestro/Versions/v23.32.yaml:
define:
type: rc/version
product: ASAB Maestro
version: v23.32
versions:
zookeeper: '3.9'
nginx: '1.25.2'
mongo: '7.0.1'
asab-remote-control: latest
asab-governator: stable
asab-library: v23.15
asab-config: v23.31
seacat-auth: v23.37-beta
asab-iris: v23.31
Section params
This section contains key/value cluster-level (global) parametrization of the site.
Model-level extensions
Some technologies allows the model to specify extensions to their configuration.
Example of the NGINX model-level extension:
define:
type: rc/model
...
nginx:
https:
location /:
- gzip_static on
- alias /webroot/lmio-webui/dist
Multiple model files
Besides the user-level model file (/Site/model.yaml), you can find there also generated model files named based on this pattern: /Site/model-*.yaml.
Model files are merged into one big model just before processing by ASAB Remote Control.
ASAB Maestro descriptor
Descriptors are YAML files living in the Library. Each application consists of a group of descriptors /Site/<application name>/Descriptors/.
A descriptor provides detailed infomation about the service and/or technology. Descriptors serve as specific extensions of the model.
Note
Descriptors are provided by the authors of each application.
Structure of the descriptor
Example of /Site/ASAB Maestro/Descriptors/mongo.yaml:
define:
type: rc/descriptor
name: MongoDB document database
url: https://github.com/mongodb/mongo
descriptor:
image: library/mongo
volumes:
- "{{SLOW_STORAGE}}/{{INSTANCE_ID}}/data:/data/db"
- "{{SITE}}/{{INSTANCE_ID}}/conf:/etc/mongo:ro"
command: mongod --config /etc/mongo/mongod.conf --directoryperdb
healthcheck:
test: ["CMD-SHELL", 'echo "db.runCommand(\"ping\").ok" | mongosh 127.0.0.1:27017/rs0 --quiet']
interval: 60s
timeout: 10s
retries: 5
start_period: 30s
sherpas:
init:
image: library/mongo
entrypoint: ["mongosh", "--nodb", "--file", "/script/mongo-init.js"]
command: ["echo", "DONE"]
volumes:
- "{{SITE}}/{{INSTANCE_ID}}/script:/script:ro"
- "{{SITE}}/{{INSTANCE_ID}}/conf:/etc/mongo:ro"
depends_on: ["{{INSTANCE_ID}}"]
environment:
MONGO_HOSTNAMES: "{{MONGO_HOSTNAMES}}"
files:
- "conf/mongod.conf": |
net:
bindIp: 0.0.0.0
port: 27017
replication:
replSetName: rs0
- "script/mongo-init.js"
Templating
Descriptors utilize Jinja2 templates that are expanded when a descriptor is applied.
Common parameters:
{{NODE_ID}}: Node identification / hostname of the host machine (node1).{{SERVICE_ID}}: Service identification (i.e.mongo).{{INSTANCE_ID}}: Instance identification (i.e.mongo-2).{{INSTANCE_NO}}: Instance number (i.e,2).{{SITE}}: Directory with the site config on the host machine (i.e./opt/site).{{FAST_STORAGE}}: Directory with the fast storage on the host machine (i.e./data/ssd).{{SLOW_STORAGE}}: Directory with the slow storage on the host machine (i.e./data/hdd).
Note
Other parameters can be specified within descriptors, in the model or provided by technologies.
Technologies
Not only that multiple Library files are composed into the final configuration. There are also techs playing their parts. Techs are part of ASAB Remote Control microservice and provide extra cluster configuration.
Some of them also introduce specific sections to the descriptors.
Learn more about Techs
Composability
Descriptors can be overridden in the deployment via specific configuration options or through model.
/Site/<application name>/Descriptors/__commons.yaml__file of the Library is a common base for all descriptors of the application. It specifically contains entries for network mode, restart policy, logging and others.- The specific descriptor of the service (e.g.
/Site/<application name>/Descriptors/nginx.yaml) is layered on the top of the content of the__commons__.yaml - Model can override the descriptor.
Merge algorithm
This composability is implemented through a merge algorithm. You'll find the same algorithm being used in multiple cases where chunks from various sources result into a functional site configuration.
Library layering
To get a full picture of the Library within ASAB Maestro, learn also about ASAB Library layering.
Sections
Section define
define:
type: rc/descriptor
name: <human-readable name>
url: <URL with relevant info>
type must be rc/descriptor.
Items name and url provide information about the service and/or technology.
Section params
Specify parameters for templating of this and all other descriptors. Any parameter specified in this section can be used in the double courly brackets for Jinja2 templating.
define:
type: rc/descriptor
params:
MY_PARAMETER: "ABCDEFGH"
descriptor:
environment: "{{MY_PARAMETER}}"
Section secrets
Similar to params, secrets can be also used as parameters for templating. However, their value is not specified in the descriptor but generated and stored in the Vault. You can customize the secret by specifying type and lenght. Default is "token" of 64 bytes.
define:
type: rc/descriptor
secrets:
MY_SECRET:
type: token
length: 32
descriptor:
environment: "{{MY_SECRET}}"
Warning
Parts of the descriptor are used directly to prepare docker-compose.yaml. The section secrets can be specified in the docker-compose.yaml as well. However, this functionality of Docker Compose is omitted within ASAB Maestro and fully replaced by secrets section of the descriptor.
Section descriptor
The descriptor section is a template for a service section of the docker-compose.yaml.
Following transformations are done:
- The Jinja2 variables are expanded.
- The version from
../Versions/...is appended toimage, if not present. - Specific techs performs custom transformations, these are typically marked by
null.
Details about volumes
The service has following three storage location available for their persistent data:
{{SITE}}: the site directory (i.e./opt/site/...){{SLOW_STORAGE}}: the slow storage (i.e./data/hdd/...){{FAST_STORAGE}}: the fast storage (i.e./data/ssd/...)
Each instance can create a sub-directory in any of above locations named by its instance_id.
Section files
This section specifies what files to be copied into the instance sub-directory of the site directory (i.e. /opt/site/...).
Subsequently, this content can be made available to the instance container by relevant volumes entry.
List files using the following scheme:
files:
- destination:
source: file_name.txt
OR
files:
- destination:
content: |
Multiline plain text
that will be written into
the destination path.
Destination
There are three possible destinations:
- This service
- Other service
- ZooKeeper
1. This service
File path specified is relative to the destination in the site directory.
In example, this record in the descriptor...
files:
- script/mongo-init.js:
source: some_source_dir/mongo-init.js
...will create /opt/site/mongo-1/script/mongo-init.js file if the INSTANCE ID of the mongo instance is mongo-1.
2. Other service
Use URL with service scheme to target the file into other service.
In example, this record in ANY descriptor of a service in model...
files:
- service://mongo/script/mongo-init.js:
source: some_source_dir/mongo-init.js
...will create /opt/site/mongo-1/script/mongo-init.js file if mongo instance is present in the model too and its INSTANCE ID is mongo-1.
3. ZooKeeper
Use zk URL scheme to specify path in ZooKeeper where to upload the file. The file is in "managed" mode. It means that it is always updated according to the current state of the library.
files:
- zk:///asab/library/settings/lmio-library-settings.json:
source: asab-library/setup.json
In this example, a ZooKeeper node with path /asab/library/settings/lmio-library-settings.json will be created, or updated if it already exists.
Source
Source is a relative path to library folder assigned as /Site/<application>/Files/<service>/. E.g. for mongo service it referes to /Site/ASAB Maestro/Files/mongo/.
Source can be both file or folder. Folder path must end with trailing slash.
File source syntax abbreviations
If source is missing in the declaration it shares the same path with the destination.
This entry copies the /Site/ASAB Maestro/Files/mongo/script/mongo-init.js into /opt/site/mongo-1/script/mongo-init.js, assuming the instance identification is mongo-1:
files:
- "script/mongo-init.js"
The similar entry with trailing / copies the whole directory from /Site/ASAB Maestro/Files/mongo/script/conf into /opt/site/mongo-1/conf/ directory.
files:
- "conf/"
Files are not templated
Unlike descriptors and model, files stored in /Site/<application name>/Files/<service_id>/ directory are not templated. That means that curly brackets with parameters are not replaced by the respective values. If you need to use templating within the file, enter the file into the decriptor directly, using the multiline string operator ("|").
Content
Declare the content of the file directly in the descriptor. This is especially convenient for short files and/or files that require parameters provided by maestro.
Literal style using pipe (|) in the yaml file enables writing multiline strings (block scalars).
files:
- "conf/mongod.conf":
content: |
net:
bindIp: 0.0.0.0
port: 27017
replication:
replSetName: rs0
The content keyword can be omitted for bravity.
files:
- "conf/mongod.conf": |
net:
bindIp: 0.0.0.0
port: 27017
replication:
replSetName: rs0
Section sherpas
The sherpas are auxiliary containers that are launched together with the main instance containers. Sherpa containers are expected to finish relativelly quickly and they are not restarted. Sherpas exited sucessfuly (with exit code being 0) are promptly deleted.
Example:
sherpas:
init:
image: library/mongo
entrypoint: ["mongosh", "--nodb", "--file", "/script/mongo-init.js"]
command: ["echo", "DONE"]
volumes:
- "{{SITE}}/{{INSTANCE_ID}}/script:/script:ro"
- "{{SITE}}/{{INSTANCE_ID}}/conf:/etc/mongo:ro"
depends_on: ["{{INSTANCE_ID}}"]
environment:
MONGO_HOSTNAMES: "{{MONGO_HOSTNAMES}}"
This defines an init sherpa container.
The container name of the sherpa would be mongo-1-init, the INSTANCE_ID parameter remains mongo-1.
The content of the sherpa is a template for a relevant part of the docker-compose.yaml.
If sherpa does not specify the image, the service image including the version is used.
Alternatively, we recommend to use docker.teskalabs.com/asab/asab-governator:stable as an image for a sherpa, since this image is always present and doesn't need to be downloaded.
Versions in ASAB Maestro
The global version of an application is specified in the applications section of the model:
define:
type: rc/model
services:
zoonavigator:
instances: {1: {node: "lmc01"} }
params:
PUBLIC_URL: "https://maestro.logman.io"
applications:
- name: "ASAB Maestro"
version: v23.47
- name: "LogMan.io"
version: v24.01
Version files describing global versions live in /Site/<application name>/Versions directory of the Library. E.g. there is a /Site/ASAB Maestro/Versions directory for ASAB Maestro application.
The version file v24.01.yaml might look like this:
define:
type: rc/version
product: ASAB Maestro
version: v24.01
versions:
zookeeper: '3.9'
asab-remote-control: latest
asab-governator: stable
asab-library: v23.15-beta
asab-config: v23.45
seacat-auth: v23.47
asab-iris: v23.31-alpha
nginx: '1.25.2'
elasticsearch: '7.17.12'
mongo: '7.0.1'
kibana: '7.17.2'
influxdb: '2.7.1'
telegraf: '1.28.2'
grafana: '10.0.8'
kafdrop: '4.0.0'
kafka: '7.5.1'
jupyter: "lab-4.0.9"
webapp seacat-auth: v23.29-beta
The define section specifies file type and provides more information about it. It can also serve to store comments and notes.
versions section takes names of the services as keys and their versions as values. Those are versions of respective docker images. A special records in this list are web applications. Use webapp keyword to assign a version for specific web application. If the version is not specified, latest verion is used.
Web Applications
To install a web application you need:
- Web application stated in the model
- Nginx (and SeaCat Auth)
- Respective web application file in the Library
Model
Use webapps section to state which web applications should be installed. Choose nginx location where each web app is served.
Example of /Site/model.yaml
define:
type: rc/model
services:
zoonavigator:
instances:
1:
node: "lmc01"
nginx:
instances:
1:
node: "lmc01"
mongo:
instances:
1:
node: "lmc01"
seacat-auth:
instances:
1:
node: "lmc01"
applications:
- name: "ASAB Maestro"
version: v23.47
params:
PUBLIC_URL: "https://maestro.logman.io"
webapps:
/: LogMan.io WebUI
/auth: SeaCat Auth WebUI
Dependencies
The web apps can be only served from a proxy server Nginx.
Make sure your public URL in the params section in your model is correct.
Most of the web applications require authorization server. To run LogMan.io web UI successfully, install also SeaCat Auth and Mongo as its dependency.
Web Application file
The web app declaration contains the distribution point, Nginx specification and list of the web apps.
- Choose between
mfeandspa - Choose server ("https", "http", "internal")
- Specify nginx location where to serve the web application
- Specify the name of the web application
Note
mfe stands for "micro-frontend" application. LogMan.io Web UI consist of many microfrontend applications.
spa stands for "single-packed" application.
Version of each application is stated in the version file. Applications not listed in the version files are used in their latest version.
Web application descriptor for MFE
define:
type: rc/webapp
name: TeskaLabs LogMan.io WebUI
url: https://teskalabs.com
webapp:
distribution: https://asabwebui.z16.web.core.windows.net/
mfe:
https:
/: lmio_webui
/asab_config_webui: asab_config_webui
/asab_library_webui: asab_library_webui
/asab_maestro_webui: asab_maestro_webui
/asab_tools_webui: asab_tools_webui
/bs_query_webui: bs_query_webui
/lmio_analysis_webui: lmio_analysis_webui
/lmio_lookup_webui: lmio_lookup_webui
The section webapp and the key distribution specifies the base URL from which the application is distributed.
The section mfe contains the specification of the server (https, http or internal) to which the installation will be performed.
Inside of the server, there is a dictionary of the location "subpath" (/) and the MFE component name (lmio_webui).
One location should be /, it is the entry point into the MFE application.
Web application descriptor for SPA
define:
type: rc/webapp
name: TeskaLabs SeaCat Auth WebUI
url: https://teskalabs.com
webapp:
distribution: https://asabwebui.z16.web.core.windows.net/
spa:
https: seacat-auth
The section webapp and the key distribution specifies the base URL from which the application is distributed.
The section spa contains the specification of the server (https, http or internal) to which the installation will be performed.
The value seacat-auth specifies the name of (singular) SPA component to be installed.
Versioning
Versions of web application components are specified in the respective /Site/<application name>/Versions/v<application version>.yaml file:
define:
type: rc/version
product: ASAB Maestro
version: v23.32
versions:
...
webapp seacat-auth: 'v23.13-beta'
webapp lmio_webui: 'v23.43'
The web application has a prefix webapp with the trailing space.
If the version is not specified, the "master" version is assumed.
This file provides the compatible version combination of the web application components and respective microservices.
Running web application distribution sherpa manually
You may need to execute the web application distribution sherpa manually ie to upgrade to a recent version of the web application.
This is how it is done:
$ cd /opt/site
$ ./gov.sh compose up nginx-1-webapp-dist
[+] Running 1/1
✔ Container nginx-1-webapp-dist Created 0.1s
Attaching to nginx-1-webapp-dist
nginx-1-webapp-dist | Installing lmio_webui (mfe) ...
nginx-1-webapp-dist | lmio_webui already installed and up-to-date.
nginx-1-webapp-dist | Installing asab_config_webui (mfe) ...
nginx-1-webapp-dist | asab_config_webui already installed and up-to-date.
nginx-1-webapp-dist | Installing asab_maestro_webui (mfe) ...
nginx-1-webapp-dist | asab_maestro_webui already installed and up-to-date.
nginx-1-webapp-dist | Installing asab_tools_webui (mfe) ...
nginx-1-webapp-dist | asab_tools_webui already installed and up-to-date.
nginx-1-webapp-dist | Installing bs_query_webui (mfe) ...
nginx-1-webapp-dist | bs_query_webui already installed and up-to-date.
nginx-1-webapp-dist | Installing lmio_analysis_webui (mfe) ...
nginx-1-webapp-dist | lmio_analysis_webui already installed and up-to-date.
nginx-1-webapp-dist | Installing lmio_lookup_webui (mfe) ...
nginx-1-webapp-dist | lmio_lookup_webui already installed and up-to-date.
nginx-1-webapp-dist | Installing lmio_observability_webui (mfe) ...
nginx-1-webapp-dist | lmio_observability_webui already installed and up-to-date.
nginx-1-webapp-dist | Installing lmio_parser_builder_webui (mfe) ...
nginx-1-webapp-dist | lmio_parser_builder_webui already installed and up-to-date.
nginx-1-webapp-dist | Installing seacat-auth (spa) ...
nginx-1-webapp-dist | seacat-auth already installed and up-to-date.
nginx-1-webapp-dist exited with code 0
$
Techs
Technologies in ASAB Maestro
Technology is a specific type of a service (i.e. NGINX, Mongo) that provides resources to other services.
Besides its main functionality as a service, ASAB Remote Control microservice extends the technologies and their impact on the cluster configuration.
Some configuration options require up-to-date knowledge of the cluster components. For example, if a microservice needs configuration of Kafka servers, ASAB Remote Control's Kafka tech checks where Kafka is running and provides the configuration.
Each technology is designed to provide one or many from following features:
Parameters
Technology provides parameters that can be used in the model and descriptor during templating.
Descriptor section
A technology may utilize its specific section of the descriptors. For example, see Nginx tech.
Configuration of ASAB Services
ASAB service in this context is recognized by having asab section in the descriptor.
See ASAB tech to know how configuration of an ASAB service is built.
Techs can expand configuration of ASAB services (e.g. Elasticsearch or Kafka techs).
Example
define:
type: rc/descriptor
name: ASAB Remote Control
descriptor:
image: docker.teskalabs.com/asab/asab-remote-control
volumes:
- "{{SITE}}/{{INSTANCE_ID}}/conf:/conf:ro"
asab:
configname: conf/asab-remote-control.conf
config: {}
nginx:
api: 8891
Adjusting conifguration of the service
Some techs adjust their own configuration based on the current cluster layout.
ASAB Services within ASAB Maestro
Configuration of ASAB Services
This technology provides every ASAB service with its specific configuration.
asab section must be specified in the descriptor.
The asab section requires:
configname- Name of the configuration file that corresponds with the Dockerfile of the service and mapping of the volumes (Dockerfiles are not covered by the ASAB Maestro at all.)config- Specific configuration required on the top of the general and generated configuration written in YAML format.
define:
type: rc/descriptor
name: ASAB Remote Control
descriptor:
image: docker.teskalabs.com/asab/asab-remote-control
volumes:
- "{{SITE}}/{{INSTANCE_ID}}/conf:/conf:ro"
asab:
configname: conf/asab-remote-control.conf
config: {}
The configuration is being composed in this order:
- The most important is the generated configuration and it overrides any other. This is the configuration provided from the cluster technologies.
- Second is the service configuration governed by ASAB Config, editable from the Web UI.
- General configuration is also inside ASAB Config and reachable from Web UI. This configuration is common for all ASAB Services. It consists of Library and SMTP Server configuration.
- Configuration present in the model. Instance configuration overrides service configuration.
- Configuration from the descriptor of the service.
- Last but not least is the default configuration. It ensures that the service gets connected to Library.
{ "library": { "providers": [ "zk:///library", "git+https://github.com/TeskaLabs/asab-maestro-library.git", ], } }
ASAB Governator technology
Extends configuration of ASAB Governator instances to provide up-to-date connection urls of all ASAB Remote Control instances in the cluster. It does not affect other services.
Part of the ASAB Governator configuration created by the tech:
[remote_control]
url=http://asab-remote-control-1:8891/rc
http://asab-remote-control-2:8891/rc
http://asab-remote-control-3:8891/rc
ASAB Config technology
Descriptors can specify default cluster configurations thanks to ASAB Config technology.
Descriptor section asab-config
This technology reads asab-config section from all descriptors and creates cluster configuration.
E.g. Kafdrop descriptor specifies configuration file Kafdrop.json for configuration type Tools:
define:
type: rc/descriptor
name: Kafdrop
url: https://github.com/obsidiandynamics/kafdrop
descriptor:
image: obsidiandynamics/kafdrop
environment:
SERVER_PORT: 9000 # this is the only working port
SERVER_SERVLET_CONTEXTPATH: /kafdrop
KAFKA_BROKERCONNECT: '{{KAFKA_BOOTSTRAP_SERVERS}}'
asab-config:
Tools:
Kafdrop:
file:
{
"Tool": {
"image": "media/tools/kafka.svg",
"name": "Kafdrop",
"url": "/kafdrop"
},
"Authorization": {
"tenants": "system"
}
}
if_not_exists: true
The instruction in the descriptor is to create configuration Kafdrop of type Tools. Inside the Kafdrop configuration, you can see two sections: file and if_not_exists.
filesection expects configuration file, a json file directly inserted into the descriptor (as here in the example). The other option is to specify a file from the/Site/Files/<service_id>/directory of the Library, similarly as in thefilessection of the descriptor.if_not_existsallows only two options:trueorfalse. Default isfalse- it means that the configuration is uploaded and updated according to the descriptor everytime the model is being applied. Whentrue, the configuration is created only if it does not yet exist. That means, that such configuration can be changed manually and won't be overwritten by the automatic actions of ASAB Remote Control. On the other hand, such configuration is not updated with new versions of the descriptor.
Elasticsearch in ASAB Maestro
Elasticsearch technology extends Elasticsearch service configuration and connects Elasticsearch to other services.
Parameters
List of parameters created by Elasticsearch tech, available to the model and descriptors whenever Elasticsearch is present in the installation.
- ELASTIC_HOSTS_KIBANA
-
A string from URLs to all ElasticSearch master nodes.
"[http://lmc01:9200, http://lmc02:9201, http://lmc03:9202]"Kibana descriptor
define: type: rc/descriptor name: Kibana url: https://www.elastic.co/kibana descriptor: image: docker.elastic.co/kibana/kibana volumes: - "{{SITE}}/{{INSTANCE_ID}}/config:/usr/share/kibana/config" files: - "config/kibana.yml": | # https://github.com/elastic/kibana/blob/main/config/kibana.yml server.host: {{NODE_ID}} elasticsearch.hosts: {{ELASTIC_HOSTS_KIBANA}} elasticsearch.username: "elastic" elasticsearch.password: {{ELASTIC_PASSWORD}} xpack.monitoring.ui.container.elasticsearch.enabled: true server.publicBaseUrl: {{PUBLIC_URL}}/kibana server.basePath: "/kibana" server.rewriteBasePath: true - ELASTIC_PASSWORD
-
A secret allowing access and write operations to Elasticsearch.
Configuration of ASAB Services
Every ASAB Service obtains elasticsearch configuration section.
[elasticsearch]
url=http://lmc01:9200
http://lmc02:9201
http://lmc03:9202
username=elastic
password=<ELASTIC_PASSWORD>
Elasticsearch configuration
Environment variables
There are several environment variables in the Elasticserach descriptor set to null and replaced by the tech.
- node.roles
-
Roles are read from the model for each instance The names specified for each instance (master, hot, warm, cold) are translated into node.riles as followed:
- master ->
node.roles=master,ingest - hot ->
node.roles=data_content,data_hot - warm ->
node.roles=data_warm - cold ->
node.roles=data_cold
No other names and tiers are supported by Elasticsearch, nor ASAB Maestro.
- master ->
- http.port
-
Every Elasticsearch instance gets assigned a unique port based on its role. All master instances start at 9200, all hot instances start at 9250, all warm instances start at 9300, all cold instances start at 9350.
- transport.port
-
Every Elasticsearch instance gets assigned a unique port for inner (inter-elastic) communication. All master instances start at 9400, all hot instances start at 9450, all warm instances start at 9500, all cold instances start at 9550.
- cluster.initial_master_nodes
-
All master instances of Elasticsearch.
- discovery.seed_hosts
-
All master nodes excluding the one being configured.
- ES_JAVA_OPTS
-
If
-Xmsis not set, yet, it is set to-Xms2gfor master nodes and-Xms28gfor other nodes. If-Xmxis not set, yet, it is set to-Xmx2gfor master nodes and-Xmx28gfor other nodes.
Certificates
Communication of the Elasticsearch instances is secured by certificates. Certificates are generated by the ASAB Remote Control, using its certificate authority.
Nginx configuration
Ports assigned to the master nodes are propagated to Nginx configuration to create an upstream record for the elasticsearch service.
InfluxDB in ASAB Maestro
Extends InfluxDB service configuration and enables other services to connect to the InfluxDB.
Parameters
Organization and bucket parameters of InfluxDB configuration are set strictly as follows:
- INFLUXDB_ORG
-
system - INFLUXDB_BUCKET
-
metrics
Configuration of ASAB Services
Every ASAB Service obtains asab:metrics and asab:metrics:influxdb configuration sections.
[asab:metrics]
target=influxdb
[asab:metrics:influxdb]
url=http://influxdb:8086/
token=I1x1URqoTP31o6lmnZO1gbm_FkskGoIkRnsVKoJLmLSOd8YQQNoLBkRpDzSxVJR17JoFQ3DvMXcmJn9ItjLoTQ
bucket=metrics
org=system
Environment variables
- DOCKER_INFLUXDB_INIT_USERNAME and DOCKER_INFLUXDB_INIT_PASSWORD
-
ASAB Maestro creates and stores (in Vault) admin access into the InfluxDB.
Kafka in ASAB Maestro  
Provides connection to all service through dynamic ASAB configuration or KAFKA_BOOTSTRAP_SERVERS connection string.
Parameters
- KAFKA_BOOTSTRAP_SERVERS
-
Comma-separated URLs to Kafka instances
lmc01:9092,lmc02:9092,lmc03:9092
Configuration of ASAB Services
Every ASAB Service obtains kafka configuration section.
[kafka]
bootstrap_servers=lmc01:9092,lmc02:9092,lmc03:9092
Mongo DB in ASAB Maestro
Enables other services to connect to Mongo database. Parameters are also used by Mongo and SeaCat Auth sherpas.
Parameters
- MONGO_HOSTNAMES
-
comma-separated instance ids of all Mongo instances
mongo-1,mongo-2,mongo-3 - MONGO_URI
-
URI to all Mongo instances
mongodb://mongo-1,mongo-2,mongo-3/?replicaSet=rs0 - MONGO_REPLICASET
- is set to
rs0
Configuration of ASAB Services
Every ASAB Service obtains mongo configuration section.
[mongo]
url=mongodb://mongo-1,mongo-2,mongo-3/?replicaSet=rs0
NGINX in ASAB Maestro
NGINX technology provides:
- Application gateway capabilities
- Load balancing
- Service discovery
- Authorization for other services in the cluster
Servers
ASAB Maestro organizes NGINX configuration into following structure:
- HTTP server:
http, see the config - HTTPS server:
https, see the config - Internal HTTP server on a port tcp/8890:
internal, see the config - Upstreams
NGINX configuration in descriptors
nginx section of a descriptor provides information about how the respective service expects the NGINX to be configured.
It means that it specifies proxy forwarding rules that expose the microservice API.
The example of a descriptor /Site/.../Descriptors/foobar.yaml:
define:
type: rc/descriptor
...
nginx:
api:
port: 5678
upstreams:
upstream-foobar-extra: 1234
https:
location = /_introspect:
- internal
- proxy_method POST
- proxy_pass http://{{UPSTREAM}}/introspect
- proxy_ignore_headers Cache-Control Expires Set-Cookie
location /subpath/api/foobar:
- rewrite ^/subpath/api/(.*) /$1 break
- proxy_pass http://upstream-foobar-extra
server:
- ssl_client_certificate shared/custom-certificate.pem
- ssl_verify_client optional
NGINX configuration to YAML conversion
NGINX configuration in ASAB Maestro is translated into YAML, so it can be included in the model or descriptors.
Following NGINX configuration snipplet:
location /api/myapp {
rewrite ^/api/myapp/(.*) /myapp/$1 break;
proxy_pass http://my-server:8080;
}
becomes in ASAB Maestro YAML files:
location /api/myapp:
- rewrite ^/api/myapp/(.*) /myapp/$1 break
- proxy_pass http://my-server:8080
Similarly, you can add configuration to server block:
server:
- ssl_client_certificate shared/lmio-receiver/client-ca-cert.pem
- ssl_verify_client optional
Section api
api section allows quick specification of the "main" API of the service.
The key port specifies TCP port on which the API is exposed by the service.
This entry will generate respective location and upstream entries.
Full automation
The api section can be easily the only section in the nginx part of the service descriptor.
Section upstream
Defines specific upstreams for a service. Each service instance is added to the upstreams record in the NGINX configuration.
Visit Nginx docs to learn more about the upstream directive.
Example:
nginx:
upstreams:
upstream-foobar: 1234
Service foobar has published API on port tcp/1234. The additional upstream record is defined and named upstream-foobar.
Assuming three instances of foobar service on three nodes, the resulting upstream configuration is:
upstream upstream-foobar {
keepalive 32;
server server1:3081;
server server2:3081;
server server3:3081;
}
Advanced usage of upstreams
You can define an upstream as a list to add more configuration options.
For example, SeaCat Auth, an authorization server, requires that requests from one user during a single session are sent to the same instance of the service. NGINX can ensure this using the ip_hash balancing method.
Here is the descriptor section defining upstreams for SeaCat Auth:
nginx:
upstreams:
upstream-seacat-auth-public:
- port 3081
- ip_hash
upstream-seacat-auth-private:
- port 8900
- ip_hash
Considering node1 and node2 are hostnames of the nodes in the cluster, the resulting NGINX configuration for the upstreams will be:
upstream upstream-seacat-auth-public {
keepalive 32;
server node1:3081;
server node2:3081;
ip_hash;
}
upstream upstream-seacat-auth-private {
keepalive 32;
server node1:8900;
server node2:8900;
ip_hash;
}
In the list, you can specify any additional configuration you want to add to the upstream configuration.
The port directive is not used by NGINX directly but is processed by Maestro.
The server configuration is added for each instance of the service (in this case, SeaCat Auth) present in the cluster.
Server configuration
Other possibilities are implemented for each server separately (http, https, internal).
Additional locations can be specified for the server.
Section location
Typically, a proxy configuration of the particular component or the location of the statically served content.
Each additional location is added to the nginx configuration once per service, unless INSTANCE_ID parameter is used in the header of the location. Then, the location is introduced for each instance.
Section server
Server-block configuration.
Model-level NGINX configuration
You can specify custom NGINX configuration on the model-level. It overrides generated configuration.
In the example, extra section in the model.yaml adds location "/my-special-location" to https server.
define:
type: rc/model
...
nginx:
https:
location /my-special-location:
- gzip_static on
- alias /webroot/lmio-webui/dist
You can set also server and upstream configuration. port option in the upsstream configuration is not supported in model overrides.
Web applications distribution
NGINX technology serves web applications.
webapp-dist sherpa downloads and installs web applications defined in the model.
Web applications are deployed (if needed) everytime the model is applied (i.e. "up" command is issued).
Example of model.yaml:
define:
type: rc/model
...
webapps:
/: My Web application
/auth: SeaCat Auth WebUI
/influxdb: InfluxDB UI
...
The section webapps in the model prescribes deployment of three web applications:
- "My Web application" will be deployed to
/location of the HTTPS server - "SeaCat Auth WebUI" will be deployed to
/authlocation of the HTTPS server - "InfluxDB UI" will be deployed to
/influxdblocation of the HTTPS server
Supported web application types:
SeaCat Auth in ASAB Maestro
SeaCat Auth is an open-source access control technology developed in TeskaLabs.
Integration to ASAB Maestro ensures automatic introspection for all api locations on the https server.
"Mongo content" sherpa of SeaCat Auth service creates records in the auth database of Mongo. It helps to integrate authorization of 3rd party services.
Other services can add extra configuration of SeaCat Auth instances if needed.
Descriptor section seacat-auth
Every descriptor can use seacat-auth section to add configuration section to the SeaCat Auth service and equired data to auth Mongo database.
seacat-auth:
config:
"batman:elk":
url: "http://{{NODE_ID}}:9200"
username: elastic
password: "{{ELASTIC_PASSWORD}}"
content:
- "cl.json": |
[{
"_id": "kibana",
"application_type": "web",
"authorize_anonymous_users": false,
"client_name": "Kibana",
"code_challenge_method": "none",
"grant_types": [
"authorization_code"
],
"redirect_uri_validation_method": "prefix_match",
"redirect_uris": [
"{{PUBLIC_URL}}/kibana"
],
"response_types": [
"code"
],
"token_endpoint_auth_method": "none",
"cookie_entry_uri": "{{PUBLIC_URL}}/api/cookie-entry",
"client_uri": "{{PUBLIC_URL}}/kibana"
}]
Section seacath-auth:config
Add configuration to all SeaCat Auth instances in YAML format.
Section seacat-auth:content
Similarly as in the files section of the descriptor, this is a list of records.
Each record is either a name of a file inside /Site/Files/<service_id>/ directory or a key:value record with key being the file name and value the file itself written as string.
The name of the file must correspond with target Mongo collection name.
Interaction with NGINX configuration
Presence of SeaCat Auth in the cluster adds introspection to NGINX configuration. Introspection endpoint is added and all NGINX locations originated from the nginx:api adopt this introspection.
With SeaCat Auth in the cluster, only authorized requests can pass to the back-end services.
For internal communication among the services use internal HTTP nginx server
In example, asab-governator location that requires introspection endpoint (handled by the SeaCat Auth)
# GENERATED FILE!
location /api/asab-governator {
auth_request /_oauth2_introspect;
auth_request_set $authorization $upstream_http_authorization;
proxy_set_header Authorization $authorization;
rewrite ^/api/asab-governator/(.*) /$1 break;
proxy_pass http://upstream-asab-governator-8892;
# GENERATED FILE!
location = /_oauth2_introspect {
internal;
proxy_method POST;
proxy_set_body "$http_authorization";
proxy_pass http://upstream-seacat-auth-private/nginx/introspect/openidconnect;
proxy_set_header X-Request-URI "$scheme://$host$request_uri";
proxy_ignore_headers Cache-Control Expires Set-Cookie;
proxy_cache oauth2_introspect;
proxy_cache_key "$http_authorization $http_sec_websocket_protocol";
proxy_cache_lock on;
proxy_cache_valid 200 30s;
ZooKeeper in ASAB Maestro
ZooKeeper is the consensus technology for ASAB Maestro. All other services need to communicate with ZooKeeper to access cluster-level data. Thus, ZooKeeper Server string is provided as parameter to all services and ASAB services get [zoookeeper] configuration section from the ZooKeeper Tech.
Parameters
- ZOOKEEPER_SERVERS
-
Comma separated addresses to all ZooKeeper instances. In a three-node cluste (with nodes named lm1, lm2, lm3) the
ZOOKEEPER_SERVERSparameter would be replaced withlm1:2181,lm2:2181,lm3:2181string.Example
define: type: rc/descriptor name: Web-based ZooKeeper UI url: https://zoonavigator.elkozmon.com/ descriptor: image: elkozmon/zoonavigator volumes: - "{{SLOW_STORAGE}}/{{INSTANCE_ID}}/logs:/app/logs" environment: HTTP_PORT: "9001" CONNECTION_ZK_NAME: Local ZooKeeper CONNECTION_ZK_CONN: "{{ZOOKEEPER_SERVERS}}" AUTO_CONNECT_CONNECTION_ID: ZK BASE_HREF: /zoonavigator
Configuration of ASAB Services
Every ASAB Service obtains zookeeper configuration section.
[zookeeper]
servers=lmc01:2181,lmc02:2181,lmc03:2181
Environment variables
Available for the respective ZooKeeper instance only.
- ZOO_MY_ID
-
Instance number of each ZooKeeper instance becomes
ZOO_MY_IDenvironment variable of the ZooKeeper (Docker) container. That's why renaming of the ZooKeeper instances in the model could be problematic.
Consensus
Consensus in ASAB Maestro
LogMan.io is a cluster technology. This fact brings high availability and security to the product. However, it also brings higher complexity of the system. Many services and microservices need to communicate among the cluster and share data. We use Apache ZooKeeper as a consensus technology in the distributed system. In ZooKeeper, all services have access to a "common truth" wherever in the cluster they are.
The core of the "common truth" is stored in the /asab node of the ZooKeeper.
/asab content
/asab/ca- Certificate Authority/asab/config- Cluster Configuration/asab/docker- stores Docker configuration shared among the cluster, including credentials for Docker registry./asab/nodes- Connected cluster nodes/asab/run- data advertised by running ASAB microservices/asab/vault- storage of secrets
You might notice that some pieces of information about the cluster overlap. To provide reliable data about the cluster, we use multiple data sources. You might notice multiple service discovery strategies and multi-level monitoring.
Certificate Authority
ASAB Remote Control creates and operates internal Certificate Authority (CA).
Technologies using CA
Elasticsearch
Communication among Elasticsearch instances is secured by custom certificates, automatically generated by ASAB Remote Control during ElasticSearch installation.
Nginx
Nginx is supplied by default with SSL certificates from local CA.
Cluster Configuration
It stores custom configuration options specific to the deployment and very often common for multiple services in the cluster.
ASAB Config
The ASAB Config microservice is probably the smallest microservice in the LogMan.io ecosystem, although this does not lessen its importance. It provides REST API to the content of the cluster configuration, mainly used by the Web UI.
The configuration is accessible and editable from the Web UI.
Oragnization of cluster configuration
Cluster configuration is organized by configuration types. Each type (e.g. Discover, Tenants) provides JSON schema describing the nature of the configuration files.
Each configuration file has to match with JSON schema of its type.
/asab/config ZooKeeper node structure:
- /asab/config/
- Discover/
- lmio-system-events.json
- lmio-system-others.json
- Tenants/
- system.json
Example of asab/config/Tenants JSON schema:
{
"$id": "Tenants schema",
"type": "object",
"title": "Tenants",
"description": "Configure tenant data",
"default": {},
"examples": [
{
"General": {
"schema": "/Schemas/ECS.yaml",
"timezone": "Europe/Prague"
}
}
],
"required": [],
"properties": {
"General": {
"type": "object",
"title": "General tenant configuration",
"description": "Tenant-specific data",
"default": {},
"required": [
"schema",
"timezone"
],
"properties": {
"schema": {
"type": "string",
"title": "Schema",
"description": "Absolute path to schema in the Library",
"default": [
"/Schemas/ECS.yaml",
"/Schemas/CEF.yaml"
],
"$defs": {
"select": {
"type": "select"
}
},
"examples": [
"/Schemas/ECS.yaml"
]
},
"timezone": {
"type": "string",
"title": "Timezone",
"description": "Timezone identifier, e.g. Europe/Prague",
"default": "",
"examples": [
"Europe/Prague"
]
}
}
}
},
"additionalProperties": false
}
Example of /asab/config/Tenants/system.json:
{
"General": {
"schema": "/Schemas/ECS.yaml",
"timezone": "Europe/Prague"
}
}
Cluster Nodes
Example of /asab/nodes organization:
- /asab/nodes/
- cluster_node_1/
- governator-<uuid>.json
- info.json
- mailbox/
- cluster_node2/
- cluster_node3/
Warning
There is a terminological contradiction that is particularly unfortunate in this chapter. In ASAB Maestro, the word "node" is reserved for a "cluster node" - typically an isolated server connected via a network to the other servers that make up the cluster.
However, ZooKeeper technology uses the term "node" for its file structure. ZooKeeper nodes can contain both data and child nodes. Comparing to a file system, each node behaves as both a file and a directory. Where possible, we refer to ZooKeeper nodes as files and directories. When the node is used both to store data and child nodes, this simplification does not work. Then, the terms "cluster node" and "ZooKeeper node" are used for clarification.
Cluster node
Each ZooKeeper node inside /asab/nodes (e.g. cluster_node_1/) contain IP address of the connected cluster node.
ip:
- 10.25.128.81
ASAB Governator connection
governator-<uuid>.json file contains information about websocket connection from the ASAB Governator instance present on that cluster node.
Each connection is labeled by an uuid to prevent overlapping of two connection attempts. However, one cluster node should create only one Remote Control-Governator connection.
{"address": "10.25.128.81", "rc_node_id": "cluster_node_1"}
Cluster node detailed info
info.json contains data about the node gathered by the ASAB Governator. It is periodically updated but not collected. Historical data are not present. Instead, follow ASAB metrics, InfluxDB and Grafana dashboards to gain infromation about the cluster health in time.
Mailbox
The mailbox/ directory helps manage tasks between two types of services.
ASAB Remote Control instances are identical across the cluster and can substitute for each other.
In contrast, ASAB Governator microservices are unique to each node and cannot be replaced by others.
The mailbox acts as a link between these services, enabling communication and task coordination.
When a user sends instructions from the Web UI, the mailbox helps ASAB Remote Control instances find and communicate with the correct ASAB Governator to execute the task.
ASAB Remote Control instance with the instructions from the user "sends a message" to ASAB Remote Control instance with the target ASAB Governator connection.
Running ASAB microservices
Each instance of a ASAB microservice can actively advertise data about itself to the consensus.
Ephemeral and sequenced ZooKeeper nodes are used. It means that:
- Each running instance creates a ZooKeeper node.
- Each node is connected to the running microservice. When microservice stops, the ZooKeeper node disappears.
What you can learn from this data about each instance of ASAB microservices:
- The instance is up and running
- Cluster node on which it is running
- Containerization technology (Docker, Podman or none)
- Image version and when and how it was built
- Time when the container was created and launched
- Port open for web requests
- Health if such microservice can indicate that
This data advertised by running ASAB microservices are among the inputs of cluster monitoring and serve in service discovery.
Example of /asab/run ZooKeeper node:
- /asab/run/
- ASABConfigApplication.0000000108
- ASABConfigApplication.0000000115
- ASABConfigApplication.0000000144
- ASABGovernatorApp.0000000095
- ASABGovernatorApp.0000000098
- ASABGovernatorApp.0000000104
- ASABLibraryApplication.0000000113
- ASABLibraryApplication.0000000114
- ASABLibraryApplication.0000000147
- ASABRemoteControlApp.0000000109
- ASABRemoteControlApp.0000000110
- ASABRemoteControlApp.0000000107
Example of /asab/run/ASABConfigApplication.0000000108:
{
"host": "asab-config-3",
"appclass": "ASABConfigApplication",
"launch_time": "2023-12-19T09:52:46.468038Z",
"process_id": 1,
"instance_id": "asab-config-3",
"node_id": "lmc03",
"service_id": "asab-config",
"containerized": true,
"created_at": "2023-11-06T17:18:54.206827Z",
"version": "v23.45",
"CI_COMMIT_TAG": "v23.45",
"CI_COMMIT_REF_NAME": "v23.45",
"CI_COMMIT_SHA": "cf3be4570f363b8e9ed400ffbaea8babac957688",
"CI_COMMIT_TIMESTAMP": "2023-11-06T17:15:54+00:00",
"CI_JOB_ID": "55305",
"CI_PIPELINE_CREATED_AT": "2023-11-06T17:16:58Z",
"CI_RUNNER_ID": "74",
"CI_RUNNER_EXECUTABLE_ARCH": "linux/amd64",
"web": [
[
"0.0.0.0",
8894
]
]
}
Containers managed by ASAB Maestro
Hostname and container name
The hostname and the container_name is set to INSTANCE_ID (ie mongo-1).
/etc/hosts
/etc/hosts is provided by the ASAB Maestro with the names and IP addresses of all instances in the cluster.
This is used for service discovery purposes.
Example of the /etc/hosts:
# This file is generated by ASAB Remote Control
# WARNING: DON'T MODIFY IT MANUALLY !!!
127.0.0.1 localhost
::1 localhost ip6-localhost ip6-loopback
fe00::0 ip6-localnet
ff00::0 ip6-mcastprefix
ff02::1 ip6-allnodes
ff02::2 ip6-allrouters
# Nodes
192.168.64.1 node1
192.168.64.2 node2
# Instances
192.168.64.1 zoonavigator-1
192.168.64.1 nginx-1
192.168.64.1 mongo-1
192.168.64.1 seacat-auth-1
192.168.64.2 zookeeper-1
192.168.64.2 asab-governator-1
192.168.64.2 asab-library-1
192.168.64.2 asab-config-1
Note
The hosts file is located at /opt/site/hosts and mounted into containers.
Environment variables
Following environment variables are made available to each instance:
NODE_IDSERVICE_IDINSTANCE_ID
Note
Other environment variables can be provided by technologies.
Service Discovery
Service discovery in ASAB Maestro is a group of techniques how to find and reach specific service in the cluster network.
Identity
Each instance is provided with three identifiers:
- NODE_ID - identifier of the cluster node
- SERVICE_ID - name of the service
- INSTANCE_ID - identifier of the instance
This allows to search the services in various situations by the same names.
NGINX proxy server
nginx:api option in the descriptors creates standardized Nginx configuration.
Example of ASAB Library descriptor:
define:
type: rc/descriptor
name: ASAB Library
descriptor:
image: docker.teskalabs.com/asab/asab-library
volumes:
- "{{SITE}}/{{INSTANCE_ID}}/conf:/conf:ro"
- "{{SLOW_STORAGE}}/{{INSTANCE_ID}}:/var/lib/asab-library"
asab:
configname: conf/asab-library.conf
config: {}
nginx:
api: 8893
All instances are supplied with a location inside the Nginx configuration.
location /api/<instance_id> {
...
}
Moreover, each service has its location and respective upstreams record. Your request is proxied to a random instance of the service.
location /api/<service_id> {
...
}
These locations are accessible in the:
- HTTPS server behind OAuth2 introspection (when authorization server like SeaCat Auth is installed) to be used mainly by Web UI,
- and the
internalserver. This one is accessible from within the cluster, must not be open to the internet and serves for internal communication of backend services.
PUBLIC_URL
It is crucial for the HTTPS server functionality and successful authorization to set PUBLIC_URL parameter in the model.
define:
type: rc/model
services:
zoonavigator:
instances: {1: {node: "lmc01"} }
params:
PUBLIC_URL: "https://maestro.logman.io"
Custom /etc/hosts
Each running container is supplied by custom and automatically actualized configuration inside /etc/hosts. IP address of each service or instance is resolved using respective INSTANCE_ID or SERVICE_ID.
Example of /etc/hosts inside the container:
# This file is generated by ASAB Remote Control
# WARNING: DON'T MODIFY IT MANUALLY !!!
127.0.0.1 localhost
::1 localhost ip6-localhost ip6-loopback
fe00::0 ip6-localnet
ff00::0 ip6-mcastprefix
ff02::1 ip6-allnodes
ff02::2 ip6-allrouters
# Nodes
10.35.58.41 lmc02
10.35.58.194 lmc03
10.35.58.88 lmc01
# Instances
10.35.58.88 zoonavigator-1
10.35.58.88 mongo-1
10.35.58.41 mongo-2
10.35.58.194 mongo-3
10.35.58.88 seacat-auth-1
10.35.58.88 nginx-1
10.35.58.88 asab-config-1
10.35.58.41 asab-config-2
10.35.58.194 asab-config-3
10.35.58.88 asab-governator-1
10.35.58.41 asab-governator-2
10.35.58.194 asab-governator-3
10.35.58.88 asab-library-1
10.35.58.41 asab-library-2
10.35.58.194 asab-library-3
10.35.58.88 asab-remote-control-1
10.35.58.41 asab-remote-control-2
10.35.58.194 asab-remote-control-3
10.35.58.88 zookeeper-1
10.35.58.41 zookeeper-2
10.35.58.194 zookeeper-3
# Services
10.35.58.88 zoonavigator
10.35.58.88 mongo
10.35.58.41 mongo
10.35.58.194 mongo
10.35.58.88 seacat-auth
10.35.58.88 nginx
10.35.58.88 asab-config
10.35.58.41 asab-config
10.35.58.194 asab-config
10.35.58.88 asab-governator
10.35.58.41 asab-governator
10.35.58.194 asab-governator
10.35.58.88 asab-library
10.35.58.41 asab-library
10.35.58.194 asab-library
10.35.58.88 asab-remote-control
10.35.58.41 asab-remote-control
10.35.58.194 asab-remote-control
10.35.58.88 zookeeper
10.35.58.41 zookeeper
10.35.58.194 zookeeper
Consensus and data advertised by running ASAB microservices
Each ASAB microservice advertise data about itself to the consensus. This data contain NODE_ID, SERVICE_ID and INSTANCE_ID resolved thanks to the custom /etc/hosts and port. ASAB framework also offers boiler plate code to use aiohttp client requests with only the SERVICE_ID or INSTANCE_ID of the target service. Thus, each ASAB microservice has tools to access any other ASAB microservice in the cluster.
Example of python code within ASAB application using Discovery Service
async def proxy_to_iris(self, json_data):
async with self.App.DiscoveryService.session() as session:
try:
async with session.put("http://asab-iris.service_id.asab/send_mail", json=json_data) as resp:
response = await resp.json()
except asab.api.discovery.NotDiscoveredError:
raise RuntimeError("ASAB Iris could not be reached.")
ASAB Governator
The ASAB Governator - or asab-governator - is a microservice that has to run on each cluster node.
Connection to ASAB Remote Control
The ASAB Governator is connected to the ASAB Remote Control.
The local (ie localhost) connection is preffered for core nodes but ASAB Governator will connect to other ASAB Remote Control instances if the local one is not present.
ASAB Governator will reconnect (if possible) to the local instance eventually.
Housekeeping
The ASAB Governator schedules regularly docker system prune command to remove old and unused container images and other data.
Merge Algorithm
This algorithm is an integral piece of composability in ASAB Maestro.
ASAB Maestro composes various artifacts into a site configuration. In examples:
- You can override descriptor in the model
- Generated configuration of Elasticsearch is provided to each configuration file of each ASAB microservice.
Every declaration or configuration can be transformed into an object (or Python dictionary) or an array (or Python list) or their combination.
The merge algorithm takes two objects (dictionaries) signed with preference. One object is always "more important". When the objects start merging together, their content is compared. If their content is completely different, the resulting object contains all the information from both of them. When there's a conflict, both the objects contain the same key, only the value from the "more important" object is taken into the result. If two arrays are compared, the result is the sum of the arrays (lists).
Event Lane Manager
LogMan.io Event Lane Manager
TeskaLabs LogMan.io Event Lane Manager (or LogMan.io Elman for short) is a microservice responsible for event lane management.
- Read more about event lanes and their declarations in Event Lane.
- Read more about the functionality of LogMan.io Elman and automatic creation of event lanes in Streams
- For the deployment of LogMan.io Elman microservice, see Configuration.
Configuration
Dependencies
- Apache Zookeeper is used for reading the tenant configuration.
- Apache Kafka is used for management of Kafka topics and automatic detection of new streams.
- ASAB Remote Control is needed for creation of LMIO Parsecs.
- ASAB Library is needed for uploading event lanes to Library.
Required configuration
[kafka]
bootstrap_servers=kafka-1:9092,kafka-2:9092,kafka-3:9092
[zookeeper]
servers=zookeeper-1:2181,zookeeper-2:2181,zookeeper-3:2181
[library]
providers=
zk:///library
# (more layers if needed...)
Optional configuration
Optionally, number of partitions and retention policy can be configured in [kafka] section.
[kafka]
enabled=true # Can be disabled
partitions=6 # (default: 6) he default number of partitions of Kafka received, events and others topics
retention.ms_max=604800000 # (default: 7 days) The maximal retention of Kafka topics, decreased to optimal if higher
retention.ms_min=172800000 # (default: 24 hours) The minimal retention of Kafka topics, increased to optimal if lower
retention.ms_optimal=259200000 # (default: 3 days) The optimal retention of Kafka topics
Event Lane
When you connect a new log source in LogMan.io Collector provisioned to one tenant, events will start sending to LogMan.io Archive. LogMan.io Receiver will create a new stream for these events to store them in logical order. Therefore, every tenant owns multiple streams. Events from a particular stream can be (immediately or afterward) pulled from the Archive for parsing and storing in Elasticsearch database for further analysis.
To create a logical data stream in LogMan.io (from Archive through Kafka to Elasticsearch) and connect the adjacent content in Library(dashboards, reports, correlations, etc), the concept of event lane is used. The event lane is represented by a declaration in Library which determines:
- what parsing rules will be applied for the data stream
- what Library content is assigned to the data stream
- categorization of the data stream (e.g. categorization of the technology that is producing such events)
- what schema is used for the final structured data
- what additional enrichment will be applied to the stream
- configuration entries of the technologies operating with the data (Kafka, Elasticsearch)
The following image illustrates the process in the example, where the new log source
(Fortinet FortiGate) is connected (under operating tenant mytenant):
- LogMan.io Receiver collects the incoming events and stores the data in Archive in the stream
fortinet-fortigate-10110for tenantmytenant. - These events can be pulled back from the Archive for parsing. There are sent to Kafka topic
received.mytenant.fortinet-fortigate-10110. - LogMan.io Elman detects this topic, assigns a new event lane and creates single or multiple instances of LogMan.io Parsec.
- LogMan.io Parsec consumes raw events from that topic and sends the successfully parsed events and unparsed events to Kafka topics
events.mytenant.fortinet-fortigate-10110andothers.mytenant, respectively. - LogMan.io Depositor consumes events from those topics and stores them in Elasticsearch indices
lmio-mytenant-events-fortinet-fortigate-10110andlmio-mytenant-others.
Event Lane declaration
Event Lane declaration is specified in a YAML file in Library.
The following example is event lane declaration for log source Microsoft 365 and tenant mytenant:
define:
name: Microsoft 365
type: lmio/event-lane
timezone: UTC
parsec:
name: /Parsers/Microsoft/365/
content:
reports: /Reports/Microsoft/365/
dashboards: /Dashboards/Microsoft/365/
kafka:
received:
topic: received.mytenant.microsoft-365-v1
events:
topic: events.mytenant.microsoft-365-v1
others:
topic: others.mytenant
elasticsearch:
events:
index: lmio-mytenant-events-microsoft-365-v1
others:
index: lmio-mytenant-others
Define
The define part specifies the type of declaration and
the properties of event lane used for parsing and analyzing the data, such as used schema, timezone and charset.
define:
name: Microsoft 365
type: lmio/event-lane
schema: /Schemas/ECS.yaml # (optional, default: /Schemas/ECS.yaml)
timezone: Europe/Prague # (optional, default is obtained from the tenant configuration)
charset: utf-8 # (optional, default: utf-8)
Parsec
Section parsec refers to the microservice LogMan.io Parsec. In particular, parsec/name is the directory for parsing rules in Library. It has to always start with /Parsers/:
parsec:
name: /Parsers/Microsoft/365/
Content
Section content refers to the event lane content in the Library, such as dashboards, reports, correlations, etc.
When a new event lane is created, LogMan.io Elman automatically enables the content described in this section.
content:
# Entire directory, described as a single string
dashboards: /Dashboards/Microsoft/365/
# Multiple items described as a list
reports:
- /Reports/Microsoft/365/Daily Report.json
- /Reports/Microsoft/365/Weekly Report.json
- /Reports/Microsoft/365/Monthly Report.json
Kafka, Elasticsearch
Sections kafka and elasticsearch specify properties of Kafka topics and Elasticsearch indexes which belong to that event lane. These are important for LogMan.io Parsec and LogMan.io Depositor.
The most important property is the name of received, events, and others topics and lmio-events and lmio-others indexes.
Kafka topics follow the naming convention:
<type>.<tenant>.<stream>
Elasticsearch indexes follow the naming convention:
lmio-<tenant>-<type>-<stream>
where:
typecan bereceived,eventsorotherstenantis the name of the tenantstreamis the name of the log stream
kafka:
received:
topic: received.mytenant.microsoft-365-v1
events:
topic: events.mytenant.microsoft-365-v1
others:
topic: others.mytenant
elasticsearch:
events:
index: lmio-mytenant-events-microsoft-365-v1
others:
index: lmio-mytenant-others
Note
Every tenant has only one others topic, therefore, there is no specification of the stream in others topic and index.
Furthermore, additional properties of Elasticsearch (such as number of shards, index lifecycle etc) are configured in elasticsearch section. Read more in LogMan.io Depositor documentation.
Event Lane template declaration
For automatic assignment of parsing rules and Library content, event lane templates are used. When a new stream is found, LogMan.io Elman seeks for a suitable event lane template. When it is found, new event lane is automatically fulfilled with the properties of that template.
The following example illustrates the event lane template for log source Microsoft 365:
---
define:
type: lmio/event-lane-template
name: Microsoft 365
stream: microsoft-365-v1
timezone: UTC
logsource:
vendor:
- microsoft
product:
- m365
service:
- audit
- activitylogs
parsec:
name: /Parsers/Microsoft/365
content:
dashboards: /Dashboards/Microsoft/365
reports: /Reports/Microsoft/365
Define
define:
type: lmio/event-lane-template
name: Microsoft 365
stream: microsoft-365-v1
timezone: UTC
- name: Human readable name for Event Lane, derived from the technology of the log source. It is used e.g. for configuration of Discover.
- stream: The name that will be matched with the actual stream.
There can be an exact match (such as in
microsoft-365-v1), but wildcards (such as*) are allowed to match a wide range of streams (e.g.fortinet-fortigate-*). - timezone (optional): Various log sources send the events in a firmly established timezone (e.g. Microsoft 365 uses always UTC). To reflect that, timezone can be prescribed here. Otherwise, each event lane is handled manually.
Categorization
Section logsource is used for categorization of the log source connected to the event lane.
It is derived from Sigma rules.
logsource:
vendor:
- microsoft
product:
- m365
service:
- audit
- activitylogs
Parsec
Option parsec/name is the directory for parsing rules in Library. It has to always start with /Parsers/:
parsec:
name: /Parsers/Microsoft/365
Content
Section content refers to the event lane content in the Library, such as dashboards, reports, correlations, etc.
LogMan.io Elman automatically disables every content from all event lane templates. When a new event lane is created, its content is enabled.
content:
# Entire directory, described as a single string
dashboards: /Dashboards/Microsoft/365
# Multiple items described as a list
reports:
- /Reports/Microsoft/365/Daily Report.json
- /Reports/Microsoft/365/Weekly Report.json
- /Reports/Microsoft/365/Monthly Report.json
Streams in LogMan.io Elman
Detection of new streams in LogMan.io Elman
LogMan.io Elman periodically detects received.* topics in Kafka cluster.
If a new received topic without an existing event lane is found, a new event lane is created using event lane templates.
For known sources, there is an event lane template, which is used primarily for choosing parsing rules for that event lane.
LogMan.io Elman seeks an appropriate template in /Templates/EventLanes/. One of the following cases can happen:
-
The event lane template is found in the library. Parsing rules and other specific content is then copied to the event lane. After that, a model for LogMan.io Parsec is created in
/Site/and LogMan.io Elman sends UP command to ASAB Remote Control. Finally, all the content listed in the event lane is enabled in Library. -
The event lane template is not found in Library. Then an event lane is created, but the path for parsing rules is not fulfilled as well as other event lane specific content. The model is not created automatically. User action is then required. A user can fulfill suitable parsing rules manually in the event lane declaration. Finally, it is possible to update all models manually from the terminal using curl:
curl --location --request PUT 'localhost:8954/model'
Finally, one or more instances of LogMan.io Parsec are created, and the process of parsing starts.
Kafka topics
LogMan.io Elman updates properties of Kafka received.*, events.*, and others.* topics.
In particular, the number of partitions for each topic is increased and the retention policy is set. See Configuration for more details.
Library content
LogMan.io Elman disables every content from all event lane templates in Library. When a new event lane is created, its content is automatically enabled for the event lane tenant.
Integration Service
LogMan.io Integration Service
TeskaLabs LogMan.io Integration Service (LMIO Integ for short) allows TeskaLabs LogMan.io to be integrated with supported external systems via expected message format and output/input protocol.
Configuration
- Default port:
8959
LMIO Integ requires only the minimal configuration:
[zookeeper]
servers=zookeeper-1:2181,zookeeper-2:2181,zookeeper-3:2181
[kafka]
bootstrap_servers=kafka-1:9092,kafka-2:9092,kafka-3:9092
[library]
providers=/library
Integrations are specified in event lanes.
Event Lane
Integrations are declared in event lanes. Each event lane can provide one or more integrations. Events are always sent from Kafka events topic that must be present in the event lane declaration.
---
define:
type: lmio/event-lane
name: Fortinet FortiGate (10040)
kafka:
events:
topic: events.mytenant.fortinet-fortigate-10040 # (required)
others:
topic: others.mytenant
integrations:
arcsight:
output_type: tcp
address: "127.0.0.1 8884"
# other configuration for arcsight integration
bsd_syslog:
output_type: tcp
address: "127.0.0.1 7999"
# other configuration for bsd syslog integration
output_type:
- tcp: Sends messages through TCP protocol. Requires address.
- kafka: Sends messages to the dedicated Kafka topic from which it can be consumed by another service.
address: Address in the form: "destination port", e.g. 127.0.0.1 8888
Integrations
Micro Focus ArcSight SOAR
Integration with Micro Focus ArcSight SOAR sends parsed events from events topic in ArcSight Common CEF format.
Configuration:
arcsight:
output_type: tcp
address: "127.0.0.1 8884"
Schema:
---
define:
type: lmio/schema
deviceEventClassId_field: deviceEventClassId
name_field: name
severity_field: severity
Example output
CEF:0|TeskaLabs|LogMan.io|1.0|<deviceEventClassId_field>|<name_field>|<severity_field>| {
"@timestamp": "2024-09-30T02:30:13.343068Z",
"ecs.version": "1.10.0",
"event.action": "high-download-rate",
"event.dataset": "complex",
"event.kind": "alert",
"related.events": [],
"rule.description": "This baseliner observes logs that indicate file download activity and checks if a user exceeds the expected rate of downloads. It tracks download activity across a defined period (day) and region (Czech Republic), analyzing patterns based on workdays, weekends, and holidays. When the user's download rate exceeds normal behavior by a significant margin (3 standard deviations above the mean), it triggers an alert for further investigation.\n",
"rule.id": "",
"rule.name": "High Download Rate",
"rule.ruleset": "lmio-library",
"tenant": "plus",
"threat.indicator.sightings": 22,
"user.id": "dolores_umbridge@hogwarts.uk",
"_id": "9c15c30d30b3b813df94393288310d17ff06364f6e9cb5bb8d374ec1ca6dd6a0"
}
BSD Syslog
Integration that produces events in BSD Syslog Format.
Configuration:
bsd_syslog:
output_type: tcp
address: "127.0.0.1"
Schema:
---
define:
type: lmio/schema
raw: event.original
principal_datetime: '@timestamp'
Example output
<14> Oct 01 12:43:25 lmio LogMan.io[1]: <30>Oct 01 12:43:13 bradavice-hagrid ntopng[1007416]: ....
Field
Field integration produces events with a specific field.
field:
output_type: tcp
address: "127.0.0.1"
field_name: "event.original"
Example output
{
"event.original": <30>Oct 01 12:43:13 bradavice-hagrid ntopng[1007416]: ....
}
Authorization & Authentication
TeskaLabs LogMan.io uses TeskaLabs SeaCat Auth as a component that deals with user authorization, authentication, access control, roles, tenants, multi-factor authentications, integrations with other identity providers and so on.
TeskaLabs SeaCat Auth has its dedicated documentation site.
Features
- Authentication
- Second-factor Authentication (2FA) / Multi-factor Authentication (MFA)
- Supported factors:
- Password
- FIDO2 / Webauthn
- Time-based One-Time Password (TOTP)
- SMS code
- Request header (X-Header)
-
Machine-to-Machine
- API keys
-
Authorization
- Roles
-
Role-based access control (RBAC)
-
Identity management
- Federation of identities
- Supported providers:
- File (htpasswd)
- In-memory dictionary
- MongoDB
- ElasticSearch
- LDAP and Active Directory
- Custom provider
-
Multitenancy including tenant management for other services and applications
- Session management
- Single-sign on
- OpenId Connect / OAuth2
- Proof Key for Code Exchange aka PKCE for OAuth 2.0 public clients
- Authorization/authentication introspection backend for NGINX
- Audit trail
- Provisioning mode
- Structured logging (Syslog) and telemetry
LogMan.io Commander
LogMan.io Commander allows to run the following utility commands via command line or API.
encpwd command
Passwords used in configurations can be protected by encryption.
Encrypt Password command encrypts password(s) to LogMan.io password format using AES cipher.
The passwords are then used in LogMan.io Collector declarative configuration in the following format:
!encpwd "<LMIO_PASSWORD>"
Configuration
The default AES key path can be configured in the following way:
[pwdencryptor]
key=/data/aes.key
Usage
Docker container
Command Line
docker exec -it lmio-commander lmiocmd encpwd MyPassword
API
LogMan.io Commander also serves an API endpoint, so the encpwd command
can be reached via HTTP call:
curl -X POST -d "MyPassword" http://lmio-commander:8989/encpwd
library command
Library command serves to insert library folder structure with all YAML declarations into ZooKeeper, where other components such as LogMan.io Parser and Correlator may dynamically download it from.
The folder structure can be located in the filesystem (mounted to the Docker container) or on GIT url.
This is how to initiate loading of the library into ZooKeeper cluster:
Configuration
It is necessary to properly configure the source folder and ZooKeeper output.
[source]
path=/library
[destination]
urls=zookeeper:12181
path=/lmio
The source path can be a GIT repository path prefixed with git://:
[source]
path=git://<username>:<deploy_token>@<git_url_path>.git
In this way, the library will be automatically cloned from GIT into a temporary folder, uploaded to ZooKeeper and then the temporary folder deleted.
Usage
Docker container
Command Line
docker exec -it lmio-commander lmiocmd library load
Using explicitly defined configuration:
docker exec -it lmio-commander lmiocmd -c /data/lmio-commander.conf library load
API
LogMan.io Commander also serves an API endpoint, so the library command
can be reached via HTTP call:
curl -X PUT http://lmio-commander:8989/library/load
See Docker Compose section below.
iplookup command
The iplookup command processes IP range databases and generates IP lookup files ready for use with lmio-parser IP Enricher.
It has two subcommands: iplookup from-csv for processing general CSV files and iplookup from-ip2location for processing IP2LOCATION CSV files.
Configuration
The source and destination directories can be set in a config file
[iplookup]
source_path=/data
destination_path=/data
iplookup from-csv
Reads a generic CSV file and produces an IP Enricher lookup file.
The first row of the file is expected to be the header containing the column names.
The first two columns need to be ip_from and ip_to.
Command line interface
lmiocmd.py iplookup from-csv [-h] [--separator SEPARATOR] [--zone-name ZONE_NAME] [--gzip] [--include-ip-range] file_name
Positional arguments:
file_name: Input CSV file
Optional arguments:
-h,--help: Show this help message and exit.-g,--gzip: Compress output file with gzip.-i INPUT_IP_FORMAT,--input-ip-format INPUT_IP_FORMAT: Format of input IP addresses. Defaults to 'ipv6'. Possible values:ipv6: IPv6 adrress represented as string, e.g. ::ffff:c000:02eb,ipv4: standard quad-dotted IPv4 adrress string, e.g. 192.0.2.235,ipv6-int: IPv6 adrress as a 128-bit decimal integer, e.g. 281473902969579,ipv4-int: IPv4 address as a 32-bit decimal integer, e.g. 3221226219.-s SEPARATOR,--separator SEPARATOR: CSV column separator.-o LOOKUP_NAME,--lookup-name LOOKUP_NAME: Name of output lookup. It is used as lookup zone name. By default, it is derived from input file name.--include-ip-range: Include ip_from and ip_to fields in the lookup values.--force-ipv4: Prevent mapping IPv4 addresses to IPv6. This is incompatible with IPv6 input formats.
Example usage
lmiocmd iplookup from-csv \
--input-ip-format ipv6 \
--lookup-name ip2country \
--gzip \
my-ipv6-zones.CSV
iplookup from-ip2location
This command is similar to the iplookup from-csv command above, but is tailored specifically for processing IP2Location™ CSV databases.
In case of IP2LOCATION LITE databases, the command can infer the input IP format and the column names from the file name.
However, it is possible to specify the column names explicitly
Command line interface
lmiocmd.py iplookup from-csv [-h] [--separator SEPARATOR] [--zone-name ZONE_NAME] [--gzip] [--include-ip-range] file_name
Positional arguments:
file_name: Input CSV file
Optional arguments:
-h,--help: Show this help message and exit.-g,--gzip: Compress output file with gzip.-s SEPARATOR,--separator SEPARATOR: CSV column separator. Defaults to ','.-c COLUMN_NAMES,--column-names COLUMN_NAMES: Space-separated list of column names to use. By default, it is inferred from IP2LOCATION file name.-i INPUT_IP_FORMAT,--input-ip-format INPUT_IP_FORMAT: Format of input IP addresses. By default, it is inferred from IP2LOCATION file name. Possible values:ipv6-int: IPv6 adrress as a 128-bit decimal integer, e.g. 281473902969579,ipv4-int: IPv4 address as a 32-bit decimal integer, e.g. 3221226219.-o LOOKUP_NAME,--lookup-name LOOKUP_NAME: Name of output lookup. It is used as lookup zone name. By default, it is derived from input file name.-e, --keep-empty-rows: Do not exclude rows with empty values (indicated by '-').--include-ip-range: Include ip_from and ip_to fields in the lookup values.--force-ipv4: Prevent mapping IPv4 addresses to IPv6.
Example usage
With automatic column names and input IP format:
lmiocmd iplookup from-ip2location \
--lookup-name ip2country \
--gzip \
IP2LOCATION-LITE-DB1.IPV6.CSV
With explicit column names and input IP format (the result will be equivalent to the example above):
lmiocmd iplookup from-ip2location \
--lookup-name ip2country \
--gzip \
--column names "ip_from ip_to country_code country_name" \
--input-ip-format ipv6-int
IP2LOCATION-LITE-DB1.IPV6.CSV
Docker Compose
File
The following docker-compose.yml file pulls the LogMan.io Commander
image from TeskaLabs' Docker Registry and expects the configuration file
in ./lmio-commander folder.
version: '3'
services:
lmio-commander:
image: docker.teskalabs.com/lmio/lmio-commander
container_name: lmio-commander
volumes:
- ./lmio-commander:/data
- /opt/lmio-library:/library
ports:
- "8989:8080"
The /opt/lmio-library path leads to LogMan.io Library repository.
Run the container
docker-compose pull
docker-compose up -d
Declarative language SP-Lang
TeskaLabs LogMan.io uses SP-Lang as its declarative language for parsers, enrichers, correlators and other components.
SP-Lang has its dedicated documentation site.
Elastic Common Schema (ECS)
For more details, see the official documentation.
ECS Generic attributes table
| Attribute | Description | Values as an example |
|---|---|---|
| @timestamp | Date/time when the event originated. | 2022-05-23T08:05:34.853Z |
| client.ip | The IP address of the device that was used when the activity was logged. The IP address is displayed in either an IPv4 or IPv6 address format. | 52.108.224.1 |
| cnt | Count of events. | 1 |
| destination.ip | The original destination IP address of the device that was used when the activity was logged. | 85.162.11.26 |
| ecs.version | ECS version this event conforms to. | 1.0.0 |
| event.action | Description of the original event that triggered creating of the particular log. | UserLoggedIn, MessageTrace, FilePreviewed |
| event.original | Full and unmodified log for auditing. | 10.42.42.42 - - [07/Dec ... |
| http.request.method | HTTP request is an action to be performed on a resource identified by a given Request-URL. | get |
| http.response.body.bytes | SIze of the HTTP request in bytes. | 2571 |
| http.response.status_code | HTTP response status codes indicate whether a specific HTTP request has been successfully completed. | 200 |
| http.version | Current version of the Hypertext Transfer Protocol. | 1.1 |
| host.hostname | Hostname of the host. | webserver-blog-prod |
| message | Text representation of the significant information from the event for succinct display in a log viewer. | "GET /blog HTTP/1.1" 200 2571 |
| service.name | Your custom name for this service. | Company blog |
| service.type | Type of the service used with this instance. | apache |
| source.geo.* | Fields for geo-location. | |
| url.original | Original url path. | /blog |
| user.name | Name of the user. | Albus Dumbledore |
| user_agent.* | Fields describing the user agent. | |
| event.dataset | Name of the dataset. | microsoft-office-365 |
| event.id | Unique identification value. | b4b4c44c-ff30-4ddd-bfbe-44e082570800 |
| event.ingested | Timestamp when an event arrived in the central data store. | 2022-05-23T08:05:34.853Z |
| event.kind | Value of this field can be used to inform how these kinds of events should be handled. | alert, enrichment, event, metric, state, pipeline_error, signal |
| log.original | Raw log formate that is received before the parcing process takes place. | <165>Jan 17 12:20:25 hostname %ASA-5-111010: User 'harry', running 'N/A' from IP 192.68.0.2, executed 'write memory' |
| organization.id | ID of the original source organization of an event. | TeskaLabsCom.onmicrosoft.com |
| recipient.address | E-mail address of original recipient of the message. | accounting@teskalabs.com |
| sender.address | E-mail address of original sender of the message. | support@teskalabs.com |
| source.ip | IP address of the source device or system. | 149.72.113.167 |
| tenant | Tenant identification in each event. | default |
| user.id | User identification of each event. | automata@teskalabs.com |
Library in TeskaLabs LogMan.io
Library contains declarations for parsers, enrichers, correlators, templates for emails and instant messages, dashboards, reports, and other content of TeskaLabs LogMan.io.
Library organization
Library is organized into folders with items, similar to the files on the file system.
The following example illustrates Library organization with three base folders /Baselines/, /Dashboards and /Parsers/:
/Baselines/
Dataset.yaml
Host.yaml
User.yaml
/Dashboards/
Linux/
Common/
Overview.json
/Parsers/
Linux/
Auditd/
10_parser.yaml
20_enricher.yaml
30_mapping_ECS.yaml
Common/
10_parser.yaml
20_parser_process.yaml
30_parser_message.yaml
Library path rules
Internally (in configuration of micro-services etc.), Library paths must satisfy these rules:
- Every path MUST start with "/", including the root path. Only absolute paths are used, e.g.
/Parsers/Microsoft/Exchange/. - A folder path MUST end with "/", e.g.
/Parsers/Microsoft/Exchange/. - An item path MUST end with an extension (e.g. ".txt", ".json", ...), e.g.
/Parsers/Microsoft/Exchange/10_parser.yaml - A folder name MUST NOT contain ".". An item name MUST NOT start with ".".
Note
A user cannot create new folders at the topmost / folder. Some folders do allow a user to add/edit/delete files and folders inside them, while some do not. Each Library folder has its own rules for that.
Some Library folders allow only specific file extensions.
For example: The folder /Parsers/ allows creating new folders and parsing rules ending with .yaml inside.
The folder /Homepage/ does not allow to add more items (as there is only one homepage).
The folder /Alerts/Workflow/ does not allow creating new folders inside while allowing adding or deleting the existing alert workflows.
Library layers
Library is organized into layers. Each Library layer refers to a single source of Library files and particular storage technology. Library layers are "stacked" into one view (overlayed), merging the content of each layer into one united space. This layering allows to combine a content from different sources (aka providers) into one Library. Library layers are initially configured in the product during the installation. There is no limit to the number of stacked library layers.
Schema: An example of library layers setup, the User will see items in a green box.
The example of configuration implementing the above schema.
The library is configured either centrally using ASAB Maestro or in the each microservice configuration file.
[library]
providers:
zk://
libsreg+https://libsreg1.example.com,libsreg2.example.com/my-library#v24.11
git+https://github.com/john/awesome_project.git#deployment
libsreg+https://vendor.example.com/common-library
- Layer 0 is in Apache ZooKeeper, reusing the ZooKeeper configuration from
[zookeeper]section. - Layer 1 is a "my-library" distributed using libraries registry.
- Layer 2 is from a Git (or GitHub more specifically), tracking "deployment" branch
- Layer 3 is a Vendor "common library".
Writable layer
The layer 0 is the only writable layer. It is intended to create and edit custom content. A user can edit the content of this layer using the "Library" editor in the User Interface.
Higher layers are read-only, meant for the one-directional distribution of the Library content to deployments.
If a user edits an item that is present in the read-only layers, it is stored in the layer 0, overriding the item of the same path on higher layers. This is the mechanism for how users can modify the out-of-the-box content provided by Common libraries and so on.
The layer 0 is further divided into targets, this could be a global target for content that is available for the whole deployment or a tenant target which stores the content for specific tenants. It means the tenant-specific content such as Parsers or Dashboards is stored in Layer 0, in the target "tenant".
Library layer types
Each library layer is delivered through provider.
Apache ZooKeeper
Layer stored locally in the Apache ZooKeeper technology. It is a distributed and redundant layer through a consensus mechanism in ZooKeeper. This layer is a typical choice for writable Layer 0.
The configuration prefix: zk:/.
Note
Administrators can also use the ZooNavigator tool to explore and modify the content of a ZooKeeper layer.
Libraries repository
Content in this layer is provided through a distribution point specified by a URI. A distribution point is a server or a public cloud storage accessible over HTTPS. It is a read-only layer. The distribution over the library's repository is the preferred way of content distribution. The content of the layer is automatically refreshed, so that if the updated content is available at the libraries repository servers, it will be distributed into libraries in deployments.
The configuration prefix: libsreg:/.
Example: libsreg+https://libsreg1.example.com/my-library.
Versioning
This provider supports versioning.
The version is specified in the fragment part of the URL (after # symbol):
Example: libsreg+https://libsreg1.example.com/my-library#v24.11
Versions can be static (i.e. v24.11, not changing after its release) or rolling (i.e. production or main, changes are continuously propagated into a distribution point and hence to deployments).
Tip
The versioning is designed to work with CI/CD process on the library content publisher. Typically, the "main" or golden copy of the library is stored in Git on the CI/CD platform and it is deployed to the distribution point by CI/CD automation.
Resiliency
This provider supports resilient content delivery. You can specify more than one distribution server in the configuration. The TeskaLabs LogMan.io will iterate to other specified servers if the request fails.
Example: libsreg+https://libsreg1.example.com,libsreg2.example.com/my-library
Git
The layer that provides a (read-only) content from a Git repository. It is meant for a continuous delivery of the content from the Git server such as GitHub or GitLab.
The configuration prefixes: git+https:/, git+http:/ or git:/.
Versioning in Git
This provider supports versioning.
The version is specified in the fragment part of the URL (after # symbol):
Example: git+https://github.com/john/awesome_project.git#deployment
The default version is set in the particular Git repository.
The typical values are master or main.
It is used when no fragment is provided.
Versions can be static (i.e. v24.11, not changing after its release) or rolling (i.e. production or main, changes are continuously propagated into a distribution point and hence to deployments).
Filesystem
Layer stored at the filesystem.
Warning
Since the filesystem is local to the node, this layer type is not suitable for use in clusters.
The configuration prefixes: file:/ or /.. (as in absolute filesystem paths).
Microsoft Azure Storage
Layer that provides a (read-only) content from a container located at Microsoft Azure Storage.
The configuration prefix: azure+https:/
Note
If the Container Public Access Level is not set to "Public access", then "Access Policy" must be created with "Read" and "List" permissions and "Shared Access Signature" (SAS) query string must be added to a URL in a configuration:
[library]
providers: azure+https://ACCOUNT-NAME.blob.core.windows.net/BLOB-CONTAINER?sv=2020-10-02&si=XXXX&sr=c&sig=XXXXXXXXXXXXXX
Enabling & disabling the content
Any item of the Library content can be disabled globally or specifically for a tenant. By disabling files, administrators can modify content accessible by users of particular tenant.
The content can be enabled/disabled from the "Library" screen or using /.disabled.yaml file located at the layer 0.
LogMan.io Common Library
LogMan.io Common Library is a distributed content that is located at the highest layers of Library. It represents a default content, provided by the TeskaLabs or partners.
Full-text indexing
The content of the library (all layers) is automatically indexed so that users can quickly search for specific content.
More info
The technical details can be also found here https://docs.teskalabs.com/asab.
Apache Kafka
Apache Kafka
The Apache Kafka serves as a queue to temporarily store events among the LogMan.io microservices. For more information, see Architecture.
Apache Kafka within LogMan.io
Topic naming in event lanes
Each event lane has received, events and others topics specified.
Each topic name contains the name of the tenant and the event lane's stream in the following manner:
received.tenant.stream
events.tenant.stream
others.tenant
received.tenant.stream
The received topic stores the incoming logs for the incoming tenant and event lane's stream.
events.tenant.stream
The events topic stores the parsed events for the given event lane defined by tenant and stream.
others.tenant
The others topic stores the unparsed events for the given tenant.
Internal topics
There are the following internal topics for LogMan.io:
lmio-alerts
This topic stores the triggered alerts and is read by LogMan.io Alerts microservice.
lmio-notifications
This topic stores the triggered notifications and is read by ASAB IRIS microservice.
lmio-lookups
This topic stores the requested changes in lookups and is read by LogMan.io Watcher microservice.
Recommended setup for 3-node cluster
There are three instances of Apache Kafka, one on each node.
The number of partitions for each topic must be at least the same as the number of consumers (3) and divisible by 2, hence the recommended number for partitions is always 6.
The recommended replica count is 1.
Each topic must have a reasonable retention set based on the available size of SSD drives.
In the LogMan.io cluster environment, where average EPS is above 1000 events per second and SSD disk space is below 2 TB, the retention is usually 1 day (86400000 milliseconds). See the Commands section.
Hint
When the EPS is lower or there is more SSD space, it is recommended to set the retention for Kafka topics to higher values like 2 or more days in order to give to the administrators more time to solve potential issues.
To create the partitions, replicas and retention properly, see the Commands section.
Kafka Topics
LogMan.io default topics
The following topics are default LogMan.io topics used to pass processed events among individual components.
| Kafka topic | Producer | Consumer(s) | Type of stored messages |
|---|---|---|---|
received.<tenant>.<stream> |
LogMan.io Receiver | LogMan.io Parsec | raw logs / events |
events.<tenant>.<stream> |
LogMan.io Parsec | LogMan.io Depositor LogMan.io Baseliner | successfully parsed events. |
others.<tenant> |
LogMan.io Parsec | LogMan.io Depositor | unsuccessfully parsed events. |
complex.<tenant> |
LogMan.io Correlator | LogMan.io Watcher | |
lmio-alerts |
LogMan.io Alerts | ||
lmio-lookups |
LogMan.io Lookups | lookup events (information about update of a lookup item) | |
lmio-notifications |
|||
lmio-stores |
LogMan.io topics within Event Lane
After the provisioning of LogMan.io Collector, LogMan.io Receiver automatically creates RECEIVED Kafka topic based on the tenant and stream.
This name is of the form received.<tenant>.<stream>. This topic is unique for every Event Lane.
LogMan.io Parsec consumes from RECEIVED topic and parses the messages. When the parsing succeeds, message is sent to EVENTS topic, when it fails, message is sent to OTHERS topic.
EVENTS topic has the form events.<tenant>.<stream> and is unique for every Event Lane.
OTHERS topic has the form others.<tenant> and stores all incorrectly parsed messages, regardless of the Event Lane, unique for every tenant.
LogMan.io Depositor consumes from both EVENTS and OTHERS topics and sends the messages to the corresponding Elasticsearch indexes.
Example
Suppose the name of the tenant is hogwarts and the name of the stream is microsoft-365. Then the following topics are created:
received.hogwarts.microsoft-365: The topic where raw (unparsed) events are stored.events.hogwarts.microsoft-365: The topic where successfully parsed events are stored.others.hogwarts: If some events are parsed unsuccessfully, they are stored in this topic.
Commands
The following commands serve to create, alter and delete Kafka topics within the LogMan.io environment. All Kafka topics managed by LogMan.io next to the internal ones are specified in event lane declarations which can be found inside /EventLanes folder in Library.
Prerequisites
All commands should be run from Kafka Docker container. It is very convenient to create auxiliary temporary container for admin commands.
docker run --network=host --rm -it confluentinc/cp-kafka:<version> bash
This creates new Kafka container that will be removed after you exit it and is equipped with Kafka Command Line interface, which is documented here: Kafka Command-Line Interface (CLI) Tools
Create a topic
In order to create a topic, specify the topic name, number of partitions and replication factor. The replication factor should be set to 1 and partitions to 6, which is the default for LogMan.io Kafka topics.
/usr/bin/kafka-topics --bootstrap-server localhost:9092 --create --topic "events.<tenant>.<stream>" --replication-factor 1 --partitions 6
Replace events.<tenant>.<stream> with your topic name.
Kafka version less than 7.0
For Kafka versions less than 7.0, the command does not use the --bootstrap-server option but instead uses the --zookeeper option. Here is the command for older Kafka versions:
/usr/bin/kafka-topics --zookeeper localhost:2181 --create --topic "events.<tenant>.<stream>" --replication-factor 1 --partitions 6
Configure a topic
Retention
The following command changes the retention of data for Kafka topic to 86400000 milliseconds, that is 1 day. This means that data older than 1 day will be deleted from Kafka to spare storage space:
/usr/bin/kafka-configs --bootstrap-server localhost:9092 --entity-type topics --entity-name "events.<tenant>.<stream>" --alter --add-config retention.ms=86400000
Replace events.<tenant>.<stream> with your topic name.
Info
All Kafka topics in LogMan.io should have a retention for data set.
Info
When editing a topic setting in Kafka, the special characters like dot (.) should be escaped with slash (\).
Resetting a consumer group offset for a given topic
In order to reset the reading position, or the offset, for the given group ID (consumer group), use the following command:
/usr/bin/kafka-consumer-groups --bootstrap-server localhost:9092 --group "my-console-client" --topic "events.<tenant>.<stream>" --reset-offsets --to-datetime 2020-12-20T00:00:00.000 --execute
Replace events.<tenant>.<stream> with your topic name.
Replace my-console-client with the given group ID.
Replace 2020-12-20T00:00:00.000 with the time to reset the reading offset to.
Hint
To reset the group to the current offset, use --to-current instead of --to-datetime 2020-12-20T00:00:00.000.
Deleting a consumer group offset for a given topic
The offset for the given topic can be deleted from the consumer group, hence the consumer group would be effectively disconnected from the topic itself. Use the following command:
/usr/bin/kafka-consumer-groups --bootstrap-server localhost:9092 --group "my-console-client" --topic "events.<tenant>.<stream>" --delete-offsets
Replace events.<tenant>.<stream> with your topic name.
Replace my-console-client with the given group ID.
Deleting the consumer group
A consumer group for ALL topics can be deleted with its offset information using the following command:
/usr/bin/kafka-consumer-groups --bootstrap-server localhost:9092 --delete --group my-console-client
Replace my-console-client with the given group ID.
Alter a topic
Change the number of partitions
The following command increases the number of partitions within the given topic.
/usr/bin/kafka-topics --bootstrap-server localhost:9092 --alter -partitions 6 --topic "events.<tenant>.<stream>"
Replace events.<tenant>.<stream> with your topic name.
Specify ZooKeeper node
Kafka reads and alters data stored in ZooKeeper. In case you've configured Kafka so its files are stored in specific ZooKeeper node, you will get this error.
Error while executing topic command : Topic 'events.<tenant>.<stream>' does not exist as expected
[2024-05-06 10:16:36,207] ERROR java.lang.IllegalArgumentException: Topic 'events.<tenant>.<stream>' does not exist as expected
at kafka.admin.TopicCommand$.kafka$admin$TopicCommand$$ensureTopicExists(TopicCommand.scala:539)
at kafka.admin.TopicCommand$ZookeeperTopicService.alterTopic(TopicCommand.scala:408)
at kafka.admin.TopicCommand$.main(TopicCommand.scala:66)
at kafka.admin.TopicCommand.main(TopicCommand.scala)
(kafka.admin.TopicCommand$)
Adjust the --zookeeper argument accordingly. E.g. Kafka data is stored in kafka node of ZooKeeper:
/usr/bin/kafka-topics --zookeeper lm11:2181/kafka --alter --partitions 6 --topic 'events\.tenant\.fortigate'
Try to remove escape characters (/) if the topic name is still not recognized.
Delete a topic
The topic can be deleted using the following command. Please keep in mind that Kafka topics are automatically created if new data are being produced/sent to it by any service.
/usr/bin/kafka-topics --bootstrap-server localhost:9092 --delete --topic "events.<tenant>.<stream>"
Replace events.<tenant>.<stream> with your topic name.
Troubleshooting
There are many logs in others and I cannot find the ones with "interface" attribute inside
Kafka Console Consumer can be used to obtain events from multiple topics, here from all topics starting with events..
Next it is possible the grep the field in double quotes:
/usr/bin/kafka-console-consumer --bootstrap-server localhost:9092 --whitelist "events.*" | grep '"interface"'
This command gives you all incoming logs with "interface" attribute from all events topics.
Kafka Partition Reassignment
When a new Kafka node is added, Kafka automatically does not do the partition reassignment. The following steps are used to perform manual reassignment of Kafka partitions for specified topic(s).
-
Enter shell of Kafka Docker container:
docker exec -it kafka-1 bash -
Create
/tmp/topics.jsonwith topics whose partitions should be reassigned in the following format:cat << EOF | tee /tmp/topics.json { "topics": [ {"topic": "events.tenant.stream"}, ], "version": 1 } EOF -
Generate reassignment JSON output from list of topics to be migrated. Specify the broker IDs in the broker list:
/usr/bin/kafka-reassign-partitions --zookeeper localhost:2181 --broker-list "121,122,221,222" --generate --topics-to-move-json-file /tmp/topics.jsonThe result should be stored in
/tmp/reassign.jsonand look as follows, with all topics and partitions having their new assignment specified:[appuser@lm11 data]$ cat /tmp/reassign.json {"version":1,"partitions":[{"topic":"events.tenant.stream","partition":0,"replicas":[122],"log_dirs":["any"]},{"topic":"events.tenant.stream","partition":1,"replicas":[221],"log_dirs":["any"]},{"topic":"events.tenant.stream","partition":2,"replicas":[222],"log_dirs":["any"]},{"topic":"events.tenant.stream","partition":3,"replicas":[121],"log_dirs":["any"]},{"topic":"events.tenant.stream","partition":4,"replicas":[122],"log_dirs":["any"]},{"topic":"events.tenant.stream","partition":5,"replicas":[221],"log_dirs":["any"]}]} -
Use the output from the previous command as input to the execution of the reassignment/rebalance:
/usr/bin/kafka-reassign-partitions --zookeeper localhost:2181 --execute --reassignment-json-file /tmp/reassign.json --additional --bootstrap-server localhost:9092
That's it! Now Kafka should perform the partitions reassignment within the following hours.
For more information, see Reassigning partitions in Apache Kafka Cluster.
Naming Standards
Product repositories
Product repositories contain source codes of the all LogMan.io components (data pumps, services, UI etc.).
Names of product repositories,that are always developed and maintained by TeskaLabs,
always start with lmio- prefix.
Product repositories are not to be modified by customers nor partners.
Site config repositories
Site config repositories contain site configurations of every deployed LogMan.io component, base technology as well as Docker Compose file(s) for the given deployment on a given server.
Site config repositories can also be maintained by a partner or a customer.
Their names always start with site- prefix.
Partners' repositories
Repositories maintained by a partner or a customer always contain their lowercase name after the prefix, separated by dashes.
Hence, for site repositories, the format looks as follows:
site-<partner_name>-<location>
Where location is the deployment location (name of the company that manages the server).
The location, if generally known, can be described in other explicit manner, such
as build-env to signify the build environment.
Notes
Keyword environment is always shortened to env.
Keyword encrypt is always shortened to enc.
Multi-tenancy
TeskaLabs LogMan.io is a multi-tenancy based product, which requires to specify tenant (customer) identification in each log event, which can be done automatically using LogMan.io Collector.
Each LogMan.io Parser instance is tenant-specific as well as indices stored in ElasticSearch. Thus, only logs belonging to the given tenant are displayed to the given tenant in Kibana or LogMan.io UI.
Also, flow monitoring metrics in Grafana are tenant based and thus allow to monitor the flow of logs for each individual customer.
Naming standard
Because of TeskaLabs LogMan.io technology base, all tenant identifications must be lowercase without any special characters (such as #, * etc.).
Tools
List of 3rd party OpenSource tool that can be integrated with TeskaLabs LogMan.io. Once enabled, they are available at "Tools" section of the LogMan.io.
Cyber security
Kibana
Kibana is open software for vizualization of incoming logs. It's one of the Elastic tool. Cyber security teams uses Kibana mainly for analytical tasks.
More info at Kibana Guide
TheHive
TheHive is security incident response platform.
More info at thehive-project.org
MISP
MISP is open software for correlating, storing and sharing cyber security indicators, malware analysis, etc.
More info at misp-project.org
Data science
Jupyter Notebook
JupyterLab is the web-based interactive development environment for notebooks, code, and data. Its flexible interface allows users to configure and arrange workflows in data science, scientific computing, computational journalism, and machine learning. A modular design invites extensions to expand and enrich functionality.
More info at Jupyter Notebook
Technical support
ZooNavigator
ZooKeeper browser and editor.
https://github.com/elkozmon/zoonavigator
Grafana
Observability and data visualization platform. For metrics visualization.
https://github.com/grafana/grafana
KafDrop
Kafka Web UI
Overview of network ports
This chapter contains an overview of the network ports used by LogMan.io. The majority of ports are internal, accessible only from the internal network of the cluster.
Internal network
| Port | Protocol | Component |
|---|---|---|
| tcp/8890 | HTTP | NGINX (Internal API gateway) |
| tcp/8891 | HTTP | asab-remote-control |
| tcp/8892 | HTTP | asab-governator |
| tcp/8893 | HTTP | asab-library |
| tcp/8894 | HTTP | asab-config |
| tcp/8895 | HTTP | asab-pyppeteer |
| tcp/8896 | HTTP | asab-iris |
| tcp/8897 | HTTP | asab-discovery |
| tcp/8900 | HTTP | seacat-auth (Private API) |
| tcp/8910 | HTTP | seacat-pki |
| tcp/8950 | HTTP | lmio-receiver (Private API) |
| tcp/8951 | HTTP | lmio-ipaddrproc |
| tcp/8952 | HTTP | lmio-watcher |
| tcp/8953 | HTTP | lmio-alerts |
| tcp/8954 | HTTP | lmio-elman |
| tcp/8955 | HTTP | lmio-lookupbuilder |
| tcp/8956 | HTTP | lmio-ipaddrproc |
| tcp/8957 | HTTP | lmio-correlator-builder |
| tcp/8958 | HTTP | lmio-charts |
| tcp/8959 | HTTP | lmio-categorix |
| tcp/8960 | HTTP | lmio-integ |
| tcp/8961 | HTTP | lmio-parser-builder |
| tcp/8962 | HTTP | lmio-trex |
| tcp/8999 | HTTP | lmio-feeds |
| tcp/3443 | HTTPS | lmio-receiver (Public API) |
| tcp/3080 | HTTP | lmio-receiver (Public API) |
| tcp/3081 | HTTP | seacat-auth (Public API) |
| tcp/8790 | HTTP | bs-query |
| tcp/8810 | HTTP | ACME.sh |
| tcp/9092 | Kafka | Apache Kafka |
| tcp/9000 | HTTP | Kafdrop |
| tcp/2181 | ZAB | Apache Zookeeper |
| tcp/9001 | HTTP | Zoonavigator |
| tcp/8086 | HTTP | InfluxDB |
| tcp/8888 | HTTP | Jupyter Notebook |
| tcp/5601 | HTTP | Kibana |
| tcp/3000 | HTTP | Grafana |
| tcp/27017 | proprietary | MongoDB |
