Example of a window correlation detection rule
A window correlation rule is a type of detection that can identify combinations of events over time. Before using this example to write your own rule, visit these guidelines to better understand each part of the rule.
Like all detections, write window correlation rules in TeskaLabs SP-Lang.
Sigma Correlations
The Window Correlator is also used as an engine for Sigma Correlations, whose syntax can thus be used natively in LogMan.io. For more information about Sigma Correlations, see Sigma Correlations Documentation.
Jump to: Define | Predicate | Evaluate | Analyze | Trigger
This detection rule is looking for a single external IP trying to access 25 or more unique internal IP addresses in 2 minutes. This activity could indicate an attacker trying search the network infrastructure for vulnerability.
Note
Any line beginning with a hashtag (#) is a comment, not part of the detection rule. Add notes to your detection rules to help others understand the rules' purpose and function.
The complete detection rule using a window correlation:
define:
  name: "Network T1046 Network Service Discovery"
  description: "External IP accessing 25+ internal IPs in 2 minutes"
  type: correlator/window

  risk_score: 20.0

  mitre:
    tactic: TA0007
    technique: T1046

predicate:
  !AND
  - !OR
    - !EQ
      - !ITEM EVENT event.dataset
      - "fortigate"
    - !EQ
      - !ITEM EVENT event.dataset
      - "sophos"
  - !OR
    - !EQ
      - !ITEM EVENT event.action
      - "deny"
    - !EQ
      - !ITEM EVENT event.action
      - "drop"
  - !IN
    what: source.ip
    where: !EVENT
  - !NOT
    what:
      !STARTSWITH
      what: !ITEM EVENT source.ip
      prefix: "193.145"
  - !NE
    - !ITEM EVENT source.ip
    - "8.8.8.8"
  - !IN
    what: destination.ip
    where: !EVENT

evaluate:
  dimension: [tenant, source.ip]
  by: "@timestamp"
  resolution: 60
  saturation: 1

analyze:
  window: hopping
  aggregate: unique count
  dimension: destination.ip
  span: 2
  test:
    !GE
    - !ARG VALUE
    - 25

trigger:
  - event:
      !DICT
      type: "{str:any}"
      with:
        ecs.version: "1.10.0"
        lmio.correlation.depth: 1
        lmio.correlation.name: "Network T1046 Network Service Discovery"

        # Events
        events: !ARG EVENTS

        # Threat description
        # https://www.elastic.co/guide/en/ecs/master/ecs-threat.html
        threat.framework: "MITRE ATT&CK"
        threat.software.platforms: "Network"
        threat.indicator.sightings: !ARG ANALYZE_RESULT

        threat.indicator.confidence: "Medium"
        threat.indicator.ip: !ITEM EVENT source.ip
        threat.indicator.port: !ITEM EVENT source.port
        threat.indicator.type: "ipv4-addr"

        threat.tactic.id: "TA0007"
        threat.tactic.name: "Discovery"
        threat.tactic.reference: "https://attack.mitre.org/tactics/TA0007/"

        threat.technique.id: "T1046"
        threat.technique.name: "Network Service Discovery"
        threat.technique.reference: "https://attack.mitre.org/techniques/T1046/"

        # Identification
        event.kind: "alert"
        event.dataset: "correlation"
        source.ip: !ITEM EVENT source.ip
Define
define:
  name: "Network T1046 Network Service Discovery"
  description: "External IP accessing 25+ internal IPs in 2 minutes"
  type: correlator/window

  risk_score: 20.0

  mitre:
    tactic: TA0007
    technique: T1046
| Item in the rule | What does it mean? |
|---|---|
|
This is the name of the rule. The name is for the users and has no impact on the rule itself. |
|
The description is also for the users. It describes what the rule does, but it has no impact on the rule itself. |
|
The type does impact the rule. The rule uses correlator/window to function as a window correlator.
|
Predicate
predicate is the filter that checks if an incoming log might be related to the event that the detection rule is searching for.
The predicate is made of SP-Lang expressions. The expressions create conditions. If the expression is "true," the condition is met. The filter checks the incoming log to see if the log makes the predicate's expressions "true" and therefore meets the conditions.
If a log meets the predicate's conditions, it gets analyzed in the next steps of the detection rule, alongside other related logs. If a log doesn't meet the predicate's conditions, the detection rule ignores the log.
You can find the full SP-Lang documentation here.
SP-Lang terms, in the order they appear in the predicate
| Expression | Meaning |
|---|---|
!AND |
ALL of the criteria nested under !AND must be met for the !AND to be true |
!OR |
At least ONE of the criteria nested under !OR must be met for the !OR to be true |
!EQ |
"Equal" to. Must be equal to, or match the value, to be true |
!ITEM EVENT |
Gets information from the content of the incoming logs (accesses the fields and values in the incoming logs) |
!IN |
Looks for a value in a set of values (what in where) |
!NOT |
Seeks the opposite of the expression nested under the !NOT (following what) |
!STARTSWITH |
The value of the field (what) must start with the specified text (prefix) to be true |
!NE |
"Not equal" to, or doesn't equal. Must NOT equal (must not match the value) to be true |
You can see that there are several expressions nested under !AND. A log must meet ALL of the conditions nested under !AND to pass through the filter.
| As seen in rule | What does it mean? |
|---|---|
|
This is the first !OR expression, and it has two !EQ expressions nested under it, so at least ONE !EQ condition nested under this !OR must be true. Remember, !ITEM EVENT gets the value of the field it specifies. If the incoming log has "fortigate" OR "sophos" in the field event.dataset, then the log meets the !OR condition.
This filter accepts events only from the FortiGate and Sophos data sources. FortiGate and Sophos provide security tools such as firewalls, so this rule is looking for events generated by security tools that might already be intercepting suspicious activity. |
|
This condition is structured the same way as the previous one. If the incoming log has the value "deny" OR "drop" in the field event.action, then the log meets this !OR condition.
The values "deny" and "drop" in a log both signal that a security device, such as a firewall, blocked attempted access based on authorization or security policies. |
|
If the field source.ip exists in the incoming log (!EVENT), then the log meets this !IN condition.
The field source.ip is the IP address that is trying to gain access to another IP address. Since this rule is specifically about IP addresses, the log needs to have the source IP address in it to be relevant.
|
|
If the value of the field source.ip DOES NOT begin with "193.145," then this !NOT expression is true. 193.145 is the beginning of this network's internal IP addresses, so the !NOT expression filters out internal IP addresses. This is because internal IPs accessing many other internal IPs in a short timeframe would not be suspicious. If internal IPs were not filtered out, the rule would return false positives.
|
|
If the incoming log DOES NOT have the value "8.8.8.8" in the field source.ip, then the log meets this !NE condition.
The rule filters out 8.8.8.8 as a source IP address because it is a well-known and trusted DNS resolver operated by Google. 8.8.8.8 is not generally associated with malicious activity, so not excluding it would trigger false positives in the rule. |
|
If the field destination.ip exists in the incoming log, then the log meets this !IN condition.
The field destination.ip is the IP address that is being accessed. Since this rule is specifically about IP addresses, the log needs to have the destination IP address in it to be relevant.
|
If an incoming log meets EVERY condition shown above (nested under !AND), then the log gets evaluated and analyzed in the next sections of the detection rule.
Evaluate
Any log that passes through the filter in predicate gets evaluated in evaluate. The evaluate section organizes the data so it can by analyzed. Usually, you can't spot a security threat (or other noteworthy patterns) based on just one event (for example, one failed login attempt), so the detection rule groups events together to find patterns that point to security or operational issues.
The evaluate section creates an invisible evaluation window - you can think of the window as a table. The table is what the analyze section uses to detect the event the detection rule is seeking.
evaluate:
  dimension: [tenant, source.ip]
  by: "@timestamp"
  resolution: 60
  saturation: 1
| As seen in rule | What does it mean? |
|---|---|
|
dimension creates the rows in the table. The rows are tenant and source.ip. In the final table, the values of tenant and source.ip are grouped into one row (see the table below).
|
|
by creates the columns in the table. It refers to the field @timestamp because the values from that field enable the rule to compare the events over time. So, each column is an interval of time, which the resolution specifies.
|
|
The resolution unit is seconds, so the value here is 60 seconds. Each time interval will be 60 seconds long.
|
|
The saturation field sets how many times the trigger can be activated before the rule stops counting events in a single cell that caused the trigger (see the table below). Since the saturation is 1, this means that relevant events that happen within one minute of each other will stop being counted after one trigger. Setting the saturation to 1 prevents additional triggers for identical behavior in the same timeframe. In this example, the trigger would be activated only once if an external IP address tried to access any number of unique internal IPs above 25.
|
This is an example of how the evaluate section sorts logs that pass through the predicate filter. (Click the table to enlarge.) The log data is heavily simplified for the sake of readability (for example, log IDs in the field _id are letters rather than real log IDs, and the timestamps are shortened).
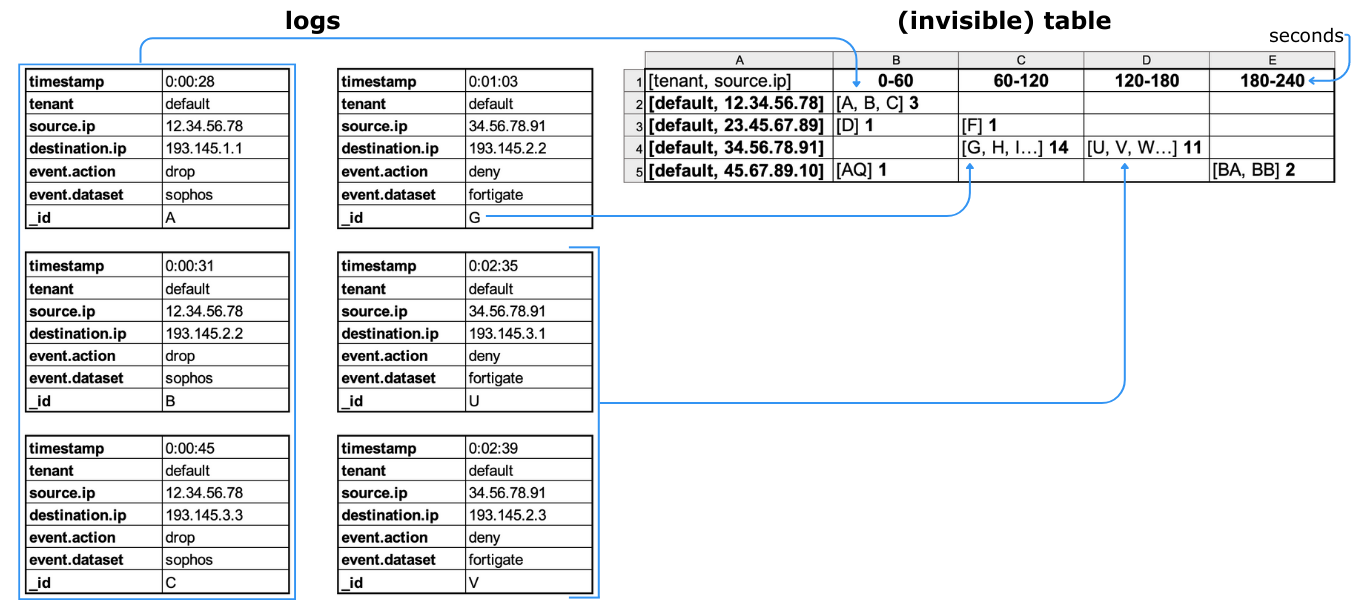
As specified by the dimension field, the logs are grouped by tenant and source IP address, as you can see in cells A2-A5.
Since by has the value timestamp, and the resolution is set to 60 seconds, the cells B1-E1 are time intervals, and the logs are sorted into the columns by their timestamp value.
The number beside the list of log IDs in each cell (for example, 14 in cell C4) is the count of how many logs with the same source IP address passed through the filter in that timeframe. This becomes essential information in the analyze section of the rule, since we're counting access attempts by external IPs.
Analyze
analyze uses the table created by the evaluate section to find out if the event the detection rule is seeking has happened.
analyze:
  window: hopping
  aggregate: unique count
  dimension: destination.ip
  span: 2
  test:
    !GE
    - !ARG VALUE
    - 25
| As seen in rule | What does it mean? |
|---|---|
|
The window type is hopping. The window analyzes a specified number of cells in the table created by evaluate section, each of which represents logs in a timeframe of 60 seconds. Since the type is hopping, the window will count some cells twice to test any adjacent combination of a two-minute time period. Since the span is set to 2, the rule will analyze two minutes (cells) at a time, with overlap.
|
|
The aggregate depends on the dimension. Here, unique count applies to destination.ip. This ensures that the rule won't count the same desination IP address more than once.
|
|
A span of 2 means that the cells in the table will be analyzed 2 at a time. |
|
The !GE expression means "greater than or equal to," and !ARG VALUE refers to the output value of the aggregate function. The value 25 is listed under !ARG VALUE, so this whole test expression is testing for 25 or more unique destination IP addresses in a single analysis window.
|
The red window around cells C4 and D4 shows that the rule has detected what it's looking for - attempted connection to 25 unique IP addresses.
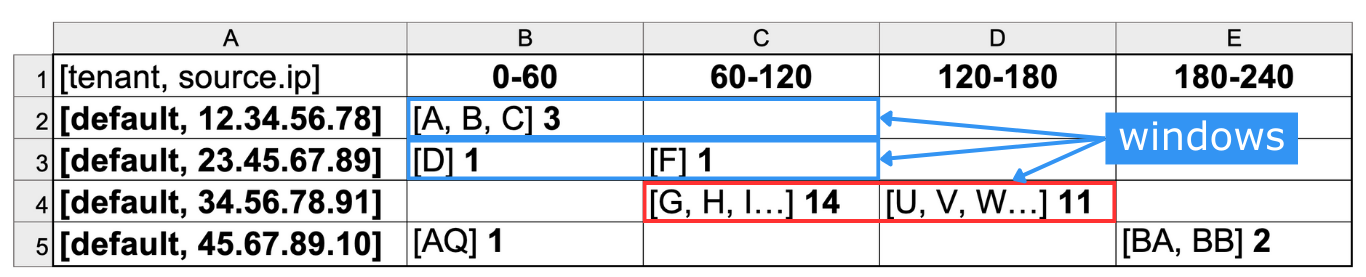
Analysis with a hopping window explained in a gif
This illustrates how the window analyzes the data two cells at a time. When the window gets to cells C4 and D4, it detects 25 unique destination IP addresses.
Trigger
The trigger section defines what happens if the analyze section detects the event that the detection rule is looking for. In this case, the trigger is activated when a single external IP address attempts to connect to 25 or more different interal IP addresses.
| As seen in rule | What does it mean? |
|---|---|
|
In the trigger, event means that the rule will create an event based on this positive detection and send it into the data pipeline via Elasticsearch, where it is stored as a document. Then, the event comes through to TeskaLabs LogMan.io, where you can see this event in Discover and in dashboards.
|
|
!DICT creates a dictionary of keys (fields) and values. type has "st:any" (meaning string) so that any type of value (numbers, words, etc) can be a value in a key-value pair. with begins the list of key-value pairs, which you define. These are the fields and values that the event will be made of.
|
To learn more about each field, click the icons. Since TeskaLabs LogMan.io uses Elasticsearch and the Elastic Common Schema (ECS), you can get more details about many of these fields in the ECS reference guide.
trigger:
  - event:
      !DICT
      type: "{str:any}"
      with:
ecs.version: "1.10.0" #(1)
lmio.correlation.depth: 1 #(2)
lmio.correlation.name: "Network T1046 Network Service Discovery" #(3)
# Events
events: !ARG EVENTS #(4)
# Threat description
# https://www.elastic.co/guide/en/ecs/master/ecs-threat.html
threat.framework: "MITRE ATT&CK" #(5)
threat.software.platforms: "Network" #(6)
threat.indicator.sightings: !ARG ANALYZE_RESULT #(7)
threat.indicator.confidence: "Medium" #(8)
threat.indicator.ip: !ITEM EVENT source.ip #(9)
threat.indicator.port: !ITEM EVENT source.port #(10)
threat.indicator.type: "ipv4-addr" #(11)
threat.tactic.id: "TA0007" #(12)
threat.tactic.name: "Discovery" #(13)
threat.tactic.reference: "https://attack.mitre.org/tactics/TA0007/" #(14)
threat.technique.id: "T1046" #(15)
threat.technique.name: "Network Service Discovery" #(16)
threat.technique.reference: "https://attack.mitre.org/techniques/T1046/" #(17)
# Identification
event.kind: "alert" #(18)
event.dataset: "correlation" #(19)
source.ip: !ITEM EVENT source.ip #(20)
- The version of the Elastic Common Schema that this event conforms to - required field that must exist in all events going to Elasticsearch.
- The correlation depth indicates if this rule depends on any other rules or is in a chain of rules. The value 1 means that it is either the first in a chain, or the only rule involved - it doesn't depend on any other rules.
- The name of the rule
- In SP-Lang,
!ARG EVENTSaccesses original logs. So, this will list the IDs all of the events that make up this positive detection, so that you can investigate each log individually. - Name of the threat framework used to further categorize and classify the tactic and technique of the reported threat. See ECS reference.
- The platforms of the software used by this threat to conduct behavior commonly modeled using MITRE ATT&CK®. See ECS reference.
- Number of times this indicator was observed conducting threat activity. See ECS reference.
- Identifies the vendor-neutral confidence rating using the None/Low/Medium/High scale defined in Appendix A of the STIX 2.1 framework. See ECS reference.
- Identifies a threat indicator as an IP address (irrespective of direction). See ECS reference.
- Identifies a threat indicator as a port number (irrespective of direction). See ECS reference.
- Type of indicator as represented by Cyber Observable in STIX 2.0. See ECS reference.
- The id of tactic used by this threat. See ECS reference.
- The name of the type of the tactic used by this threat. See ECS reference.
- The reference url of tactic used by this threat. See ECS reference.
- The id of technique used by this threat. See ECS reference.
- The name of technique used by this threat. See ECS reference.
- The reference url of technique used by this threat. See ECS reference.
- The type of event
- The dataset that this event will be grouped in.
- The source IP address associated with this event (the one that tried to access 25 internal IPs in two minutes)